
 ?Mathematical formulae have been encoded as MathML and are displayed in this HTML version using MathJax in order to improve their display. Uncheck the box to turn MathJax off. This feature requires Javascript. Click on a formula to zoom.
ABSTRACT
At least 68 cities in the United States have taken a Vision Zero pledge to eliminate traffic fatalities. Which cities have improved their traffic safety outcomes and which strategies have proven effective? We examined changes in counts and per capita rates of all, pedestrian, and bicyclist fatal motor vehicle collisions between 2007 and 2019 for 18 U.S. cities that took early Vision Zero pledges. Only 2 of the 18 cities have experienced statistically significant decreases in total fatalities since taking a Vision Zero pledge and only one city experienced a statistically significant decrease in pedestrian fatalities. Cities with high walking, biking, and transit mode share and those that focused on walking and biking in their Vision Zero action plans experienced the best outcomes. Cities with high population densities and those that focused on technology in their action plans were also found to have safety performance improvements.
Introduction
At least 68 cities in the United States (U.S.) have taken a Vision Zero pledge to eliminate fatalities and severe injuries from their transportation systems. Vision Zero is founded on the belief that everyone has the right to safe mobility and that planners, engineers, and policymakers share responsibility to ensure safe travel options for all road users. However, strategies to accomplish Vision Zero are varied, and tactics promoted by national Vision Zero organizations such as ‘integrate human failing’ and ‘systems approach’ are broad and open for interpretation (Kim, Muennig, and Rosen Citation2017; Vision Zero Network Citation2017). It is still unclear which – or whether – efforts have moved U.S. Vision Zero cities toward their goals.
The concept of Vision Zero originated in Sweden in the 1990s. Between 1990 and 2015, Sweden experienced a 66% reduction in traffic fatalities (OECD/ITF Citation2016) and now has one of the lowest annual road death rates in the world at 2.8 per 100,000 residents, compared to 12.4 in the U.S. (World Health Organization Citation2019). Vision Zero has been adopted throughout Europe with success. A Vision Zero city with approximately 680,000 residents, Oslo, Norway, had zero pedestrian fatalities, zero bicycle fatalities, and only one traffic death in 2019 (Short Citation2020).
Since 2012, at least 68 U.S. cities have taken a Vision Zero pledge. The first U.S. city to officially pledge to eliminate traffic fatalities was Chicago, IL, in 2012, although they did not formally call the effort Vision Zero until 2017 (Chicago Department of Transportation (CDOT) Citation2012). Austin, TX; New York City, NY; Los Angeles, CA; and San Francisco, CA, took Vision Zero pledges in 2014 (Examiner Staff Citation2014; Flegenheimer Citation2014). Since then, there has been a rapid increase in pledging with about a dozen U.S. cities making a pledge each year between 2015 and 2019. U.S. cities have typically committed to reach zero traffic fatalities within 5–15 years (Fremont, CA, by 2020; Washington, DC, by 2024; Los Angeles, CA, Austin, TX, and Portland, OR, by 2025; Boston, MA, Denver, CO, Philadelphia, PA, Richmond, VA, and Seattle, WA, by 2030).
Although cities are the most frequent pledgers, states such as Maryland, North Dakota, and North Carolina have also taken Vision Zero pledges. Regional entities such as the Regional Transportation Commission of Washoe County (representing Truckee Meadows in northern Nevada) and the Denver Regional Council of Governments (representing 56 municipalities and counties in the Denver area) have also taken Vision Zero pledges. A recent U.S. survey shows that awareness of Vision Zero is high, with 97.3% of transportation planning/engineering professionals being aware of the traffic safety program (Evenson, LaJeunesse, and Heiny Citation2018).
While awareness is high and many jurisdictions have taken a Vision Zero pledge, there is a lack of analysis identifying which – or whether – U.S. efforts have been successful. Previous research has identified that the U.S. as a whole is lagging behind peer developed countries in terms of Vision Zero (Ahangari et al., Citation2016). Several studies published by popular media outlets have examined individual U.S. Vision Zero cities over varying time frames and have generally found that U.S. cities are falling short of their goals (Barone Citation2019; Bosselman Citation2019; Nelson Citation2019; Schmitt Citation2019; Swan Citation2019). However, important knowledge gaps are still present as these articles did not account for exposure or statistical significance. Research exploring the impact of varying strategies and the specific outcomes of vulnerable road users is also warranted yet lacking.
Vehicle speed reductions were found to be an important part of New York City’s Vision Zero strategy and correlated with a reduction in collisions and injuries on the street level of geography, which aligns with past research confirming the positive safety implications of speed reductions (Hou, Edara, and Sun Citation2013; Mammen, Shim, and Weber Citation2020). Researchers examining outcomes on the state level have also identified automobile dependency as an important barrier to U.S. Vision Zero efforts (Ahangari, Atkinson-Palombo, and Garrick Citation2017). While these findings are promising, Mammen, Shim, and Weber (Citation2020) only focused on one strategy for one city, while Ahangari, Atkinson-Palombo, and Garrick (Citation2017) focused on all states in the U.S. regardless of whether they took a Vision Zero pledge. More research is warranted to understand whether vehicle speed reductions, alleviating automobile dependence, or other Vision Zero strategies are widely effective in Vision Zero cities.
Other research on Vision Zero strategies has recommended tactics focused on education and technology such as devices that help capture crash data or detect speeds and red light cameras (Cushing et al. Citation2016; Fleisher, Wier, and Hunter Citation2016; Lee, Lee, and Do Citation2016). Naumann et al. (Citation2019) also identified the importance of interagency collaboration within Vision Zero cities, finding that most Vision Zero collaborators are government organizations. However, these recommendations were based on the frequency of strategy utilization and did not quantitatively analyze the effectiveness of those efforts in terms of safety outcomes.
While past Vision Zero research suggests that speed management, alleviating automobile dependence, education, collaboration, and technology may be appropriate strategies, there is no comprehensive study statistically evaluating and comparing outcome-based performances of multiple strategies across numerous U.S. Vision Zero cities. Furthermore, there has been little focus on the impact of city characteristics such as population, population density, mode share, and time since taking a pledge. Importantly, little research to date has focused on vulnerable road users, a critical indicator species for transportation safety (Burbidge and Goulias Citation2009; Danaf et al. Citation2020). Such quantitative, outcome-based research is direly needed to guide future efforts as dozens of cities continue to pursue Vision Zero.
We address these knowledge gaps by evaluating the performance of 18 early-pledge U.S. cities that took a Vision Zero pledge between 2012 and 2016. We examine changes in counts and per capita rates of fatal traffic collisions, fatal pedestrian collisions, and fatal bicycle collisions using 2007–2019 data from the Fatality Analysis Reporting System (FARS). We test statistical significance of before/after changes with t-tests and post-pledge trends with polynomial regressions. We examine safety outcomes versus city characteristics such as commute mode, population, population density, time since taking a pledge, and action plan strategies with Spearman’s rank-order correlations and linear regressions. We believe that identifying cities, strategies, and characteristics that are correlated with improved safety outcomes will help to guide cities to Vision Zero success.
Data
Through an exhaustive literature review and web search, we identified 68 U.S. cities that have taken a Vision Zero pledge as of early 2020 and recorded the pledge year and month for each city. Vision Zero pledges came in a variety of forms including executive orders from mayors, city council commitments, strategic plan publications, and the formation of advisory committees.
For this research, we selected cities that took their pledge in 2016 or earlier, allowing us to have at least three complete years of post-pledge fatality data. In addition, we removed all cities that averaged less than five fatal collisions per year from the analysis because high variance relative to their means made it difficult to interpret trends. Using these criteria, the number of Vision Zero cities considered for this study was narrowed from 68 to 18 ().
Table 1. Fatal collisions per year in Vision Zero study cities (pledge years highlighted).
We gathered fatal motor vehicle collision data from 2007 to 2019 for the entire U.S. in GIS point shapefile format from the National Highway Traffic Safety Administration’s (NHTSA) FARS database (). This data provides information on all reported motor vehicle collisions on public U.S. roadways that resulted in a mortality within 30 days of the incident. While Vision Zero also endeavors to eliminate severe injuries, non-fatal injury collisions are not consistently collected for all cities, and data were not always publicly available, precluding a comprehensive severe injury analysis (Nadimi, Ragland, and Amiri Citation2020; Nadimi, Amiri, and Sadri Citation2021). The U.S. Census Bureau’s Topologically Integrated Geographic Encoding and Referencing (TIGER) data provided city boundaries in GIS polygon shapefile format. We derived counts of fatal collisions, collisions where a pedestrian was killed, and collisions where a bicyclist was killed for each city and each year using spatial joins between the collision points and the boundary polygons in GIS.
We first analyzed cities’ safety outcomes relative to population, population density, and commute mode. Populations were pulled from American Community Survey (ACS) 5-year estimates conducted by the U.S. Census Bureau. We gathered populations for every year of the study (2007–2019) so that we could create a rate of fatal collisions per capita for each year of the study period. We calculated population density by dividing each city’s average population over the study period by the area of land in square kilometers within each city as provided by the U.S. Census Bureau’s TIGER boundaries. Commute mode share was also pulled from 5-year ACS estimates provided by the U.S. Census Bureau. We used the field ‘Means of Transportation to Work’ that covers workers 16 years and over and calculated the average commute mode share value for all study years over the study period for each city.
We then explored whether any Vision Zero action plan strategies were associated with improved safety outcomes by referring to each city’s Vision Zero action plan (City and County of Denver Citation2017; City of Anchorage Citation2018; City of Austin Citation2016; City of Boston Transportation Department Citation2016; City of Chicago Citation2017; City of Fort Lauderdale Transportation and Mobility Department Citation2018; City of Fremont Citation2016; City of Los Angeles Citation2017; City of New York Citation2014; City of Philadelphia Citation2017; City of Portland Citation2016; City of San Diego Citation2019; City of San Jose Citation2020; City of Seattle Citation2015; Government of the District of Columbia Citation2015; Richmond Virginia Department of Public Works Citation2017; Vision Zero Citation2019). Because San Antonio’s action plan was not in a format that our word counting software could process, we instead used their Vision Zero Overview publication (City of San Antonio Citation2016). All of the Vision Zero action plan and overview documents were publicly available on the internet.
Methods
Before/after analysis
We first wanted to explore whether any cities had statistically significant decreases in fatal collisions after taking a Vision Zero pledge. We considered every year before the pledge year as the before period and every year after the pledge year as the after period for each city individually. Before periods ranged from 5 to 9 years and after periods ranged from 3 to 7 years. T-tests compared fatal collision frequencies from the before period to those from the after period. Comparing the means for the before and after periods helped to smooth the relatively variable trends that some cities have experienced. This is a common approach for before/after analyses of traffic collision frequencies (Kim, Myeong, and Kweon Citation2011; Naznin et al. Citation2016; Rundmo and Iversen Citation2004). We performed this analysis for total, pedestrian, and bicycle fatal collisions.
Because 17 of the study cities had increases in population between 2007 and 2019, it is possible that road safety improvements occurred even as total fatality counts were increasing. We therefore wanted to account for exposure, or the amount of risk experienced by road users.
There are several ways to account for exposure. The broadest exposure metric is population, which would be used to derive per capita fatality rates. Using population as exposure treats traffic safety as a public health issue by measuring residents’ risk of being killed regardless of what form of transportation they choose. On the other hand, activity-based exposure metrics can be used to measure the safety of specific activities and include variables such as the number of people using a certain mode, the time spent on the road, or the distance traveled. For instance, the number of traffic fatalities per vehicle miles traveled (VMT) is illustrative of the safety of driving (Marshall and Ferenchak Citation2017).
Although the goal of Vision Zero is to reach zero fatalities regardless of exposure, we decided to also measure fatality rates to understand whether safety was improving in our study cities, even if overall fatality counts were increasing. Because Vision Zero includes all citizens and not just those using a specific mode, we took a public health perspective. For all three modes studied in this paper, we derived per capita fatality rates by dividing the number of fatalities that occurred each year by the population for that year. We performed t-tests to compare fatal collision rates (per capita) before taking a pledge versus fatal collision rates (per capita) after taking a pledge.
While we believe that the public health analysis approach fits well with the Vision Zero commitment, we did consider activity-based analyses since it is possible that driving, walking, or biking activity increased more or less than population growth. However, we could not find longitudinal exposure data on the city level that was consistent across all study cities. While we considered using commuter data from the census, that data only measures trips to work and neglects recreational and other types of trips. We therefore determined that using such data would provide an incomplete picture of exposure and safety for those activities. Future work might focus on specific cities that have collected longitudinal exposure data for driving, walking, or biking or focus on specific corridors or intersections for which activity-based exposure data was collected both before and after Vision Zero treatment installation.
Temporal trends
After gaining an understanding of which cities have experienced the best outcomes, we wanted to better understand how each city’s trend temporally progressed. It might be possible that Vision Zero efforts take years to show results, which would not be readily apparent with before/after analyses. We therefore derived the percentage change in fatal collision rates (fatalities per capita) relative to the baseline year for each city and year in the study period. We defined the baseline year as the year before the pledge. To avoid the impact of regression toward the mean, we calculated moving averages. Each year’s moving average was calculated as the sum of one-half the year’s fatality rate, one-quarter the preceding year’s fatality rate, and one-quarter the following year’s fatality rate. For the first year of the study (2007), the moving average was calculated as two-thirds the 2007 rate plus one-third the 2008 rate. For the last year of the study (2019), the moving average was calculated as two-thirds the 2019 rate plus one-third the 2018 rate. We only examined total fatal collision rates for this temporal analysis because pedestrian fatal collisions closely mirrored the overall trends and bicycle fatal collisions had small sample sizes. We completed this analysis for all study cities as well as for the U.S. as a whole.
We visualized the temporal trends using scatterplots and then fit linear, quadratic, and cubic regressions to the post-pledge fatality rate data. A significant linear trend would signify a consistent change in fatality rates after a city’s pledge. A significant quadratic trend would signify that a city’s trend changed direction at some point after their pledge. For example, a quadratic trend could help identify the situation mentioned above where a city’s fatality rate continues to increase for a few years after their pledge but then begins to decrease after Vision Zero strategies take effect. A significant cubic trend would signify two reversals in direction after a city’s pledge. Given the relatively small sample size of post-pledge years, we determined that any higher-level polynomial models would be essentially meaningless and therefore did not pursue regressions above the third order. For each city, we developed linear, quadratic, and cubic regressions and included the model with the most significance based on p-value in our results. We reported each model’s fit with an r-squared value and detailed the coefficients for each regression to indicate the direction of the trend.
City characteristics
We then examined safety performance relative to city characteristics such as commute mode, city population, population density, and time since taking a Vision Zero pledge using Spearman’s rank-order correlations (Equationequation 1(1)
(1) ). Spearman’s rank-order correlation is a nonparametric statistical test where two variables are ranked and the difference between those ranks is used to derive a correlation coefficient. The output is a Spearman’s rank-order correlation coefficient that takes a value from −1 to +1. A coefficient of −1 represents a perfect negative correlation, a coefficient of 0 represents no correlation, and a coefficient of +1 represents a perfect positive correlation between the two variables in the model. For each test, the before/after percent change in fatality rate (per capita) was the first variable, and the city characteristic being analyzed was the second variable. Because there were no tied ranks, the equation used was:
where
ρ = Spearman’s rank-order correlation coefficient
r = ranking position of the first variable
s = ranking position of the second variable
n = sample size
For the Spearman’s rank-order correlation, the population variable was each city’s average population over the study period, population density was the average population divided by area (again in square kilometers), and the commute mode variable was the average mode share percentage over the study period. We did not analyze changes in population, population density, or commute mode here as we were interested in the level of these variables relative to other cities, not the internal change within each city. In other words, we wanted to be able to say that – for example – cities with the highest walking mode share had the best outcomes, not that the cities that had the largest change in walking mode share had the best outcomes.
For each modes’ per capita fatality rates, we then built linear regression models to explore how the city characteristics and fatality rates were related. Fatality rate (fatalities per capita) was the dependent variable and city characteristics (commute mode share, population, population density, and time since pledge) were the independent variables. We derived Pearson correlation coefficients for the independent variables and removed any variables that were significantly correlated in order to avoid collinearity in our models. We converted each independent variable data point into a z-score so that coefficients could be compared across variables (Equationequation 2(2)
(2) ).
where
Z = z-score
x = observed value
µ = mean of sample
σ = standard deviation of sample
Action plan strategies
We then explored whether any Vision Zero action plan strategies were associated with improved safety outcomes. Referring to each city’s Vision Zero action plan, we counted the number of times each word was used in each document. We translated these counts into frequencies by dividing each count by the total word count for each document. We analyzed words representing vulnerable road users (pedestrian and bicycle), tactics recommended by past research in our literature review (speed, enforcement, education, collaboration, and technology), and specific countermeasures/roadways (crossing, intersection, camera, light, and arterial). The term ‘camera’ was included as several cities discussed using automated enforcement with cameras. The term ‘light’ was included as there have been worrying nighttime traffic safety issues reported in recent years (Ferenchak and Abadi Citation2021; Retting Citation2019).
We counted all related words for each term. For example, for bicycle, we counted bicycle, bicycles, bicyclist, bicyclists, bike, bikes, biking, and so on. We also went through and double-checked that each term was used in relation to proposed actions or strategies. For instance, we ensured that the word ‘street’ was used in reference to specific street-related actions or strategies, as opposed to references to general groups or departments.
For each term, we divided cities into two samples: those with the highest 50% of frequencies and those with the lowest 50% of frequencies. We compared percentage changes in fatality rates for high-frequency samples versus low-frequency samples with t-tests.
This approach used the assumption that if a city decided to focus on a specific strategy, facility, or user (for example, education or pedestrians), we would expect that city’s action plan to mention that term more frequently. It may be that cities used terms in a negative connotation (for example, ‘Bicycling is an unsafe activity on which we should not focus.’), but we anticipate that this occurred infrequently and would not lead to high usage of that term. Also, while there are different writing styles that may lead to terms being used more or less frequently, we believe that if a city has chosen a specific focus, they will spend more time and words describing their efforts toward that focus.
It is important to note that words and actions may differ. Just because a city has a specific focus in their action plan (pedestrians, for example) does not guarantee that investments will be concentrated on this focus. Furthermore, tactics may vary for a specific focus. One city focusing on pedestrian safety may invest in physical infrastructure, while another city may pursue educational campaigns. More work is needed – likely on the scale of individual cities – to understand which tactics are being pursued in the name of Vision Zero and which are effective.
Results
The study cities represented a broad range of the study variables with the smallest 2019 population being Fort Lauderdale at 182,434 residents and the largest being New York City at 8,336,817 residents, the lowest population density being Anchorage at 6.5 residents per square kilometer and the highest being New York City at 1,066.7 residents per square kilometer, and the lowest single-occupancy vehicle commute mode share in New York City at 22.6% and highest in San Antonio at 78.9% (). The study cities were also well distributed geographically, having locations across the continental U.S. and in Alaska.
Table 2. Descriptive statistics.
Before/after analysis
Three of the 18 U.S. Vision Zero cities studied have seen decreases in total fatal collisions in the after period relative to the before period (). Only two of these decreases are statistically significant at 95% confidence (New York City and Chicago). Inversely, of the 15 cities that have seen increases in total fatal collisions, five were statistically significant. Six cities saw fatal collision increases greater than 25%, while none of the decreases reached that level.
Table 3. T-test results for annual fatal collision counts in before vs. after periods (statistically significant at 95% confidence in bold; sorted by percentage change in total fatal collisions).
Trends in fatal pedestrian collisions closely mirrored overall trends. The three cities that experienced decreases in fatal pedestrian collisions were also three of the four best performing cities in terms of total fatal collisions. Only New York City experienced a statistically significant decrease in fatal pedestrian collisions. Worryingly, 10 cities saw statistically significant increases in fatal pedestrian collisions, which mirrors national increases over the last decade. Ten of the pedestrian increases were above 25%, while none of the decreases reached that level.
Trends in fatal bicycle collisions varied, most likely because of small sample sizes. While five cities experienced decreases, none were statistically significant. Four cities experienced statistically significant increases in fatal bicycle collisions. Again, many of these sample sizes were small, calling into question the meaningfulness of the increases, but Los Angeles had the second-largest sample size and a statistically significant 115% increase.
While many cities experienced increases in fatal collisions, 17 of the cities also experienced increases in population during the study, motivating a per capita fatal collision rate analysis (). Fatality rate results were similar to those for fatal collision frequencies. New York City and Chicago were still the only two cities with statistically significant overall decreases. Four cities experienced statistically significant increases in total per capita fatality rates, with Austin’s total increase from becoming non-significant in after accounting for its change in population. New York City is still the only city that experienced a statistically significant pedestrian decrease. Six cities experienced statistically significant pedestrian fatal collision rate increases. Bicycle trends were still varied, with no statistically significant decreases and three statistically significant increases.
Table 4. T-test results for annual fatal collision rates in before vs. after periods (total and pedestrian per 1,000k residents, bicycle per 10,000k residents; statistically significant at 95% confidence in bold; sorted by percentage change in total fatal collision rates).
In summary, New York City and Chicago have experienced some of the best outcomes after taking their Vision Zero pledges. New York City stands out in particular as it experienced the largest percentage decreases in total fatal collisions and rates (both statistically significant), the largest percentage decrease in fatal pedestrian collisions (statistically significant), and decreases in fatal bicycle collisions and rates (although not statistically significant). Chicago experienced the second-largest decrease in total fatal collisions and the third-largest decrease in total rates (the only other statistically significant decreases) and decreases in pedestrian collisions and rates (although not statistically significant). San Francisco and Washington also experienced several strong decreases that are worth noting and performed consistently well across the modes, although their decreases were not statistically significant.
The worst outcomes were experienced by Portland, which saw the largest increases in overall collisions and rates (both statistically significant), the fourth and fifth-largest increases in pedestrian collisions and rates (both statistically significant), and strong increases in bicycle collisions and rates (not statistically significant). Austin, Denver, Fort Lauderdale, Los Angeles, Portland, San Antonio, and San Jose all experienced increases in both frequencies and rates for every mode, with many of the increases being statistically significant. Overall, U.S. Vision Zero cities appear to be falling short of their goals, although there are a few examples of success. Future Vision Zero research would benefit from an in-depth focus on the actions taken by these cities that have performed particularly well or poorly.
Temporal trends
New York City was the only city with a statistically significant and relatively consistent downward trend in post-pledge fatality rates ( and ). New York City’s cubic regression with a positive cubic coefficient signifies that while fatality rates decreased relatively consistently for 4 years after their pledge, there was an increase in 2019 (). It is also important to note that New York City’s decrease occurred while the wider national trend was increasing during much of their post-pledge time (). While Chicago was identified as having significantly lower fatality rates after pledging in the previous section, Chicago’s post-pledge temporal trend was actually a non-significant quadratic regression with a positive quadratic coefficient. These results mean that while Chicago’s fatality rate decreased immediately after their pledge, the trend reversed direction and fatality rates were increasing for the last four years of the study ( and ). In other words, while Chicago fatality rates were overall lower in the post-pledge period than the pre-pledge period, the rates were unfortunately increasing for the last four years of the study. Therefore, both cities with fatality rates that were significantly lower after their pledge unfortunately had increases at the end of the study period.
Figure 1. Temporal patterns of annual fatal collision rates (total fatalities per capita) relative to baseline years.
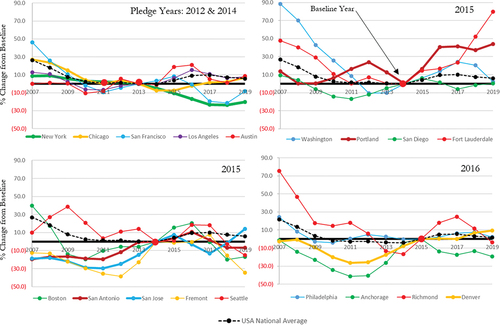
Table 5. Most significant regression models (linear, quadratic, or cubic) for post-pledge periods. Regressions explore fatal collision rates (total fatalities per capita) versus year from baseline (statistically significant at 95% confidence in bold).
An interesting temporal trend emerged where seven cities experienced post-pledge fatality rate increases that subsequently reversed into decreases in 2017 or 2018. These cities included Boston, Fremont, Philadelphia, Richmond, San Antonio, Seattle, and Washington (although only Fremont, Philadelphia, Richmond, and Washington reached statistical significance) ( and ). Fremont and Richmond were best represented by quadratic equations with negative quadratic coefficients, while Philadelphia and Washington were best represented by cubic regressions with negative cubic coefficients, both of which see decreasing fatality rates at the end of the study period. This pattern suggests that these cities’ efforts may be taking effect after an initial lag. While this pattern somewhat mirrors the national trend, the downward trends in most of the Vision Zero cities were stronger than the national trend, suggesting that Vision Zero efforts may take several years to begin to materialize into traffic safety improvements.
Denver and Fort Lauderdale both experienced statistically significant positive linear fatality rate trends after their Vision Zero pledges ( and ). Portland was best represented by a quadratic equation with a negative quadratic coefficient, meaning that although the city experienced a strong increase in fatality rates immediately after pledging, fatality rates leveled off by the end of the study period.
City characteristics Section
Commute mode had strong and statistically significant relationships with total and pedestrian fatality rate outcomes (). Throughout Section 4.3, we do not detail bicycle fatal collision rates because all relationships were weak and none were statistically significant, likely because of small sample sizes. Spearman’s rank-order correlation coefficients (rs) less than 0.40 are weak, between 0.40 and 0.59 are moderate, and greater than or equal to 0.60 are strong.
Table 6. Spearman’s rank-order correlation results for fatal collision rates (fatalities per capita) versus city characteristics (statistically significant at 95% confidence in bold).
For total and pedestrian fatal collision rates (fatalities per capita), commuting by single-occupancy vehicle (SOV) had a strong and statistically significant positive relationship (i.e. cities with higher rates of SOV had larger increases in fatal collision rates). Transit and walking had strong and statistically significant negative relationships (i.e. cities with more transit and walking had larger decreases in fatal collision rates). These results agree with past research that found that automobile dependency was an important barrier to U.S. Vision Zero success (Ahangari, Atkinson-Palombo, and Garrick Citation2017).
Because the two cities that experienced statistically significant decreases in fatal collision rates in Before/After analysis Section (New York City and Chicago) also had two of the largest populations, we analyzed the relationship between city population and safety outcomes. Spearman’s rank-order correlations between city population and fatal collision rates were weak and did not reach statistical significance for either total, pedestrian, or bicycle fatality rates (). Corroborating these findings, the second- and fifth-largest cities (Los Angeles and San Antonio, respectively) saw relatively strong increases for all three fatal collision rate categories, while the smaller San Francisco (ninth largest) performed relatively well. This suggests a lack of correlation between city population and Vision Zero outcomes.
There was a moderate to strong and statistically significant negative relationship between total and pedestrian fatal collision rates and population density (). This is interpreted as cities with higher population densities experiencing larger decreases in total and pedestrian fatal collision rates. Cities with high population densities (New York City, San Francisco, Boston, and Chicago had the highest population densities) performed relatively well, while cities with low population densities performed relatively poorly. These findings agree with the commute mode findings as cities with higher population densities generally have higher rates of transit use and walking.
Although the relationships between total and pedestrian fatal collision rates and time since pledging were positive (i.e. earlier pledges have had larger increases in fatal collision rates), these correlations were weak and did not reach statistical significance (). New York City, Chicago, and San Francisco were the three earliest pledgers and have performed well. However, the fourth, fifth, and sixth earliest pledgers (Los Angeles, Austin, and Portland, respectively) have performed relatively poorly. Time since pledging does not appear to be a key determinant of Vision Zero success, which aligns with our findings from Temporal trends Section.
We then derived linear regression models using the before/after change in per capita fatality rates as the dependent variable and city characteristics as explanatory variables. We first calculated Pearson correlation coefficients for all explanatory variables to avoid collinearity. Because all commute mode shares were significantly correlated, we kept the strongest and most significant mode share (single-occupancy vehicle) in the model while removing all the other mode shares. Population density was also highly correlated with mode share, so we removed that variable from the regression models. Total population and year since pledge were not correlated with the remaining explanatory variables, so they remained in the regression models. Because all explanatory variables were converted to z-values, each variable’s coefficient can be directly compared to the other coefficients.
SOV mode share was again the strongest variable related to changes in fatality rates (). The positive SOV coefficients mean that cities with higher levels of SOV commuting experienced the largest increases in fatality rates. Neither total population nor time since pledge reached statistical significance ().
Table 7. Regression results for fatal collision rates (fatalities per capita) versus city characteristics (statistically significant at 95% confidence in bold).
Action plan strategies
In , a negative relationship indicates that the use of a term was correlated with a larger fatal collision rate decrease (i.e. the term was associated with safety improvements). First, focusing on modal strategies, cities that focused on pedestrians in their action plans saw larger decreases in pedestrian fatal collision rates (statistically significant at 90% confidence). Cities that focused on bicyclists in their action plans saw larger decreases in bicycle fatal collision rates (statistically significant). Cities that focused on these vulnerable road users saw consistent decreases in total, pedestrian, and bicycle fatal collision rates, although not all were statistically significant. This indicates that cities that have focused on vulnerable road users have had successful outcomes and agrees with mode share findings from City characteristics Section and past research (Ahangari, Atkinson-Palombo, and Garrick Citation2017).
Table 8. T-test results for action plan strategies versus fatality rates (fatalities per capita) (statistically significant at 95% confidence in bold).
Technology also stands out as an important term. Cities that focused on technology saw fatal collision rate decreases for all modes, with pedestrian and bicyclist rates reaching statistical significance (). Similarly, the term ‘camera’ (which we included for automated enforcement) was associated with fatal collision rate decreases for all modes, although not reaching statistical significance. Similarly, ‘arterial’ had a negative relationship with all modes and was statistically significant for pedestrians.
On the other hand, enforcement was positive for every mode and was statistically significant for pedestrians. Collaboration was positive for total and pedestrian fatality rates and statistically significant for the latter. These findings suggest that although these strategies have been identified by past research and are widely used, they are not associated with improved safety outcomes (Cushing et al. Citation2016; Fleisher, Wier, and Hunter Citation2016).
Conclusions
Have U.S. Vision Zero cities made progress toward their goals and for which modes? New York City has seen the most success with significant decreases in fatal collisions and collision rates after taking their Vision Zero pledge. San Francisco, Chicago, and Washington have also seen promising trends. These cities have seen the most consistent success with total and pedestrian fatal collision rates, while bicycle fatal collision rates have been more variable. These successes set an optimistic tone, suggesting that a realization of Vision Zero in the U.S. may be possible with the correct approach. Future research might look at these cities in more depth to better understand these successes.
Unfortunately, many early-pledge U.S. cities are moving in the wrong direction, with nine of the 18 cities having statistically significant increases in total, pedestrian, and/or bicycle fatal collision rates. With cities typically committing to zero traffic fatalities in 5–15 years, these trends must be reversed quickly if the commitments are to be realized.
In terms of a possible lag in Vision Zero results, Fremont, Philadelphia, Richmond, and Washington saw statistically significant delayed downturns in fatality rates. While several downturns have been identified and are promising, future analysis will be needed to determine whether these are results of Vision Zero strategies taking effect or whether they are simply following wider trends.
Which city characteristics and strategies are related to successful outcomes? Results suggest that non-driving modes play an important role in Vision Zero success. Cities with higher walking and transit (and biking to a lesser extent) commute mode share had strong and significantly better outcomes, while cities with high levels of SOV commuting experienced significantly worse outcomes. Similarly, cities that focused on pedestrians and bicyclists in their action plans saw lower fatality rates. Higher population densities, which are correlated with more walking, biking, and transit use (Clark, Chatterjee, and Melia Citation2016; Rickwood and Glazebrook Citation2009), also experienced improved safety performances.
These modal findings align with past Vision Zero research that identified automobile dependency as an important barrier to U.S. Vision Zero success (Ahangari, Atkinson-Palombo, and Garrick Citation2017) and past research showing that cities with high levels of non-driving modes experience better safety outcomes (Kenworthy and Laube Citation2001; Litman Citation2015; Marshall and Ferenchak Citation2019). While many action plans have focused on enforcement and education, these strategies are typically aimed at driving enforcement and driving education. Such strategies attempt to improve the safety of driving – an inherently unsafe mode. Cities may be wise to supplement this focus by also encouraging more residents to use modes of transportation that are inherently safe to begin with (i.e. walking, biking, and transit) and by working to improve the safety of vulnerable users.
Technology was also found to be related to lowered fatality rates. More research is needed to understand which technologies are being implemented and which have been successful, but an analysis of action plans shows a strong focus on three technologies in particular. Many cities have detailed plans to use cameras for automated enforcement of speeding and other dangerous driving behaviors. This aligns well with past Vision Zero research that found a positive correlation between vehicle speed reductions and collision and injury improvements in New York City (Mammen, Shim, and Weber Citation2020). Data collection technologies are also mentioned frequently in action plans. With improved data collection, cities may be able to more efficiently target funds to areas of need. Emerging technologies such as connected and autonomous vehicles are also frequently endorsed in action plans. While it is unclear whether such emerging technologies have yet had an impact on transportation safety within the study cities, leveraging this technology is an exciting opportunity that should be further explored.
A limitation of the current work lies in the fact that action plans and actions often differ. Furthermore, cities pursuing the same overarching strategy may employ different tactics. The findings identify a clear need for more research that investigates how closely cities are following their action plans, where resources are being used, and exactly which countermeasures are being implemented. While understanding effective strategies is an important first step addressed by this paper, the next logical step is to explore the effectiveness of varying tactics.
It is possible that the traffic safety trends illuminated in this paper are a result of other changes to these cities that are independent of their Vision Zero efforts, as the longstanding trends identified in Temporal trends Section suggest. Factors that may impact traffic safety outcomes outside of Vision Zero efforts include changes to vehicle safety, more variability in traffic streams with the advent of e-scooters and e-bikes, and aging populations. Accounting for these factors in future research would help us understand the effectiveness of Vision Zero efforts. However, as with the exposure discussion, the Vision Zero commitment was made regardless of these factors. More fine-grained analysis of individual cities may help illuminate what role Vision Zero efforts are playing versus background trends.
Future research may examine severe injuries, the elimination of which is another important goal of Vision Zero. Efforts may have varied success across the injury severity spectrum, and higher sample sizes may allow for more elucidation of strategy effectiveness. Future research may also employ spatial analysis to identify spatial patterns such as collision clustering or the relationship between safety outcomes and network configuration or land use. Finally, European policies and strategies may provide guidance for future studies that explore how Vision Zero successes in Europe may be translated to the U.S. given varying travel behavior and urban form.
Traffic safety is a pressing U.S. public health issue. Vision Zero is bringing this issue well-deserved attention in dozens of cities across the country. However, the best way to accomplish Vision Zero is still unclear. By identifying successful cities and the importance of non-driving modes and technology, this research begins to illuminate that path.
Disclosure statement
No potential conflict of interest was reported by the author(s).
Additional information
Funding
References
- Ahangari, H., C. Atkinson-Palombo, and N. W. Garrick. 2016. “Progress Towards Zero, an International Comparison: Improvements in Traffic Fatality from 1990 to 2010 for Different Age Groups in the USA and 15 of Its Peers.” Journal of Safety Research 57: 61–70. doi:10.1016/j.jsr.2016.03.006.
- Ahangari, H., C. Atkinson-Palombo, and N. W. Garrick. 2017. “Automobile-dependency as Barrier to Vision Zero, Evidence from the States in the USA.” Accident Analysis & Prevention 107: 75–85. doi:10.1016/j.aap.2017.07.012.
- Barone, V. 2019. “Vision Zero Failing as New Yorkers Turn to Cars over Mass Transit.” AM New York.
- Bosselman, A. 2019. “Traffic Violence Report: 482 Crashes Seriously Injured 5 Last Week.” Streetsblog Denver.
- Burbidge, S., and K. Goulias. 2009. “Active Travel Behavior.” Transportation Letters: The International Journal of Transportation Research 1 (2): 147–167. doi:10.3328/TL.2009.01.02.147-167.
- Chicago Department of Transportation (CDOT). 2012. Chicago Forward. Chicago, IL, USA.
- City and County of Denver. 2017. Denver Vision Zero Action Plan. Denver, CO, USA.
- City of Anchorage. 2018. Vision Zero Anchorage Safer Streets for Everyone. Anchorage, AK, USA.
- City of Austin. 2016. 2016-2018 Action Plan: Vision Zero. Austin, TX, USA.
- City of Boston Transportation Department. 2016. Vision Zero Boston Action Plan. Boston, MA, USA.
- City of Chicago. 2017. Chicago’s Initiative to Eliminate Traffic Fatalities and Serious Injuries by 2026 Action Plan 2017-2019. Chicago, IL, USA.
- City of Fort Lauderdale Transportation and Mobility Department. 2018. Zeroing in 2022: Vision Zero Fort Lauderdale Five-Year Action Plan. Fort Lauderdale, FL, USA.
- City of Fremont. 2016. “Fremont Vision Zero 2020: Status Report and Action Plan.”
- City of Los Angeles. 2017. Vision Zero Los Angeles 2015-2025: Action Plan. Los Angeles, CA, USA.
- City of New York. 2014. Vision Zero Action Plan. New York City, NY, USA.
- City of Philadelphia. 2017. Vision Zero Three-Year Action Plan. Philadelphia, PA, USA.
- City of Portland. 2016. Vision Zero Action Plan: Saving Lives with Safe Streets. Portland, OR, USA.
- City of San Antonio. 2016. Vision Zero San Antonio: Overview Booklet. San Antonio, TX, USA.
- City of San Diego. “Vision Zero: Strategic Plan.” Accessed August 1, 2019 https://www.sandiego.gov/vision-zero/strategic-plan
- City of San Jose. 2020. Vision Zero San Jose: Action Plan. San Jose, CA, USA.
- City of Seattle. 2015. Vision Zero: Seattle’s Plan to End Traffic Deaths and Serious Injuries by 2030. Seattle, WA, USA.
- Clark, B., K. Chatterjee, and S. Melia. 2016. “Changes to Commute Mode: The Role of Life Events, Spatial Context and Environmental Attitude.” Transportation Research Part A: Policy and Practice 89: 89–105.
- Cushing, M., J. Hooshmand, B. Pomares, and G. Hotz. 2016. “Vision Zero in the United States versus Sweden: Infrastructure Improvement for Cycling Safety.” American Journal of Public Health 106 (12): 2178–2180. doi:10.2105/AJPH.2016.303466.
- Danaf, M., A. Sabri, M. Abou-Zeid, and I. Kaysi. 2020. “Pedestrian–vehicular Interactions in a Mixed Street Environment.” Transportation Letters: The International Journal of Transportation Research 12 (2): 87–99. doi:10.1080/19427867.2018.1525821.
- Evenson, K. R., S. LaJeunesse, and S. Heiny. 2018. “Awareness of Vision Zero among United States’ Road Safety Professionals.” Injury Epidemiology 5 (1): 21. doi:10.1186/s40621-018-0151-1.
- Examiner Staff. 2014. SF Takes Step Forward in Education for Pedestrians, Cyclists and Drivers. San Francisco Examiner. San Francisco, CA, USA.
- Ferenchak, N. N., and M. G. Abadi. 2021. “Nighttime Pedestrian Fatalities: A Comprehensive Examination of Infrastructure, User, Vehicle, and Situational Factors.” Journal of Safety Research 79: 14–25. doi:10.1016/j.jsr.2021.07.002.
- Flegenheimer, M. 2014. “De Blasio Outlines Steps to Eliminate Traffic Deaths.” The New York Times.
- Fleisher, A., M. Wier, and M. Hunter. 2016. “A Vision for Transportation Safety: Framework for Identifying Best Practice Strategies to Advance Vision Zero.” Transportation Research Record: Journal of the Transportation Research Board 2582 (1): 72–86. doi:10.3141/2582-09.
- Government of the District of Columbia. 2015. A Plan of Action: Vision Zero Safe Streets for. Washington DC, USA.
- Hou, Y., P. Edara, and C. Sun. 2013. “Speed Limit Effectiveness in short-term Rural Interstate Work Zones.” Transportation Letters: The International Journal of Transportation Research 5: 8–14. doi:10.1179//1942786712Z.0000000002.
- Kenworthy, J., and F. Laube. 2001. The Millennium Cities Database for Sustainable Transport. Database. Brussels, Belgium.
- Kim, E., P. Muennig, and Z. Rosen. 2017. “Vision Zero: A Toolkit for Road Safety in the Modern Era.” Injury Epidemiology 4 (1): 1. doi:10.1186/s40621-016-0098-z.
- Kim, K. S., M. H. Myeong, and Y. J. Kweon. 2011. “Differences in Traffic Violations and at-fault Crashes between License Suspension and Revocation.” Accident Analysis & Prevention 43 (3): 755–761. doi:10.1016/j.aap.2010.10.022.
- Lee, S. H., Y. D. Lee, and M. Do. 2016. “Analysis on Safety Impact of Red Light Cameras Using the Empirical Bayesian Approach.” Transportation Letters: The International Journal of Transportation Research 8 (5): 241–249. doi:10.1080/19427867.2015.1121009.
- Litman, T. 2015. Evaluating Public Transit Benefits and Costs. Victoria, BC, Canada: Victoria Transport Policy Institute.
- Mammen, K., H. S. Shim, and B. S. Weber. 2020. “Vision Zero: Speed Limit Reduction and Traffic Injury Prevention in New York City.” Eastern Economic Journal 46: 282–300. doi:10.1057/s41302-019-00160-5.
- Marshall, W. E., and N. N. Ferenchak. 2017. “Assessing Equity and urban/rural Road Safety Disparities in the US.” Journal of Urbanism: International Research on Placemaking and Urban Sustainability 10 (4): 422–441.
- Marshall, W. E., and N. N. Ferenchak. 2019. “Why Cities with High Bicycling Rates are Safer for All Road Users.” Journal of Transport & Health 13: 100539. doi:10.1016/j.jth.2019.03.004.
- Nadimi, N., A. M. Amiri, and A. Sadri. 2021. “Introducing Novel statistical-based Method of Screening and Combining Currently well-known Surrogate Safety Measures.” Transportation Letters: The International Journal of Transportation Research. doi:10.1080/19427867.2021.1874184.
- Nadimi, N., D. R. Ragland, and A. M. Amiri. 2020. “An Evaluation of time-to-collision as a Surrogate Safety Measure and a Proposal of a New Method for Its Application in Safety Analysis.” Transportation Letters: The International Journal of Transportation Research 12 (7): 491–500. doi:10.1080/19427867.2019.1650430.
- Naumann, R. B., S. Heiny, K. R. Evenson, S. LaJeunesse, J. F. Cooper, S. Doggett, and S. W. Marshall. 2019. “Organizational Networks in Road Safety: Case Studies of US Vision Zero Cities.” Traffic Injury Prevention 20 (4): 378–385. doi:10.1080/15389588.2019.1587752.
- Naznin, F., G. Currie, D. Logan, and M. Sarvi. 2016. “Safety Impacts of Platform Tram Stops on Pedestrians in Mixed Traffic Operation: A Comparison Group before–after Crash Study.” Accident Analysis & Prevention 86: 1–8. doi:10.1016/j.aap.2015.10.007.
- Nelson, L. J. 2019. “More People are Dying on L.A.’s Streets despite a Push to Eliminate Traffic Fatalities.” Los Angeles Times.
- OECD/ITF. 2016. “Road Safety Annual Report 2016.” OECD Publishing, Paris.
- Retting, R. 2019. Pedestrian Traffic Fatalities by State: 2018 Preliminary Data. Governors Highway Safety Association. Washington, DC, USA.
- Richmond Virginia Department of Public Works. 2017. Vision Zero Richmond, Virginia Safer Roads for All Modes. Richmond, VA, USA.
- Rickwood, P., and G. Glazebrook. 2009. “Urban Structure and Commuting in Australian Cities.” Urban Policy and Research 27 (2): 171–188. doi:10.1080/08111140802433378.
- Rundmo, T., and H. Iversen. 2004. “Risk Perception and Driving Behaviour among Adolescents in Two Norwegian Counties before and after a Traffic Safety Campaign.” Safety Science 42 (1): 1–21. doi:10.1016/S0925-7535(02)00047-4.
- Schmitt, A. 2019. Are We Starting to See Progress toward Vision Zero? Streetsblog USA. Streetsblog USA.
- Short, A. 2020. Vision Zero! Norwegian Capital Completely Quashes Road Deaths. Streetsblog USA. Streetsblog USA.
- Swan, R. 2019. Traffic Fatalities Soaring despite Effort to Make City Streets Safer. San Francisco Chronicle. San Francisco, CA, USA.
- Vision Zero, S. F. 2019. Vision Zero Action Strategy: Eliminating Traffic Deaths in San Francisco. San Francisco, CA, USA.
- Vision Zero Network. 2017. Vision, Strategies, Action: Guidelines for an Effective Vision Zero Action Plan. Oakland, CA, USA.
- World Health Organization. 2019. Global Health Observatory Data Repository. Geneva: World Health Organization.