
 ?Mathematical formulae have been encoded as MathML and are displayed in this HTML version using MathJax in order to improve their display. Uncheck the box to turn MathJax off. This feature requires Javascript. Click on a formula to zoom.
ABSTRACT
As a result of rapid urbanization and climate change, many large- and medium-sized cities in China frequently undergo urban disasters with severe impacts that result in many casualties, induce significant economic losses, and restrict sustainable social and economic development. Providing timely and accurate early warnings is the most effective measure for disaster prevention and mitigation before such disasters can impose severe impacts. In this study, we propose a dynamic impact assessment method for rainstorm waterlogging using land-use data. First, based on a detailed collection of disaster prevention and mitigation data, we construct an impact assessment index based on the assessment objects of this study. Then, a waterlogging simulation is performed, and the simulation results are found to meet the assessment requirements. Finally, we conduct an impact assessment every half hour during a heavy rainfall event and evaluate the performance of the proposed method by assessing the socioeconomic impact, object impact, industry impact, regional impact, and comprehensive impact of the event. These assessments produce valuable information for providing diverse and timely services in the event of urban waterlogging.
1. Introduction
Rainstorm waterlogging in urban and rural regions constitutes one of the most destructive types of disasters that occur during summer in China, as these events affect the growth and yield of crops and vegetation, cause the inundation of houses and the destruction of automobiles, and impact traffic, transportation services, automobile insurance policies, pedestrian safety, microorganism proliferation, livestock and poultry breeding, and aquaculture operations (Kahlown and Azam Citation2002; Malik et al. Citation2002; Mowla and Islam Citation2013; Mukherjee Citation2014; Su et al. Citation2016). Severe waterlogging events, e.g. the disasters that occurred on 13 June 2008, in Shenzhen, China, and on 21 July 2012, in Beijing, China, have led to considerable casualties and property losses. The heavy rainstorm that occurred in Shenzhen on 13 June 2008, caused a total of 6 deaths, large-scale flooding of communities and factories, and the shutdown of nearly 10,000 enterprises; additionally, the lives of residents and public order were severely affected. The torrential rainstorm that occurred in Beijing on 21 July 2012, caused a total of 79 deaths, resulting in the collapse of 10,660 houses, damaged 163 unmoveable cultural relics, affected 1.602 million people, and caused 11.64 billion yuan in economic losses in addition to traffic congestion and road disruptions. The Ministry of Housing and Urban-Rural Development of the People’s Republic of China conducted a survey of 351 cities in China in 2010 and showed that 62% of those cities had experienced waterlogging between 2008 and 2010; approximately 137 cities had experienced waterlogging more than 3 times between 2008 and 2010; and nearly 58 cities had suffered from waterlogging lasting more than 12 hours in a single precipitation event between 2008 and 2010 (Liang Citation2016). Unfortunately, due to the rapid development of urbanization and climate change, the frequency of waterlogging has increased, and the impacts of waterlogging have become increasingly extensive (Shi Citation2012; Quan Citation2014). Accordingly, rapid urbanization, the development of impervious surfaces and population growth are mainly responsible for the extensive rainstorm waterlogging experienced throughout China (Yin et al. Citation2015; Zhang et al. Citation2012a).
Previous studies (Beven and Kirkby Citation1979; Huber et al. Citation1988; Campbell and Sullivan Citation2002; Singh and Woolhiser Citation2002; Flood Citation2011) have generated approximately 40 models for simulating rainstorm waterlogging. The main waterlogging simulation models include the Storm Water Management Model (SWMM), the Hydrologic Engineering Centre-Hydrologic Modelling System (HEC-HMS), the Soil and Water Assessment Tool (SWAT), the MIKE FLOOD toolbox (MIKE Urban, MIKE 21 and MIKE 11), the Precipitation Water Routing and Inundation (PWRI) model, and the topography-based hydrological model known as TOPMODEL (Beven and Kirkby Citation1979; Huber et al. Citation1988; Campbell and Sullivan Citation2002; Singh and Woolhiser Citation2002; Flood Citation2011). Djordjević et al. (Citation1999, Citation2005)) first described the Simulation of Interaction between Pipe flow and Surface Overland flow in Networks (SIPSON) model, which considers both pipe flow and surface flow as dual drainage mechanisms. Subsequently, many studies have considered dual drainage when using the SWMM, SIPSON and the U.S. Environmental Protection Agency (EPA) SWMM version 5 (EPA-SWMM5) to simulate pipe flow and surface flow to investigate urban waterlogging (Djordjević et al. Citation1999, Citation2005; Hsu et al. Citation2000, Citation2011; Nanía et al. Citation2014). As an alternative approach, the Soil Conservation Service (SCS) model is characterized by a simple calculation scheme and requires only a few parameters to simulate waterlogging. Accordingly, in this study, we mainly consider the effects of precipitation, soil type, land use, topography, buildings, and drainage and use the SCS flow model and the convergence model to dynamically simulate both the water depth and the inundation area during waterlogging.
Most existing meteorological disaster impact assessment studies have focused on assessing the impacts of agrometeorological and hydrological disasters, and this research has mainly concentrated on the planting of corn, rice, and sugar cane. The disasters investigated include those involving drought, tropical cyclones, frost, high-temperature heat damage, and continuous rainfall. Traditional disaster impact assessment methods include disaster collection and empirical estimation techniques. However, although these approaches are simple and widely applicable, they cannot be used for preassessment or real-time evaluation, and they are highly subjective. As an alternative, Haq et al. (Citation2012) used remote sensing and geographic information systems (GIS) technology to conduct monitoring and loss assessment during flooding in Pakistan, thereby improving the management of flood disasters and the efficiency of the disaster response. Similarly, Fernández and Lutz (Citation2010) used GIS technology to model and analyse flood paths and sensitive areas where the drainage system capacity was exceeded in urban areas throughout Argentina. In this study, based on the establishment of subindustry disaster impact assessment indicators, we propose a new method of assessing the dynamic impacts on subobjects, subsectors, and subregions with the ultimate aim of providing timely information for disaster warming and prevention.
2. Data and methods
2.1. Data
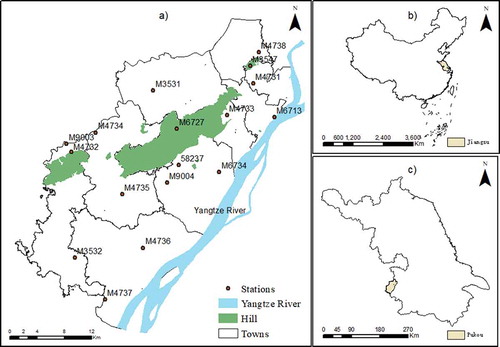
In this study, we employ various data to dynamically assess the impacts of waterlogging. The first type of data is basic GIS data, including administrative boundaries (at the district, town and village levels), digital elevation model (DEM) data with a 100-metre resolution, reservoirs, lakes, rivers (at three levels), roads (at three levels), vegetation, buildings, land-use data, and drainage pipe networks. The river, lake, reservoir and building data were obtained by digitization using Google high-resolution satellite imagery and field surveys. Urban roads in China are currently in a stage of rapid development. Similarly, the drainage networks of cities change quickly; thus, it is difficult to obtain timely and accurate data; as a result, the data on drainage networks used in this study were obtained from generalized building and road distributions constructed by setting the buildings and roads to the same value instead of the real drainage speeds. The second type of data is meteorological data, including daily precipitation data from Pukou National Station from 1980 to 2015 and minute-level precipitation data from regional stations (all data since the stations were built). The geographical locations of Pukou’s regional stations and the Pukou National Station are shown in . The meteorological data were sourced from the Pukou Meteorological Bureau. The third type of data comprises disaster records and disaster prevention and mitigation data. The disaster records include the occurrence times of waterlogging events and their resulting casualties, crop losses, and property losses, while the disaster prevention and mitigation data mainly include information on potential hazards and hidden danger areas, storage areas for disaster prevention materials, and disaster prevention shelters. The information on the storage areas for disaster prevention materials includes the material storage locations, the inventory of disaster prevention materials, and contact information, and the information on the disaster prevention shelters includes the locations of shelters (such as schools, churches, and hospitals), their capacities, and contact information. In addition, we utilize national standards, local standards, and various network resources in this study.
Figure 1. Map of the geography and locations of the meteorological stations in Pukou District, China.
Source: Pukou Meteorological Bureau and Nanjing Land and Resources Bureau, 2015.
2.2. Methods
2.2.1. Spatialization of the population and economic data
The smallest unit of demographic and economic data in China’s county-level statistical yearbook is the town. However, these population and economic data are not suitable for use in refined assessments and require spatial data processing for this purpose. Existing methods of population spatialization include remote sensing interpretation methods (Bai Citation2004; Langford and Harvey Citation2001; Haq et al. Citation2012) and fitting methods based on night-time light data from the Defence Meteorological Satellite Program (DMSP)-Operational Linescan System (OLS) (Fernández and Lutz Citation2010; Su et al. Citation2016). For the spatialization of GDP economic data, multivariate correlation simulations can be used to obtain spatialized GDP data based on remote sensing (Liu et al. Citation2005). However, the spatial resolution of the current population and GDP spatialization results is 1 km, which also does not meet the needs of this study. Therefore, we needed to produce higher-resolution (100-m) population and GDP spatialization results. In the spatialization method used in this study, a multiple regression relationship was established between the land-use areas and population data, which was then used to spread the population evenly throughout the grid. The detailed population calculation steps were as follows. First, the land-use data not related to population, e.g. the data related to the rivers, lakes, and reservoirs, were removed. Then, a regression analysis was conducted on the population data and the various types of land-use areas for each township, and the land-use types exhibiting the highest correlations with the population data, such as built-up land, villages, and towns, were selected. Then, we generated a 100-m grid and counted the types and areas of land use in each grid cell. Finally, we calculated the population of each grid cell based on the regression relationship. According to the composition of the agricultural population and nonagricultural population in each town, the towns were divided into urban towns and rural towns. The urban towns are Jiangpu, Taishan, Qiaolin, Yanjiang, Dingshan and Laoshan, and the others are rural towns. The urban population spatialization model is as follows:
where is the simulated urban population (unit: person), m is the number of subtowns, and
,
,
and
are the areas (unit: km2) of the roads, cities, towns, and villages, respectively, in the i-th subtown. The model fit passes the significance test with an R-squared value of 0.96.
The rural population spatialization model is as follows:
where is the simulated rural population (unit: person) and
,
,
and
are the areas (unit: km2) of the designated towns, villages, cultivated land, and other land types, respectively, in the i-th subtown. The model fit passes the significance test with an R-squared value of 0.98.
The economic spatialization method adopted in this study was similar to the population spatialization method. The GDP was spatialized according to the distributions of the primary industry, secondary industry, and tertiary industry, and then a grid was superposed to calculate the GDP spatialization data.
2.2.2. Simulation of waterlogging
A waterlogging simulation mainly includes a surface runoff simulation and a confluence process simulation. In this study, we adopted the SCS model modified by other researchers (Mishra and Singh Citation2002, Citation2003; Aronica and Candela Citation2007; Geetha et al. Citation2008; Singh et al. Citation2008) for the runoff calculation. The SCS model has the advantages of a simple structure, relatively few parameters, and a low dependence on observation data. This model can be used to objectively simulate surface runoff for various land-use patterns, soil types, soil moisture contents, and precipitation conditions. The revised SCS model is as follows:
where is the precipitation (unit: mm),
is the potential infiltration before rainfall (unit: mm/h), and
is the runoff (unit: m3/s). In this study, the precipitation data used as input consist of historical data from automated weather stations, which can include quantitative precipitation forecast (QPF) products. These products provide precipitation estimates for the next 30 minutes, 1 hour, 2 hours, 3 hours, and 6 hours (Misumi et al. Citation2015).
is calculated via the following equation:
where is the runoff curve coefficient (dimensionless).
is used to determine how much rainfall has penetrated into the soil or how much of the content of an aquifer has been converted into surface runoff. Therefore,
is related to the land-use type, soil infiltration characteristics (e.g. soil type), and early soil wetting conditions. The method of calculating CN is divided into two main steps. First, on the basis of a hydrological soil type reference table (Shen Citation1989), the soil type and the infiltration rate in the study area are determined. Second, the soil moisture conditions are divided into three classes according to the conditions five days before the rainfall event: dry, normal, and moist. We comprehensively considered the land-use type, the hydrological conditions, and the proportion of impervious area in Pukou and referred to documents from previous research (Quan Citation2014; Xu and Pan Citation2006; Luo and Song Citation2011) to obtain the normal state of the CN matrix.
Furthermore, we improved the grid flood method proposed by Bai (Citation2004) and utilized it for the confluence process simulation. The detailed calculation steps are as follows.
Sort the grid cell heights from the largest to the smallest starting from the grid cells with the highest values, and then select the grid cell to be used as the inlet for the simulation.
Compare the elevations of the 8 neighbouring grid cells around the inlet grid cell and select the grid cell with the lowest elevation to determine the direction of water inflow. The flow velocity in the x direction is U, and the velocity in the y direction is
(unit: m/s). To simplify the calculation, take
where is the hydraulic radius of the cross section (unit: m), which is approximately equal to the depth H of the grid cell; J is the hydraulic slope of the stream (unit: degrees);
is the grid cell size (unit: m);
is the difference in elevation between the inlet grid cell and the inflow grid cell (unit: m); and
is the integrated roughness of the grid cells acting on the water flow.
(3) Calculate the water depth impacted by buildings using the following equation:
where is the water depth impacted by buildings (unit: m3/s), which represents the amount of water that would be located in areas occupied by the buildings, which is instead displaced onto the roads and squares;
is the water depth not affected by buildings (unit: m3/s);
is the building density; and
represents all open the spaces and roads (i.e. excluding the buildings). Since there is no runoff depth at the location of a building, all rainfall runoff in the area can be considered to be concentrated in the unbuilt area.
(4) Calculate the water depth at the current time as follows:
where is the water depth (unit: mm). The inputs, which increase the water depth, include
and
:
is the runoff depth from rainfall (unit: mm), corresponding to the difference in runoff between two consecutive times, and
, as shown in Equation 9, is the water displaced by buildings into unbuilt areas (unit: mm). The outputs, which decrease the water depth, include
and
:
is the runoff difference between the inflow and outflow depths (unit: mm), and
corresponds to the drainage speed (which is 16 mm/h) of the pipe network and represents the water that is sent to the pipe network (unit: mm).
(5) Calculate the change in the water depth with time. Equation 7 is the water balance equation, and Equation 8 is the water storage equation.
where is called the stagnant area;
represents the initial flow plus the final flow (unit: m3/s) into the stagnant zone in period
, where the initial flow is the runoff and the final flow is the remaining flow after the outflow from the grid cell;
is the water depth (unit: m); and
is the time step (unit: minute), which is calculated by dividing the grid cell size by the average flow rate. The value of
in our simulation is 15 minutes.
(6) Calculate the water depth on a cell-by-cell basis in the order determined in step (1). In Equation 10, is the water depth at the current time.
In the next period, the initial flow value of each grid cell is the surface water depth in the previous period plus the runoff at the current time.
The SCS model parameters and the convergence model parameters were adjusted based on the land-use data. To correct for any bias in the data obtained through investigation, the reliability of the simulation was verified by a comparative analysis between the locations of the waterlogging points or areas and their corresponding waterlogging depth classes.
2.2.3. Formulation of the assessment indicators
The formulation of assessment indicators is a very tedious process. It is necessary to consult a large number of documents, standards, and questionnaires and make relevant adjustments based on the actual regional conditions. For example, consider the process of formulating the indicators for transportation. Waterlogging affects the areas in which commuters can walk and drive. The impact on the ability to drive a car is the most important. By looking up relevant data on the wading ability of a car, several automobile wading parameters can be found as follows. The water level is safe when the water depth is less than half the tire height. The height of the exhaust pipe is also essential; if the exhaust resistance is too high, this will cause the car to shut off as it moves through the water. Additionally, the height of the air intake is important; once the air inlet begins to take in water, the engine will be detrimentally affected. The wading standards for small-size vehicles represent the minimum standards for the transportation industry because the values for buses and trucks are higher than those for small-size vehicles. For example, consider the Peugeot 408: the tire half-height is 32 cm, the exhaust pipe height is 30 cm, and the air intake height is 86 cm. Similarly, consider MG 6: the tire half-height is 30 cm, the exhaust pipe height is 32 cm, and the air intake height is 71 cm. If the water depth reaches the depth of the air inlet, wading becomes more dangerous, and it is more likely that the car will shut off. In the same way, we reviewed data on the Volkswagen Golf 6, Tianyu SX4, Jianghuai Yuet, Toyota Corolla, and Modern Yuet. In addition, the relevant parameters for medium-sized vehicles, including the Buick Regal, Ford Mondeo, Citroen C5, and Nissan Teana, were investigated. For example, consider the Audi A4L: the tire half-height is 32 cm, the exhaust pipe height is 30 cm, and the air intake height is 73 cm. Additionally, we considered the Kia K5: the tire half-height is 32 cm, the exhaust pipe height is 26 cm, and the air intake height is 80.5 cm. Moreover, we also needed to consider the impact of waterlogging on pedestrians’ ability to walk. Accordingly, we formulated assessment indicators for the impact of waterlogging on transportation. Using methods similar to those used by the transportation industry to formulate such indicators (see the relevant academic papers, national standards, and web resources), as shown in , we also formulated assessment indicators for facility agriculture, flower seedling cultivation, accommodations and catering, aquaculture, livestock and poultry, manufacturing services, and construction.
Table 1. Hierarchical index table of the impacts of rainstorm waterlogging disasters on different industries.
3. Results
3.1. Validation of the waterlogging simulation
To verify the reliability of the waterlogging simulation, we used actual rainfall data to simulate waterlogging and verify the correctness of the positions and depths of waterlogging points. One of the difficulties in waterlogging research is the lack of disaster observation data. In recent years, several large-scale waterlogging investigations have been carried out in the main urban areas of Nanjing. The investigation covered the six major city districts: Gulou District, Jianye District, Qinhuai District, Xuanwu District, Qixia District, and Yuhuatai District. The data are highly detailed and include the approximate locations of waterlogging points (areas), the influences of waterlogging, and other factors. For the simulation in this study, we investigated an extensive rainfall event that occurred from 9:00 to 21:00 on 1 August 2008.
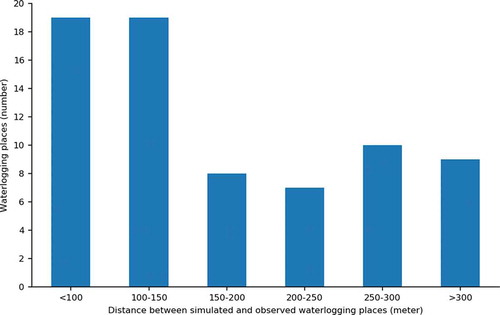
Because the minimum water depth among the 72 actual waterlogging points recorded was 50 mm, we needed to count the number of points or areas with a water depth greater than 50 mm. shows that the number of sites with a water depth estimation error less than 100 m and between 100 m and 150 m is 19 (26%), and the numbers of sites with water depth estimation error ranges of 150–200 m, 200–250 m, 250–300 m and more than 300 m are almost the same: 8, 7, 8, and 6 (accounting for 11%, 10%, 11% and 8%, respectively). The disaster data were collected using a community- or road-based procedure, and the statistical unit is usually within 250 m. Therefore, in this study, a simulation point or area must be less than 250 m from the actual point or area to which it corresponds for the simulation point or area to be considered correct. shows that the number of simulation points with an error of less than 250 m is 53, while the total number of verification points is 72; thus, the accuracy of this simulation is calculated to be 74%. Most previous studies (Cavazza and Pisa Citation1988; Vretare et al. Citation2001; Yin et al. Citation2015) have been verified with respect to the maximum water depth. The main reason for taking this approach is that disaster data are usually collected only from locations where disasters occur, such as a road or the intersection of two roads. In the past, in verifications based on the maximum water depth, the error has been controlled within 15%. In contrast, this study considers verification based on the location of occurrence; the corresponding verification accuracy is approximately 74%, indicating that approximately three-quarters of the points can be simulated correctly. We consider this an acceptable model result, meaning that the simulation is sufficiently accurate to assess the impacts of waterlogging.
Figure 2. Error distribution of the waterlogging points during the rainstorm on 1 August 2008, in the urban area of Nanjing, China.
Source: Pukou Meteorological Bureau, 2015.
A water depth simulation was performed using actual water level data. The grade of the water depth was determined by the influence of the water depth on pedestrian and commuter activities. The classification system is shown in . When the water depth is less than 5 cm, there is no impact on residents’ lives, and the impact level of the water depth is 0. When the water depth is between 5 and 15 cm, it affects residents’ ability to walk and go outside, and the impact level of the water depth is 1. When the depth of accumulated water is between 15 and 30 cm, urban traffic is seriously affected, and the impact level of the water depth is 2. When the water depth is between 30 and 60 cm, waterlogging seriously affects the daily lives of residents and causes economic losses, and the impact level of the accumulated water depth is 3. When the water depth is greater than 60 cm, the urban area will experience major waterlogging disasters that will result in severe economic losses and casualties, and the impact level of the water depth is 4. The details of the classification method and sources are shown in .
We classified the simulation results as shown in and the Appendix. We found that 51 simulation points had a simulated water level that was the same as the actual level, 4 points had a simulated level greater than the actual level, and 17 points had a simulated level lower than the actual level. Thus, the simulated and actual water levels were the same for 71% of the simulation points, meaning that the total simulation accuracy was 71%, slightly lower than the accuracy estimated in the verification. This discrepancy in the simulation accuracy arises because the comparison is affected by 2 sources of error. One is the error of the simulation algorithm itself, and the other is the possibility that the disaster data (which indicate impact in terms of low, medium, high or very high risk) may have been recorded with errors when they were collected. The same methodology was used to simulate the two heavy rainfall events on 7 July 2009, and 12 July 2010, in Nanjing, and the resulting simulation accuracy was again approximately 70%. Therefore, the model results of the waterlogging simulation are considered to be acceptable.
3.2. Dynamic assessment results
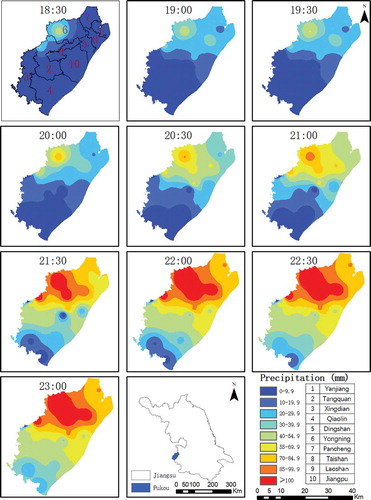
We selected Pukou District, for which detailed disaster prevention and mitigation data are available, to demonstrate the results of the proposed assessment method. The considered precipitation event consisted of precipitation from 17:40 to 22:50 on 28 September 2014. shows the cumulative change in precipitation every half hour at the weather station, illustrating the changes in precipitation intensity. The two periods from 20:00 to 20:30 and from 21:00 to 22:00 were heavy precipitation periods. From 20:00 to 20:30, the M6727 and 58237 stations had the highest precipitation intensities; from 21:00 to 22:00, the M6734, M4738, M4735, M4733, M6727 and M4734 stations had the highest precipitation intensities. shows the spatial distributions of the accumulated precipitation at different times during the event, showing that the precipitation started in Yongning () and then developed to span the entire northern region. The precipitation was concentrated in the central and northern parts of Pukou District. The Laoshan Forest Farm, Yongning, Dingshan, Jiangpu and Yanjiang areas accumulated larger amounts of precipitation.
Figure 3. Accumulated precipitation (mm) in 30-minute intervals from 18:00 to 23:00 on 28 September 2014, at different stations in Pukou District, China.
Source: Pukou Meteorological Bureau, 2015.
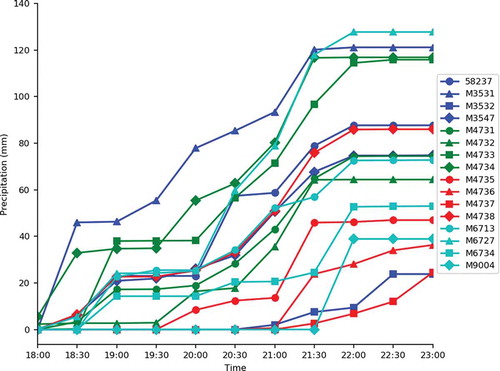
Figure 4. Resulting map of the interpolated precipitation from 18:30 to 23:00 on 28 September 2014, in Pukou District, China.
Source: Pukou Meteorological Bureau and Nanjing Land and Resources Bureau, 2015.
The dynamic waterlogging impacts assessed in this study are diverse, including the dynamic impacts of waterlogging on the population and economy, individual affected objects, traffic, facility agriculture, aquaculture, and individual regions as well as the comprehensive dynamic impact of waterlogging on the entire region. From the analysis of this precipitation event, we know that the two periods from 20:00 to 20:30 and from 21:00 to 20:00 were heavy precipitation periods. Therefore, for this study, we selected the precipitation at 21:30 for the dynamic impact assessment analysis.
3.2.1. Influences on the population and economy
This research uses spatialization methods to spatialize and analyse the population and economic data. The impact on different regions varies due to the differences in precipitation areas. At different levels of the disaster assessment, the population and economic volume of the area above the levels can be obtained by regional statistics. The quantitative values such as population and economic volume reflect the impact on the regional totals. By quantifying the levels of impact on the population and economy, the effects on the population and economy in different regions were obtained. and show the levels of impact on the population and economy, respectively, on each street. The sum of the population experiencing no impact and different levels of impact is equal to the total population of the area. reveals that at 21:30, the impact on the population was greatest on Taishan Street, Yongning Street and Dingshan Street. On Yongning Street, 350 persons were slightly affected, 493 persons were somewhat affected, 509 persons were moderately affected, and 52 persons were highly affected. On Dingshan Street, 161 persons were slightly affected, 56 persons were somewhat affected, 113 persons were moderately affected, and six persons were highly affected. On Taishan Street, 858 persons were slightly affected, 869 persons were somewhat affected, and 106 persons were moderately affected. On Tangquan Street, 184 persons were slightly affected, 191 persons were somewhat affected, and 41 persons were moderately affected. On Pancheng Street, 125 persons were slightly affected, 65 persons were somewhat affected, and 21 persons were moderately affected. On Yanjiang Street, 91 persons were slightly affected, 39 persons were somewhat affected, and eight persons were moderately affected. In Laoshan, only six persons were moderately affected. The population of Jiangpu Street was not affected much and mainly experienced minor impacts. Based on this assessment, alert service information should be sent to areas with moderately and highly affected people.
Table 2. Statistics of the numbers of people influenced by rainstorm waterlogging on every street at 21:30 on 28 September 2014, in Pukou District, China (unit: person).
Table 3. GDP statistics of the extent to which the economy was affected by the rainstorm waterlogging disaster on every street at 21:30 on 28 September 2014, in Pukou District, China (unit: million yuan).
shows that at 21:30, the impact on the economy was greatest on Yongning Street and Dingshan Street. quantifies the impact of waterlogging on GDP production, expressed in terms of economic volume. The streets that were greatly impacted in terms of GDP production were Dingshan Street (2 million yuan) and Yongning Street (1 million yuan). The GDP of all the streets were moderately affected, among which the most affected street was Yongning Street (554 million yuan), the least affected street was Jiangsu Street (60 thousand yuan), and the other affected streets, from the most to the least affected, were Taishan Street (205 million yuan), Dingshan Street (178 million yuan), Tangquan Street (39 million yuan) and Pancheng Street (6 million yuan). In addition, the 2110 million yuan of GDP production was affected slightly due to the impact of Yongning Street (1076 million yuan), Dingshan Street (502 million yuan), Tangquan Street (262 million yuan), Jiangpu Street (67 million yuan) and Pancheng Street (41 million yuan). Finally, Jiangpu Street was the street with the least impact on the GDP, which was as high as 5653 million yuan. Taishan Street’s GDP was slightly affected and was only approximately half of that of Jiangpu Street (2953 million yuan). The other streets impacted by waterlogging were Yongning Street (742 million yuan), Dingshan Street (671 million yuan), Tangquan Street (334 million yuan) and Pancheng Street (319 million yuan). Waterlogging had little impact on the economics of Xingdian Street and Yanjiang Street, which mainly suffered only minor impacts.
3.2.2. Influences on industries
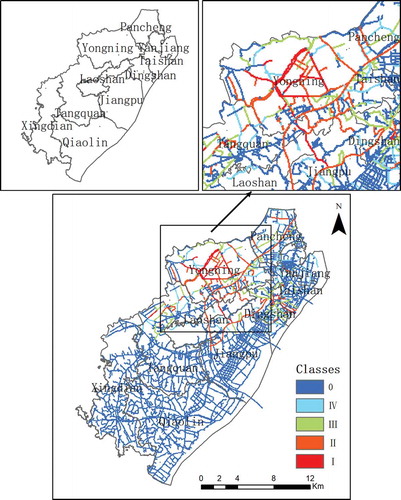
The studied precipitation event mainly affected the transportation industry, aquaculture industry, and facility agriculture industry in Pukou District. We used the simulated accumulation data, impact indicators, and basic geographic data to dynamically evaluate the impacts on these industries. We selected the impact on the transportation industry at 21:30 for assessment. The transportation industry displayed a grade IV impact, corresponding to a water depth of 15–24.9 cm, which makes travel difficult for pedestrians. When the impact level is III, normal traffic is blocked, and the impact is moderate. When the impact level is II, some vehicles cannot pass, traffic is severely obstructed, and the impact is great. When the impact level is I, the corresponding water depth is greater than 60 cm, vehicles are unable to pass, traffic becomes stagnant, and the impact is the greatest. shows the results of the assessment of the impact of rainstorms on the transportation industry at 21:30. Waterlogging mainly affected the transportation industry on Yongning Street (number 6), Tangquan Street (number 2), Pancheng Street (number 7) and Taishan Street (number 8) at a high impact level. Class 0 represents the lowest level, and Class I represents the highest level and the most influential area. The upper right panel of is an enlarged view of the local area, showing more details.
Figure 5. Resulting map of the impact assessment of rainstorm waterlogging on the traffic and transportation industry at 21:30 on 28 September 2014, in Pukou District, China. Class 0 represents the lowest level; Class I represents the highest level and the most influential area.
Source: Pukou Meteorological Bureau and Nanjing Land and Resources Bureau, 2015.
shows a graph of the average impact indices corresponding to the considered industries every half hour during the waterlogging event. Clearly, facility agriculture was most strongly influenced by waterlogging, followed by livestock and poultry, transportation, and finally aquaculture. The impact of waterlogging on the aquaculture industry was mainly due to the overflow of aquaculture ponds caused by the excessive accumulation of water. The impact of stagnant water on facility agriculture was assessed at 18:30, 21:30 and 20:00, and the impact of the entire precipitation event on facility agriculture was found to be high. The accumulation of water mainly affected the aquaculture industry from 19:30 to 20:30 and had little impact at other times. The overall impact on the transportation industry was small. According to the optimal segmentation method, the grades are assigned as follows: 0–0.15 is grade IV, 0.16–0.38 is grade III, 0.39–0.62 is grade II, and 0.63–1 is grade I. shows that the heavy precipitation had the greatest impact on facility agriculture; the corresponding impact index reached grade I, and all the facility agriculture activities were in the high impact zone. The main reason for this impact is that the precipitation was concentrated mainly over Yongning Street, Tangquan Street and Pancheng Street, which are the main industrial areas for facility agriculture. The livestock and poultry breeding industries were also affected; for these industries, the degree of impact gradually increased after 20:00, eventually reaching an overall impact of level III. The transportation industry and aquaculture industry were changed at the grade IV level, indicating a low effect. The transportation industry was slightly more affected than the aquaculture industry.
Figure 6. Line chart of the comprehensive impact assessment of rainstorm waterlogging on various industries from 18:30 to 23:00 on 28 September 2014, in Pukou District, China.
Source: Pukou Meteorological Bureau, 2015.
3.2.3. Regional and comprehensive influences
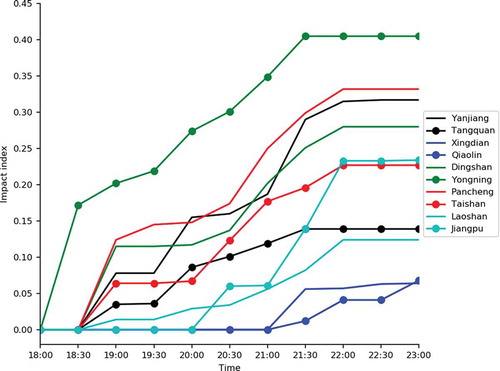
An assessment analysis of regional impacts using the regional impact formula can reveal the changes in the impact of waterlogging at the village and street levels at different times. shows the changes in the impact levels on different streets over time. According to the optimal segmentation method, the grades are assigned as follows: 0–0.15 is grade IV, 0.16–0.38 is grade III, 0.39–0.62 is grade II, and 0.63–1 is grade I. shows that Yongning Street always experienced the highest level of impact throughout the precipitation event, followed by Pancheng Street, which experienced a relatively high level of impact during the whole precipitation event, whereas Qiaolin Street and Xingdian Street experienced the smallest impacts during the precipitation event. The results of regional impact assessments are mainly used by government decision-makers to issue early warnings; note that a regional impact assessment represents the combined impacts on different industries across the region.
Figure 7. Line chart of the regional impact assessment of rainstorm waterlogging from 18:30 to 23:00 on 28 September 2014, in Pukou District, China.
Source: Pukou Meteorological Bureau, 2015.
A comprehensive impact assessment of waterlogging reflects the overall impact of precipitation on the entire region and represents the general real-time situation at a certain moment. In accordance with the full rainstorm impact assessment model, the comprehensive impact of heavy rain is dynamically calculated, and the impact level is divided into grades. The grades are assigned as follows: 0–0.15 is grade IV, 0.16–0.38 is grade III, 0.39–0.62 is grade II, and 0.63–1 is grade I. is a line chart showing the results of the comprehensive impact assessment of the rainstorm in Pukou District. This figure shows that the two moments with the greatest precipitation impacts were 18:30 and 21:30. The overall waterlogging effect reached a peak at 21:30 and gradually weakened thereafter. The entire event reached impact grade II at 18:30 and 21:30, while the other moments were impacted at levels lower than grade II, i.e. the impacts were not significant.
Figure 8. Line chart of the overall impact assessment of rainstorm waterlogging from 18:30 to 23:00 on 28 September 2014, in Pukou District, China.
Source: Pukou Meteorological Bureau, 2015.
4. Discussion
4.1. Applications to forecasting and early warning systems
With economic and societal development, higher requirements are being placed on meteorological services, and the demands for more refined services and more accurate forecasts are becoming increasingly urgent. Much work has been performed via many studies (Vasiloff et al. Citation2007; Fabry and Seed Citation2009) to improve the accuracy of QPF products, and researchers have previously applied QPF results for flood forecasting and early warning generation (Rezacova and Sokol Citation2004; Billa et al. Citation2004; Li et al. Citation2017). Based on QPF products in combination with the research method presented in this paper, we can simulate waterlogging events and assess the impacts on various industries over forecast horizons of 30 minutes, 1 hour, 2 hours, 3 hours, and 6 hours. Such waterlogging simulations and impact assessments for various industries mainly include assessments of the water depth, accumulated precipitation, industry impact, regional impact, socioeconomic impact, and comprehensive impact. On the basis of water simulation results (water accumulation area and water accumulation time) in conjunction with basic GIS data, suitable routes for search and rescue personnel and material distribution routes can be dynamically calculated. With a combination of accurate forecast data and model simulation results, the water accumulation areas and water accumulation depths can be predicted 3 hours in advance to warn people in the path of the disaster and to prevent people from entering the area of disaster occurrence. These results can enable the provision of more detailed and targeted early warnings for rescue assistance. For people in different geographical locations, different kinds of warning information can be sent to provide personalized services. The results of this study can serve as a technical reference for providing such flood warning services at a high level of refinement.
4.2. Uncertainty analysis
For the application of the research method developed in this paper to other regions, the relevant parameters will need to be properly adapted to local conditions. At present, large-scale waterlogging investigations have been carried out in many cities (Yin et al. Citation2015; Zhang et al. Citation2012b; Zhang et al. Citation2015) in China, such as Nanjing, Nanchang, and Beijing. Based on the research presented in this paper, more refined impact assessments can be developed for these areas; thus, better solutions can be found. The spatialization approaches utilized for analysing the population and economy will require remodelling based on local land-use data, population data, and economic data. Building data can be obtained from local planning departments or digitally obtained from high-resolution satellite remote sensing images collected by services such as Google, whereas the collection of disaster prevention and mitigation data will require detailed investigations. The runoff curve coefficients for surface runoff simulations must be adjusted based on local hydrological data, soil type data, and land-use data. Furthermore, on the basis of local disaster prevention and mitigation data, it will be necessary to adjust the hazard level indicators for different subsectors. Hence, there are still uncertainties in the approach presented in this article. Although the waterlogging simulation performed in this study has been verified and the verification results are good, a comparison with other urban models should be performed to confirm the selection of the best waterlogging simulation model for local conditions. In addition, many other inputs, such as the spatialized population data, building data, and runoff curve coefficients, used in this research method must be adapted to more accurately reflect the local conditions. The process of determining these factors introduces uncertainty into the assessment. The population spatialization model used in this paper treats population-related land-use types as the impact factors and counts only the total population of areas with relevant land-use types. The verification results are in agreement with the regional statistics. However, the method adopted in this study assumes that irrelevant areas are not populated, and this assumption can lead to a certain level of error. Although areas of other land-use types often have small populations, those populations cannot be neglected. In future research, we plan to incorporate satellite night-time light data to better match the population distribution to the actual distribution of people. In addition, the method presented in this study depends on a considerable amount of input data and requires careful parameterization. For data-poor regions, a large amount of data must be generalized, such as the population data of the trial area; drainage data must be calculated using a fixed drainage capacity for roads, and land-use data must be obtained using a satellite image extraction method. Hence, it is necessary to make adjustments based on local disaster prevention and mitigation data, and there are uncertainties in the proposed approach.
5. Conclusion
The occurrence of rainstorm waterlogging not only substantially inconveniences many people but also seriously threatens food security and people’s lives and property. The main conclusions of this study are as follows:
1) The collection of disaster prevention and mitigation data related to rainstorm waterlogging forms an essential basis for assessing the impacts of such disasters. This process involves many crucial tasks, including the acquisition of primary data (regarding meteorological disaster prevention, disaster prevention materials, and disaster prevention and shelter sites) and the spatialization of population and economic data.
2) Simulations of the waterlogging depth and waterlogging duration are an effective technical approach for dynamically assessing the impacts of waterlogging. The accuracy of the waterlogging simulation applied in this study is 71%, and the results are reliable.
3) We establish an impact assessment indicator for each industry, thereby providing a basis for a refined impact assessment. On this basis, a method for dynamically assessing the impacts of rainstorms on subobjects, subindustries, and subregions based on waterlogging simulation results is proposed and is more targeted than the methods employed in previous studies.
4) As shown in this study, the proposed impact assessment method for waterlogging events can yield detailed results, including the impacts on the population and economy, the impacts on various industries, and both regional and comprehensive impacts.
These research results can help to support timely and effective disaster prevention measures when disasters such as extreme rainstorms occur. Hence, this research is of great significance for reducing the impacts of such disasters and providing technical support to help government decision-makers comprehend the impacts of disasters on various industries in real time.
Disclosure statement
No potential conflict of interest was reported by the authors.
Additional information
Funding
References
- Aronica GT, Candela A. 2007. Derivation of flood frequency curves in poorly gauged Mediterranean catchments using a simple stochastic hydrological rainfall-runoff model. J Hydrol. 347:132–142.
- Bai J. 2004. Study on flood risk zonation assisted by remote sensing and geographical information system. Beijing: Institute of Remote Sensing Applications, Chinese Academy of Sciences.
- Beven KJ, Kirkby MJ. 1979. A physically based, variable contributing area model of basin hydrology/Un modèle à base physique de zone d’appel variable de l’hydrologie du bassin versant. Hydrolog Sci J. 24:43–69.
- Billa L, Mansor S, Rodzi Mahmud A. 2004. Spatial information technology in flood early warning systems: an overview of theory, application and latest developments in Malaysia. Disaster Prev Manage. 13:356–363.
- Campbell CW, Sullivan SM. 2002. Simulating time-varying cave flow and water levels using the Storm Water Management Model. Eng Geol. 65:133–139.
- Cavazza L, Pisa PR. 1988. Effect of watertable depth and waterlogging on crop yield. Agr Water Manage. 14:29–34.
- Djordjević S, Prodanović D, Maksimović Č. 1999. An approach to simulation of dual drainage. Water Sci Technol. 39:95–103.
- Djordjević S, Prodanović D, Maksimović Č, Ivetić M, Savić D. 2005. SIPSON–simulation of Interaction between pipe flow and surface overland flow in networks. Water Sci Technol. 52:275–283.
- Fabry F, Seed AW. 2009. Quantifying and predicting the accuracy of radar-based quantitative precipitation forecasts. Adv Water Resour. 32:1043–1049.
- Fernández D, Lutz M. 2010. Urban flood hazard zoning in Tucumán Province, Argentina, using GIS and multicriteria decision analysis. Eng Geol. 111:90–98.
- Flood DM. 2011. 1D-2D modelling—user manual. Denmark: DHI Water & Environment.
- Geetha K, Mishra S, Eldho T, Rastogi A, Pandey R. 2008. SCS-CN-based continuous simulation model for hydrologic forecasting. Water Resour Manag. 22:165–190.
- Haq M, Akhtar M, Muhammad S, Paras S, Rahmatullah J. 2012. Techniques of remote sensing and GIS for flood monitoring and damage assessment: a case study of Sindh province, Pakistan. Egypt J Remote Sens Space Sci. 15:135–141.
- Hou H. 2012. Flower waterlogging prevention and post-disaster disposal. New Agric. 9:54. (in Chinese).
- Hsu M-H, Chen SH, Chang T-J. 2000. Inundation simulation for urban drainage basin with storm sewer system. J Hydrol. 234:21–37.
- Hsu W-K, Huang P-C, Chang -C-C, Chen C-W, Hung D-M, Chiang W-L. 2011. An integrated flood risk assessment model for property insurance industry in Taiwan. Nat Hazards. 58:1295–1309. doi:10.1007/s11069-011-9732-9.
- Huber WC, Dickinson RE, Barnwell Jr TO, Branch A. 1988. Storm water management model; version 4. United States: Environmental Protection Agency.
- Kahlown MA, Azam M. 2002. Individual and combined effect of waterlogging and salinity on crop yields in the Indus basin. Irrig Drain. 51:329–338.
- Langford M, Harvey J. 2001. The use of remotely sensed data for spatial disaggregation of published census population counts. Remote Sensing and Data Fusion over Urban Areas, IEEE/ISPRS Joint Workshop 2001. IEEE; p. 260–264.
- Li J, Chen Y, Wang H, Qin J, Li J, Chiao S. 2017. Extending flood forecasting lead time in a large watershed by coupling WRF QPF with a distributed hydrological model. Hydrol Earth Syst Sc. 21:1279–1294.
- Liang J. 2016. Brief analysis of application program of optimization design of waterlogging monitoring system for the Pearl River Delta cities. Pearl River. 37:66–69. (in Chinese).
- Liaoning Rural Economic Committee. 2010. Technical scheme of facility agriculture waterlogging resistance and waterlogging Prevention in low-lying and waterlogging-prone areas. (in Chinese).
- Liu C, Pan L. 2011. The impact of rainstorm and flood on aquaculture and its prevention and control measures. Fishery Guide to Be Rich. 14:29–30. (in Chinese).
- Liu H, Jiang D, Yang X, Luo C. 2005. Spatialization approach to 1 km grid GDP supported by remote sensing. Geo-inf Sci. 2:026.
- Luo P, Song X. 2011. A raster-based distributed hydrological model using SCS model. Eng J Wuhan Univ. 44:156–160.
- Malik AI, Colmer TD, Lambers H, Setter TL, Schortemeyer M. 2002. Short‐term waterlogging has long‐term effects on the growth and physiology of wheat. New Phytol. 153:225–236.
- Masden EA, Fox AD, Furness RW, Bullman R, Haydon DT. 2010. Cumulative impact assessments and bird/wind farm interactions: developing a conceptual framework. Environ Impact Assess Rev. 30:1–7.
- Mishra SK, Singh VP. 2002. SCS-CN method. Part I: derivation of SCS-CN-based models.
- Mishra SK, Singh VP. 2003. SCS-CN method. Part II: analytical treatment.
- Misumi R, Nakatani T, Iwanami K, Maki M, Seed AW, Hirano K. 2015. Comparison of rainfall nowcasting derived from the STEPS model and JMA precipitation nowcasts. Hydrol Res Lett. 9:54–60.
- Morello-Frosch R, Zuk M, Jerrett M, Shamasunder B, Kyle AD. 2011. Understanding the cumulative impacts of inequalities in environmental health: implications for policy. Health Aff. 30:879–887.
- Mowla QA, Islam MS. 2013. Natural drainage system and water logging in Dhaka: measures to address the problems. J Bangladesh Inst Planners ISSN. 2075:9363.
- Mukherjee D. 2014. Highway surface drainage system & problems of water logging in road section. Int J Eng Sci. 3:44–51.
- Nanía LS, León AS, García MH. 2014. Hydrologic-hydraulic model for simulating dual drainage and flooding in urban areas: application to a catchment in the metropolitan area of Chicago. J Hydrol Eng. 20:04014071.
- Pukou District People’s Government. 2017. Emergency preparedness plan for meteorological disasters in Pukou District. (in Chinese).
- Quan R-S. 2014. Rainstorm waterlogging risk assessment in central urban area of Shanghai based on multiple scenario simulation. Nat Hazards. 73:1569–1585. doi:10.1007/s11069-014-1156-x.
- Rezacova D, Sokol Z. 2004. Radar verification approach to the QPF for local flash flood storms. Proc ERAD. 2:193–196.
- Shen J. 1989. Introduce a practical small watershed design flood model - SCS model. Pearl River. 1:11–16.
- Shi Y. 2012. Risk analysis of rainstorm waterlogging on residences in Shanghai based on scenario simulation. Nat Hazards. 62:677–689. doi:10.1007/s11069-012-0099-3.
- Singh P, Bhunya P, Mishra S, Chaube U. 2008. A sediment graph model based on SCS-CN method. J Hydrol. 349:244–255.
- Singh VP, Woolhiser DA. 2002. Mathematical modeling of watershed hydrology. J Hydrol Eng. 7:270–292.
- Su B, Huang H, Li Y. 2016. Integrated simulation method for waterlogging and traffic congestion under urban rainstorms. Nat Hazards. 81:23–40.
- Tianjin Agricultural and Rural Committee. 2012. Investigation on facility agriculture loss after heavy rain in Tianjin agricultural commission. (in Chinese).
- Vasiloff SV, Seo DJ, Howard KW, Zhang J, Kitzmiller DH, Mullusky MG, Brooks HE. 2007. Improving QPE and very short term QPF: an initiative for a community-wide integrated approach. B Am Meteorol Soc. 88:1899–1911.
- Vretare V, Weisner SE, Strand JA, Granéli W. 2001. Phenotypic plasticity in phragmites Australis as a functional response to water depth. Aquat Bot. 69:127–145.
- Wei R, Yang L, Xu F, Sun H, Kang Y, Liu Z. 2012. How to manage dairy cows in extremely heavy rainstorm. Animals Breeding and Feed. 11:13–14. (in Chinese).
- Xiao Y, Duan X. 2008. Key Technical Measures for Dairy Farm Production Self-rescue after Rainstorm Disaster. Modern Animal Husbandry. 8:33–34. (in Chinese).
- Xu Y, Pan W. 2006. SCS Model for Watershed Runoff Calculation in ArcView. Res Soil Water Conserv. 13:176–179.
- Yin J, Ye M, Yin Z, Xu S. 2015. A review of advances in urban flood risk analysis over China. Stoch Env Res Risk A. 29:1063–1070.
- Zhang B, Li N, Wang S. 2015. Effect of urban green space changes on the role of rainwater runoff reduction in Beijing, China. Landscape Urban Plan. 140:8–16.
- Zhang W, S M L, Shi Z. 2012a. Formation causes and coping strategies of urban rainstorm waterlogging in China. J. Nat. Disasters. 21:180–184.
- Zhang X, Hu M, Chen G, Xu Y. 2012b. Urban rainwater utilization and its role in mitigating urban waterlogging problems—a case study in Nanjing, China. Water Resour Manage. 26:3757–3766.
- Zhao Y, Hou J. 2012. Discussion on Waterlogging Resistance Technology in Vegetable Production. Vegetable. 8:3–5. (in Chinese).
- Zhu L. 2011a. Investigation on water-wading ability of compact household vehicles. [accessed 2018 Oct 9]. http://www.360doc.com/content/10/0216/22/463408_15967536.shtml. (in Chinese)
- Zhu L. 2011b. Investigation on water-wading ability of medium-sized vehicles. [accessed 2018 Oct 9].https://www.autohome.com.cn/advice/201106/209293-all.html. (in Chinese)
Appendix
1. Dynamic assessment method
Waterlogging is a dynamic process. Conducting only a single assessment of the entire process will not satisfy the needs of meteorological forecasts, nor will it meet the demands of social applications. In this study, in accordance with the development and evolution of heavy rainstorms, we conducted a dynamic assessment every 30 minutes; that is, we obtained an instantaneous impact assessment rating and disaster impact index every 30 minutes until the end of the studied rainfall event. The main steps of the assessment included outlier removal, object impact assessment, regional/industry impact assessment, socioeconomic impact assessment, comprehensive impact assessment, normalization and classification.
1) Outlier removal
In an actual simulation, some outliers are inevitable; thus, it is necessary to exclude such outliers before the assessment is performed. The Layda method, also known as the triple standard deviation method, is based on the postulate that when the difference between a single measurement and the arithmetic mean value of all the measurements is greater than three times the standard deviation, that measurement should be discarded. Equations 11, 12, and 13 represent the mean, standard deviation, and Layda formulas, respectively.
where is the level of impact on an object and
is the number of all impacted objects.
where is the standard deviation and
is the average level of impact on all objects (these quantities are dimensionless).
where this expression indicates that measurement is removed from the samples when the difference between this measurement and the arithmetic mean value of all the measurement is greater than three times the standard deviation (these quantities are dimensionless).
2) Object impact assessment
The impact assessment model presented in this paper is inspired by cumulative impact assessment (Masden et al. Citation2010; 24. Morello-Frosch et al. Citation2011). In this paper, we consider the rapid development of the wind power industry in many countries, such as the UK and China, and the related finding that the impact of the construction of wind power facilities on the surrounding environment does not increase linearly with an increase in quantity but is cumulative (Masden et al. Citation2010). Similarly, with changes in precipitation, the resultant waterlogging has different effects on affected objects. Within a short period at the beginning of the rainstorm process, the impact will be significant; however, over a longer period, the impact will weaken. To solve this problem, we use a power function with an index of less than 1 for the weighted cumulative calculation, where the power function is . The impact assessment for an object is represented by the object impact index:
where represents the impact index at the time of assessment without the accumulation effect and
is the impact index at the time of assessment when the accumulation effect is considered (these quantities are dimensionless).
3) Industry impact assessment
Assessing the impacts of rainstorms on various industries reveals those industries’ ability to withstand waterlogging. We consider industries that are typically affected by waterlogging (e.g., transportation, facility agriculture, aquaculture and livestock breeding) as examples. However, before conducting an industry impact assessment, the land-use data corresponding to each industry must be classified and merged. The classification criteria are shown in . For example, the first class includes water areas and land for water conservancy facilities, and the second class of surface water corresponds to the aquaculture industry. The number of samples of land-use data is considerable; hence, reasonably merging these data can reduce the number of calculations necessary at a given moment during the assessment. The specific approach followed in this paper is to combine smaller objects with surrounding objects to merge them into a single object. The merging rule is as follows: an object is merged with an adjacent object of the same group if its area is below a certain threshold value, where that threshold is 1000 m2 for facility agriculture, 2000 m2 for aquaculture, and 1000 m2 for livestock and poultry breeding. Similarly, road objects below highway level 3 should be merged with other adjacent road objects. This merging rule is intended to ensure that smaller areas are merged into other areas of the same type.
Table 4. Land-use types corresponding to different industries.
The water depth has different influences on different industries; thus, a different set of impact indices is used for each industry to represent the extent of the impact of waterlogging on that industry. These indices are called the maximum, minimum, average, and comprehensive impact indices.
where ,
,
and
represent the average, minimum, maximum and comprehensive impact indices, respectively, for facility agriculture and
represent the individual impact indices for facility agriculture at the times of assessment. Similarly,
,
, and
represent the maximum impact indices for aquaculture, livestock and poultry breeding, and transportation, respectively. All of these parameters are expressed in dimensionless units. Which index (maximum, minimum, or average) is most important typically depends on the specific application scenario. In this study, the indicators used for different industries vary. For the impact of waterlogging on facility agriculture, the maximum impact index is selected; for the impact of waterlogging on traffic and transportation, the maximum impact is also selected; for the impact of waterlogging on livestock and poultry breeding, the average impact index is selected; for the impact of waterlogging on aquaculture, the average impact index is also selected. There are certain uncertainties in these indicators, and the choice of indicator has an important influence on the assessment results.
For example, to analyse the impact of urban land on facility agriculture, the maximum impact index is usually selected.
4) Regional impact assessment
Regions refer to administrative divisions, including villages, towns, and counties. Different regions experience different impacts due to spatial differences in factors such as precipitation and topographical conditions. Regional impact assessments can indicate different regional tolerances to waterlogging, allowing decision-makers in each region to apply targeted measures. The calculation process for a regional assessment mainly considers the accumulation time and accumulation area:
where is the impact assessment result for a region,
is the impact assessment result for area i of the region at the assessment time,
is the spatial area of area i (unit: km2),
is the total spatial area of the region (unit: km2), and
is the number of statistical areas at the considered level. These quantities are expressed in dimensionless units. Similar to the impact indices for different industries discussed above, we can consider maximum, minimum and average impact indices at the regional level.
5) Socioeconomic impact assessment
The population and economy have the most critical influences on the impact assessment. shows the classification scheme for the impacts of waterlogging on the population and economy. The impacts on “human” and “economic” (GDP) activities are each divided into 5 levels: 0, 1, 2, 3, and 4, which correspond to no impact, low impact, moderate impact, high impact and very high impact, respectively. The impact on the population is not considered to involve human deaths; mainly the impact on people’s travel is considered here. Population counts and economic values are mainly used to quantify the extent of the impact on the population and economy. The steps of the population assessment are as follows: First, use the population spatialization method to spatialize the population in Pukou District; then, calculate the population counts for each statistical region using Equations 20, 21, 22, 23 and 24. Finally, obtain a set of graded population and economy impact data.
Table 5. Statistical indicators of waterlogging for the population and the economy.
where ,
,
,
and
represent the populations impacted at levels of 0, 1, 2, 3, and 4, respectively;
denotes a summation; and
represent the demographic units at level 0. These quantities are expressed in dimensionless units. The economic evaluation equations are similar to those used in the population assessment.
6) Comprehensive impact assessment
A comprehensive impact assessment reveals the overall impact at different moments during a precipitation event and is of great significance for government decision-making. In this paper, we consider a comprehensive impact assessment conducted at intervals of 30 minutes. The calculation process mainly includes spatial accumulation and time accumulation:
where is the comprehensive impact assessment result,
is the comprehensive impact index at a particular moment for a particular area (dimensionless),
is the area associated with
(unit: km2), and
is the total affected area (unit: km2).
7) Normalization and classification
To enable comparison of the impact indices, we normalize the impact index values. The equation is as follows:
where is a normalized impact index, with values between 0 and 1, and
is the corresponding maximum impact index. These quantities are expressed in dimensionless units.
Finally, we assign different grades as follows in accordance with the normalized index values: 0–0.15 corresponds to grade 0, 0.15–0.38 corresponds to grade III, 0.38–0.62 corresponds to grade II, and 0.62–1 corresponds to grade I.
2. Impact levels of rainstorm waterlogging points on 1 August 2008, in the urban area of Nanjing, China
Table A1. Impact levels of rainstorm waterlogging points on 1 August 2008, in the urban area of Nanjing, China.