
Abstract
Carbon black was investigated to assess and quantify the possibility that nanoparticles might migrate out of plastic materials used in the food packaging industry. Two types of carbon black were incorporated in low-density polyethylene (LDPE) and polystyrene (PS) at 2.5% and 5.0% loading (w/w), and then subjected to migration studies. The samples were exposed to different food simulants according to European Union Plastics Regulation 10/2011, simulating long-term storage with aqueous and fatty foodstuffs. Asymmetric flow field-flow fractionation (AF4) coupled to a multi-angle laser light-scattering (MALLS) detector was used to separate, characterise and quantify the potential release of nanoparticles. The AF4 method was successful in differentiating carbon black from other matrix components, such as extracted polymer chains, in the migration solution. At a detection limit of 12 µg kg−1, carbon black did not migrate from the packaging material into food simulants. The experimental findings are in agreement with theoretical considerations based on migration modelling. From both the experimental findings and theoretical considerations, it can be concluded that carbon black does not migrate into food once it is incorporated into a plastics food contact material.
Introduction
Carbon black (CAS No. 1333-86-4/EINECS No. 215-609-9) is a form of virtually pure elemental carbon. Its physical appearance is that of a black, finely divided pellet or powder. It is used as additive, filler, or pigment, e.g. in tyres, rubber and plastic products, printing inks, and coatings (Wang et al. Citation2003). Carbon black is produced in a specific and controlled industrial process. Hydrocarbon raw material is converted to elemental carbon by vapour-phase pyrolysis and partial combustion (Wang et al. Citation2003; Voll & Kleinschmit Citation2010). By this process, carbon black with high purity (more than 97% carbon) and distinct particle shape and size is produced (Watson & Valberg Citation2001). Thus, carbon black can be distinguished clearly from soot, the unwanted by-product from incomplete combustion processes such as exhausts from diesel or household and industrial firing. The most common process of carbon black production is the furnace black process where liquid and gaseous hydrocarbons from raw oil fractions are used both as feedstock and as a heat source. Heavy aromatic oils are cracked in the flame of the furnace, forming carbon black particles (ICBA Citation2004).
The generated primary particles fuse together and form stable aggregates in the furnace reactor. The primary particle size, which may range between 10 and 500 nm diameter, as well as the formation and structure of aggregates, is controlled by the production process (Voll & Kleinschmit Citation2010). In these aggregates the primary particles build branched chains forming various internal structures, depending on the production parameters. These aggregates are the smallest dispersible unit of carbon black (ASTM 2013; ICBA n.d.). The size of the aggregates given as average aggregate diameter may range from 80 to 810 nm in different carbon black types and can further accumulate to agglomerates of approximately 1–100 µm, which are loosely bound together by weaker forces (Environment Canada Citation2011). By mechanical forces (e.g. shear forces during extrusion at production of plastic material) agglomerates can be broken to aggregates again, whereas aggregates will hardly be broken to smaller units (Gray & Muranko Citation2006).
Owing largely to the fact that the primary particles of carbon black aggregates and agglomerates fall in the nanoscale range, most carbon black types, and particularly those used in plastic materials, fall under the European definition of nanomaterial. According to the European Commission Recommendation (EC Citation2011a), a substance is a nanomaterial when it consists of particles either unbound or fused together to aggregates or agglomerates and when 50% in the number size distribution of the particles are within the 1–100 nm size range, in one or more dimensions. The International Organization for Standardization technical specification ISO/TS 80004–1 (ISO Citation2010) distinguishes between nano-objects and nano-structured materials. Nano-objects possess one, two or three external dimensions in the nanoscale size range (from approximately 1 to 100 nm). Nanostructured materials possess internal structures within the nanoscale size range, whereas the external dimensions are typically but not necessarily larger than the nanoscale range. Carbon black is thus considered a nanostructured material as per the ISO criteria (ISO Citation2010).
There has been a growing concern about the safety of consumers exposed to nanomaterials used in consumer products in the last years (EFSA Citation2011), mainly because the knowledge about the exposure to and the uptake of nanomaterials by the consumer is limited (Savolainen et al. Citation2010; Hunt et al. Citation2013). Additionally, toxicological effects, especially those caused by long-term oral exposure, have not been fully characterised or are mainly unknown (Hunt et al. Citation2013, SCENIHR Citation2009). In the last few years, many toxicological research projects have been started, and most are still ongoing. Due to this gap in knowledge, many regulatory authorities tend to act very cautiously, in line with the precautionary principle. For example, European Union Plastics Regulation 10/2011 (EC Citation2011b) has introduced specific rules for nanomaterials in 2011 requiring that all nanomaterials to be used in food contact materials must now be specifically approved in their ‘nano’-form (Article 9 (2)). Approval of only the respective bulk material is no longer sufficient to assume safety of the ‘nano’-form. Furthermore, nanomaterials are not included in the exemption for the use of non-approved substances behind a functional barrier (Article 13 (4) b). In ‘Whereas’ no. 23 of the Plastics Regulation, this special treatment of nanomaterials is justified as follows:
New technologies engineer substances in particle size that exhibit chemical and physical properties that significantly differ from those at a larger scale, for example, nanoparticles. These different properties may lead to different toxicological properties and therefore these substances should be assessed on a case-by-case basis by the Authority as regards their risk until more information is known about such new technology.
Carbon black is already included in European Union Plastics Regulation 10/2011 with a nano-specification as its structure is well known and characteristic of the carbon black used for decades in plastics food contact applications. For food contact plastics carbon black grades with primary particles of 10–300 nm size, which are aggregated to a size of 100–1200 nm and which may form agglomerates within the size distribution of 300 nm up to the mm range may be used according to Annex I of the regulation. However, the safety evaluation by the Scientific Committee on Food at the European Commission (SCF) did not specifically focus on the nanomaterial characteristics at that time. Based on this evaluation, a series of purity requirements and a maximum allowed use level of 2.5% have been specified for carbon black to be used in food contact material. A specific migration limit is not set. In plastic materials, carbon black is fully incorporated in the polymer matrix, forming so-called nano-composites. The carbon black particles in the form of aggregates are fully embedded within the polymer chains. Exposure of the consumer can only occur if carbon black particles are released from the plastic, migrating out of the matrix into food.
Several studies have been published on migration of nanoparticles out of polymers. Most of them investigated nanosilver in polyolefins, which is used as an antimicrobial agent. This is a special case due to the easily reversible transformation of elemental silver to silver ions. An overview and discussion on this issue is given by Bott et al. (Citation2014). Schmidt et al. (Citation2009) determined nanoclay migration from polylactic acid nanocomposites. By coupling asymmetric flow field-flow fractionation with element-specific ICP-MS, migration of nanoclay particles was not detectable. In another study (Schmidt et al. Citation2011), migration of organomodified layered aluminium magnesium hydroxide platelets from polylactic acid nanocomposites was reported in 95% ethanol but attributed to the partial decomposition of the polymer at migration conditions. Furthermore, in this study particles as such were not directly determined, but only indirectly via migration of magnesium. Therefore, a partial dissolution of the platelets by the simulant cannot be excluded. We are not aware of any study that has reported on the migration of carbon black out of nanocomposites.
The objective of this study was to assess whether carbon black can migrate from food contact plastics into foodstuffs. Low-density polyethylene (LDPE) was chosen because it has the highest diffusivity among usual food contact plastics and can therefore be regarded as representing a worst case for migration. In addition to LDPE as a non-polar polymer, polystyrene (PS) was chosen as medium polar polymer to cover the polarity range of standard polymers. Two different grades of carbon black were incorporated in these polymer types and the composites were subjected to migration experiments.
To quantify any potential migration of nanomaterials from a plastic matrix, a very sensitive technique is needed to separate and detect nanomaterials in migration solutions, e.g. asymmetric flow field-flow fractionation (AF4). The main principle of AF4 separation is thereby the size-dependent diffusion of particles against a contrary separation force field (cross-flow) in a channel with parabolic flow profile (Giddings Citation1993; Messaud et al. Citation2009). Because carbon black is essentially composed of elemental carbon and lacks chemical functionalities, only non-specific detection is possible. Determining unambiguously carbon black particles is possible when they are separated from other compounds migrating out of the polymer, e.g. polymer chains, by the AF4 method. Detection was performed by multi-angle laser light-scattering (MALLS), which is based on static light-scattering (Brar & Verma Citation2011). Dispersed particles scatter the incident laser light at different angles and intensities depending upon their size and structure level. From the angular-dependent variation of scattered light intensities, the particle sizes can be calculated. The sum of all detector outputs (i.e. the detected signals at different angles) can be used to determine the concentration of particles (mass per injected volume).
Materials and methods
Materials
The carbon black grades Printex© 80 and Printex© 85 (both Orion Engineered Carbons GmbH, Frankfurt am Main, Germany) were provided as powder as well as already incorporated into plaques of polystyrene (PS) and low-density polyethylene (LDPE) at a loading of 0 mg kg−1, 25 g kg−1 (2.5%) and 50 g kg−1 (5.0%). Specific characteristics of both carbon black types are summarised in . The PS was prepared from a mixture of Polystyrol 143 E (BASF SE, Ludwigshafen, Germany) and Polystyrene Cristal 1810 (Total Petrochemicals USA Inc., Port Arthur, TX, USA). The LDPE was prepared from a mixture of Lupolen 3020 K (Lyondellbasell Industries AF S.C.A., Rotterdam, Netherlands) and ICORENE N 2105 (ICO Polymers, Allentown, PA, USA). The plastic plaques were produced by injection moulding to a size of 90 × 60 × 3 mm, and were provided by Orion Engineered Carbons.
Table 1. Properties of carbon black grades used in the study.
Transmission electron microscopy (TEM)
TEM micrographs of the plastic plaques and of the carbon black dispersions were prepared by AQura GmbH (Hanau-Wolfgang, Germany), using a Hitachi H7500 transmission electron microscope (Hitachi Ltd. Corporation, Tokyo, Japan) at 100 keV primary electron beam acceleration voltage. With this technique, dispersion level, particle size and distribution characteristics of the carbon black in the powder and in the polymer can be visualised. The TEM specimens of the plaques with the lower carbon black loading (2.5%) were prepared by cryo-ultrathin sectioning using a vibrational diamond knife device (Diatome, Hatfield, PA, USA; type ultrasonic: frequency 27–28 kHz, amplitude 17 V). TEM micrographs of both carbon black grades in the dry state were produced by dispersing the carbon black powders in chloroform and applying them onto microscope grids.
Preparation of carbon black dispersions
Different aqueous and organic solutions were evaluated for their ability to keep carbon black in stable dispersion for AF4/MALLS measurements. Aqueous surfactant dispersions were made of ultrapure water (TKA Gen Pure, Thermo Electron LED GmbH, Niederelbert, Germany) with two surfactants – sodium dodecyl sulphate (2000 mg l−1) and Novachem (mixture of surfactants provided by Postnova Analytics GmbH, Landsberg am Lech, Germany) (2000 mg l−1), respectively, each stabilised by the biocide sodium azide (200 mg l−1). The aqueous solutions were filtered (0.1 µm Millipore filter disc, Merck KGaA, Darmstadt, Germany) to remove any potential particulates. Furthermore, 95% ethanol was used as organic dispersant. The ethanol was distilled and filtered (0.1 µm Millipore filter disc) to clean the solvent. For dispersion experiments, 100 mg l−1 stock dispersions of each carbon black powder were prepared with the particular solvent. In order to break agglomerates, all dispersions were sonicated in an ultrasonic bath (ELMA Transsonic 420, 70 W, 35 kHz; Elma Hans Schmidbauer GmbH & Co. KG, Singen, Germany) for 30 min. In both aqueous surfactant solutions, carbon black rapidly sedimented while relatively stable dispersions without visible sedimentation were obtained in 95% ethanol. For calibration purposes, the entire carbon black was considered. Since ethanol is aseptic, it was not necessary to add biocides.
Asymmetrical flow field-flow fractionation (AF4)
AF4 measurements were carried out with the ‘AF2000 MT Series mid temperature’ (Postnova Analytics) system equipped with a 350 µm channel and a cellulose membrane (cut-off: 5 kDa; Postnova Analytics). The channel was constantly maintained at 40°C. Filtered 95% ethanol (0.1 µm Millipore filter disc) was used as flowing liquid for the AF4. The channel flows were controlled by ‘AF2000 Control Program’ software (Postnova Analytics). Samples were injected into the channel at a flow of 0.1 ml min−1 with a focus flow of 3.1 ml min−1. During the injection time of 10 min and an additional transition time of 1 min, the cross-flow was kept constant at 2.5 ml min−1. After transition (i.e. deletion of the focus flow) the cross-flow was reduced within 10 min to 0.1 ml min−1 (power gradient of 0.2), followed by a linear decline during 10 min until the separation force reached zero. The main channel flow was kept constant at 0.7 ml min−1 during the entire run. Samples were injected by full-loop injections of a PN5300 series autosampler (Postnova Analytics) equipped with a 1000 µl sample loop.
Multi-angle laser light-scattering spectrometry (MALLS)
A seven-angle MALLS detector ‘Bi-MwA’ (Brookhaven Instruments Corporation, Holtsville, NY, USA) was used for the detection and characterisation of particles, controlled by ‘AF2000 Control Program’ software (Postnova Analytics). For the size calibration of the MALLS detector, certified PS latex particles of 22, 58 and 100 nm diameter were used (negatively charged PS microspheres with sulfate functional groups on the surface; Postnova Analytics). The size of the eluting particles was calculated as the radius of gyration, rg using a second-order polynomial of a Debye plot for carbon black and a random coil fit for large particles like polymer fragments within the software. The calculated rg was converted into a geometrical radius (rgeo) under the assumption of a compact sphere using the equation: rg2 = 0.6 r2geo (Andersson et al. Citation2003). For hollow spheres, rg = rgeo (Podzimek Citation2011). The detector was directly coupled to the AF4 system and was operated at λ = 635 nm and 25 mW laser power. Sequential dilutions of carbon black stock dispersions, prepared as described above in 95% ethanol, were used for concentration calibration, the determination of the detection limit and particle size distribution. For this purpose, dispersions of 10, 25, 50, 100 and 250 µg l−1 Printex© 80 or Printex© 85 and a 95% ethanol blank were prepared in triplicate and injected in duplicate in the AF4/MALLS system. The signal outputs of all seven MALLS angles were integrated with Excel and combined to obtain the total peak area that was correlated to the carbon black concentrations given in µg l−1 or the absolute carbon black amount in ng per injection.
Migration tests
Migration was investigated in 3% acetic acid and 95% ethanol by total immersion at 60°C for a contact period of 2, 4, 8 and 10 days according to standards EN 13130-1 and EN 1186-3, but in a slightly modified way. Furthermore, the samples were investigated while in contact with isooctane under rapid extraction conditions at 40°C for 24 h, according to EN 1186-15. The whole plastic plates were cut in three 20 × 70 × 3 mm strips for a total area of 1 dm2, cutting edges included. The three strips were stored in 100 ml Schott-bottles with PTFE-sealed caps. Before filling, both the samples and the bottles were blown out with nitrogen to prevent any dust contamination. The bottles were filled with 100 ml of the respective simulants, entirely covering the test strips. Glass sticks were used as spacers between the strips to ensure that all sides were in contact with the simulant. The preparations were then stored in a thermostated oven. At the end of the storage time, the bottles were ultrasonicated for 5 min to detach any potential particles from the plastic plaques and the glass sticks. These migration tests were carried out on the PS and LDPE plaques at 2.5% and 5.0% carbon black loading and also on reference plaques without carbon black. Furthermore, the pure simulants were stored under the same test conditions. Each plastic sample was prepared in triplicate for the migration test, then duplicate measurements were performed on the AF4 system. For each sampling time point, separate migration samples were prepared.
95% ethanol was used both as eluent for the AF4 runs and as solvent for the carbon black dispersion standards. The migration samples in 95% ethanol were directly injected into the AF4 system. Isooctane and 3% acetic acid needed additional sample preparation. Both simulants were quantitatively transferred into 20 ml vials in several steps and carefully evaporated to dryness at 40°C by a gentle nitrogen stream. The residue was then redispersed with 5 ml 95% ethanol and ultrasonicated for 5 min.
Stability testing under migration test conditions
Freshly prepared carbon black dispersions were analysed before and after storage under the same conditions as the migration samples (10 days at 60°C for 3% acetic acid and 95% ethanol; 24 h at 40°C for isooctane). A 100 mg l−1 stock dispersion in 95% ethanol was used to spike each simulant with a carbon black content of 100 µg l−1 by adding 0.1 ml of the stock dispersion to the simulant and filling up to 100 ml in a 100 ml polypropylene volumetric flask. The 95% ethanol dispersions were measured directly while the isooctane and 3% acetic acid dispersions were first evaporated to dryness and collected with 5 ml 95% ethanol. The stability was determined as the ratio of the total peak area of a stored sample and a freshly prepared sample. This ratio was used to calculate the detection limit of carbon black dispersions under migration conditions.
Mathematical modelling and comparison with substance molecular volumes
Mathematical modelling was carried out using the Migratest Lite 2001 software (FABES 2003), which is based on the analytical solution of Fick’s second law according to the modelling guideline (Simoneau Citation2010) and suitable for modelling migration from monolayer materials in well-mixed liquids. For comparison with the properties of nanoparticles, the diffusion coefficients of the model substances Irganox 1076, Irganox 1010 and Tinuvin 770 () were estimated from their molecular weight using the approach from the modelling guideline (Simoneau Citation2010). The calculations were performed in the ‘individual polymer mode’ from the Migratest software. The polymer specific parameters A´P and τ were taken from the guide (LDPE: A´P = 11.5, τ = 0; PS: A´P = –1, τ = 0) and inserted manually for calculation of the diffusion coefficients.
Table 2. Additives used for mathematical migration modelling.
The molar volumes were calculated by the ‘molinspiration’ programme (http://www.molinspiration.com). For migration modelling, nanoparticles were assumed as spheres. The volumes VNP of the nanoparticles were calculated from their diameter d (VNP = 6−1*π*d3).
Diffusion coefficients according to the approach of Simon et al. (Citation2008) were calculated using their equation (5) with the dynamic viscosities at 25°C given in there.
Results and discussion
Choice of carbon black types
Printex® 80 and Printex® 85 were selected because of their typical morphology and size as representative for carbon black grades in food contact plastic applications. Both carbon black grades have comparable average primary particle diameter in the range of 16 nm (), but differ in their structure level. Extensive interlinking or branching of the aggregates characterises a ‘high structure’ (Printex® 80), whereas less pronounced interlinking or branching indicates a ‘low structure’ (Printex® 85). Structure levels are determined through the oil absorption number (OAN). The primary particle size of 16 nm is in the lower range of the sizes allowed in the European Union Plastics Regulation 10/2014 (10–300 nm) and can be considered as a worse case. The selected concentrations in the polymer were 2.5%, which is the maximum concentration allowed for food contact materials as per European Union Regulation 10/2011 and double that concentration (5.0%).
Characterisation by TEM of the nanostructured material in the polymer and the dry state
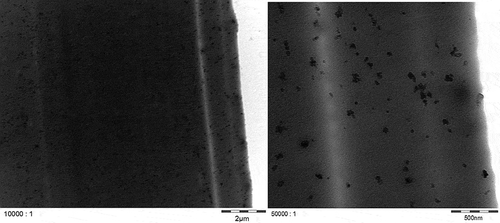
TEM micrographs of Printex© 80 and Printex© 85 in the dry state () confirmed that both grades have similar primary particle sizes and, in general, exhibit aggregates larger than 100 nm. Smaller aggregates of about 40 nm could also be observed, but isolated primary particles of about 16 nm were not found in any of the micrographs. All aggregates are likely more ellipsoidal than spherical. The TEM micrographs of LDPE ( and ) and PS ( and ) show that both nanostructured carbon blacks were homogenously distributed in both polymers. The quality of these images is limited but the carbon blacks in the polymer seem to have the same characteristics as in the dry state, with 40–100 nm aggregates consisting of fused primary particles.
Figure 1. TEM micrographs of carbon black in the dry state: left: Printex® 80, right: Printex® 85.
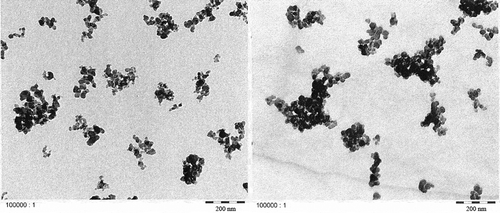
Figure 2. TEM micrographs of 2.5% Printex® 80 in LDPE at two magnifications.
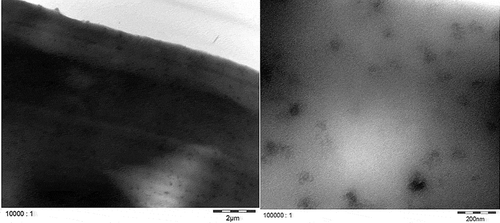
Figure 3. TEM micrographs of 2.5% Printex® 85 in LDPE at two magnifications.
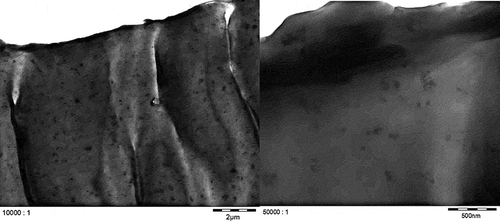
Figure 4. TEM micrographs of 2.5% Printex® 80 in PS at two magnifications.
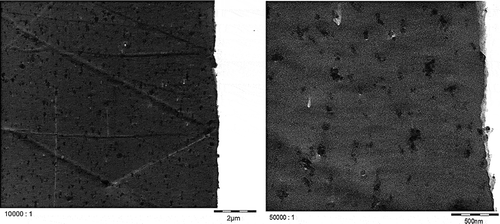
Figure 5. TEM micrographs of 2.5% Printex® 85 in PS at two magnifications.
Characterisation of carbon black dispersions by AF4/MALLS
A pronounced peak at a retention time ranging from 17 to 27 min was obtained for the Printex© 80 () and Printex© 85 () dispersions. This suggests a similar particle size distribution for both types of carbon black. In both cases, the radii of gyration (rg) are increasing with the elution time, from about 50 to 100 nm, confirming a successful separation of the carbon black particles by size in the AF4 channel. For both carbon black grades, the radius of gyration for the main fractions was calculated as rg = 65 nm. Injections of the 95% ethanol blanks did not produce any peak in the AF4 fractogram.
Figure 6. Signal of the 90° MALLS detector of Printex® 80 (50 µg l–1) overlaid with the solvent blank (black dots) and the calculated radii of gyration per elution time (grey dots).
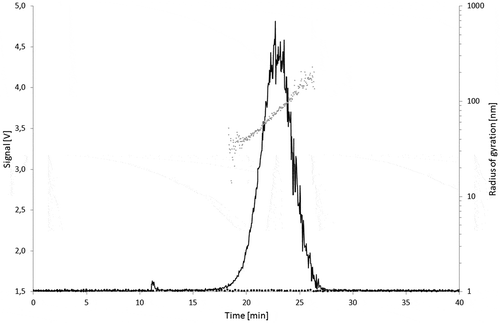
Figure 7. Signal of the 90° MALLS detector of Printex® 85 (50 µg l–1) overlaid with the solvent blank (black dots) and the calculated radii of gyration per elution time (grey dots).
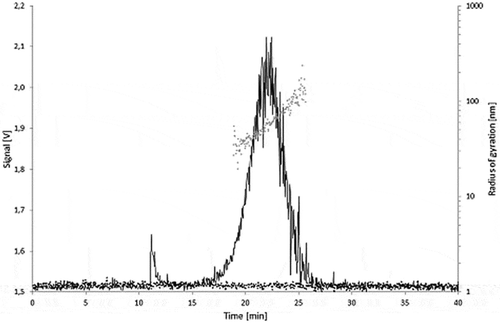
Theoretically, rg can be recalculated into a geometrical size. Under the assumption of a compact sphere, the calculated radii of gyration are corresponding to geometrical diameters (dgeo) of 130–260 nm, and of 168 nm at the peak maximum. For hollow spheres, the geometrical radius is equal to the radius of gyration, rg = dgeo. Under this assumption, the geometrical diameters would range from 100 to 200 nm. These AF4/MALLS findings confirm what is being observed on the TEM micrographs where the carbon black aggregates are generally found larger than 100 nm. The carbon black nanostructured material is neither compact nor a simple hollow shell, but a porous three-dimensional arrangement of fused primary particles. Therefore, an exact geometrical size cannot be directly derived from the MALLS signal. But from these data it can be estimated that the size of the aggregates from both carbon black grades fall in the lower range of the specification for carbon black aggregates (100–1200 nm) given in European Union Plastics Regulation 10/2011. The aggregate size can be considered as worse case for migration testing therefore.
Printex© 80 produced a higher MALLS response than Printex© 85 at identical concentration and injection volume. This might be explained by its higher structure level. Aggregates with extensive branching have more scattering centres relative to their geometrical size than less complex aggregates. This results in higher light-scattering intensities with no effect on the AF4 retention time or the calculated radii, which are all essentially dependent on the aggregate external size.
Migration results
For the migration studies, the test conditions were chosen according to Annex V of European Plastics Regulation (EU) 10/2011 to simulate long-term storage (more than 6 months) at RT including hotfill (2 h at 70°C or 15 min at 100°C). As representative for aqueous simulants 3% acetic acid was used, as alternative fat simulants 95% ethanol and isooctane. 3% acetic acid and 95% ethanol do not, or only in a minor extent, interact with the LDPE and PS polymers in terms of swelling. Isooctane swells LDPE as well as PS, therefore, migration is accelerated. The 24 h at 40°C contact with isooctane can be regarded as at least as strong as or stronger than migration in oil for 10 days/60°C. Migrations of additives or overall migration from thick LDPE plaques in contact with isooctane at these rapid extraction conditions are usually clearly higher than from the plaques in contact with oil at the conventional test conditions.
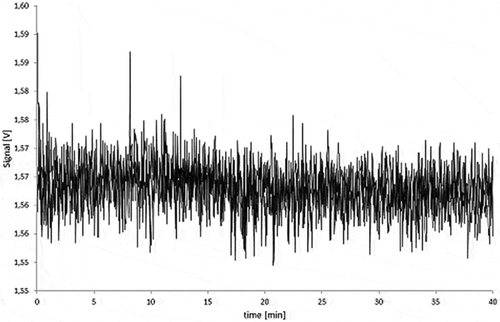
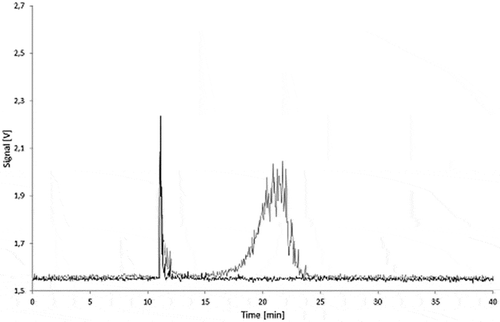
For all the LDPE samples, irrespective of the carbon black loading and exposure time, no AF4 signal could be detected in all simulants at the expected elution time for carbon black. The fractograms for the 5.0% carbon black LDPE samples are shown in and . The peaks observed between 10 and 15 min for the 95% ethanol and isooctane migration samples were also found in the LDPE blank migration solutions. Some oligomers and polymer chains are dissolved in the simulants, and these peaks can be attributed to large LDPE fragments which elute immediately after removing the AF4 focus flow.
Figure 8. Fractograms of the LDPE migration samples: 5.0% Printex® 80 in LDPE, 5.0% Printex® 85 in LDPE and LDPE blanks of the isooctane (24 h/40°C) and 95% ethanol (10 days/60°C) migration samples.
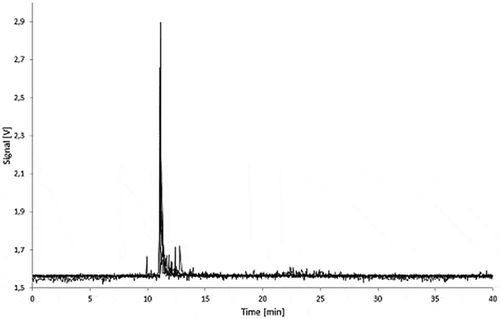
Figure 9. Fractograms of the LDPE migration samples: 5.0% Printex® 80 in LDPE, 5.0% Printex® 85 in LDPE and LDPE blank of 3% acetic acid (10 days/60°C) migration samples.
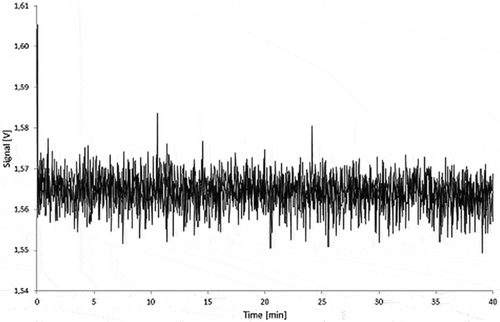
Similar results showing no carbon black migration were also obtained for all PS samples in any test condition. and depict a series of fractograms for the 5.0% carbon black migration samples in PS. As for LDPE, peaks attributed to the polymer matrix are observed between 10 and 15 min.
Figure 10. Fractograms of the PS migration samples: 5.0% Printex® 80 in PS, 5.0% Printex® 85 in PS and PS blanks of the isooctane (24 h/40°C), 95% ethanol (10 days/60°C) migration samples.
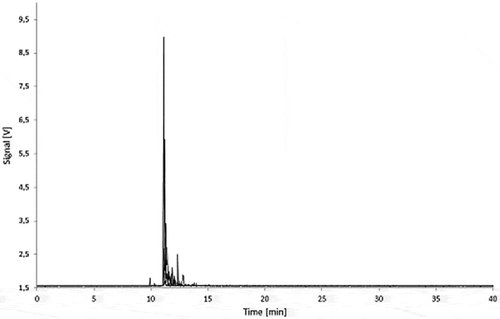
Figure 11. Fractograms of the PS migration samples: 5.0% Printex® 80 in PS, 5.0% Printex® 85 in PS and PS blank of 3% acetic acid (10 days/60°C) migration samples.
The migration samples with shorter contact time (2, 4 and 8 days) as well as the lower concentrated polymer samples (2.5% carbon black) in both polymers did not show any specific carbon black peak either.
These results were validated by spiking the migration solutions with a known amount of carbon black ( and ). Carbon black was recovered at the expected elution time. Furthermore, the AF4 runs of the spiked solutions proved that a good separation between carbon black and polymer fragments is achievable.
Figure 12. 5.0% Printex® 85 in LDPE migration sample (10 days/60°C in 95% ethanol): untreated (black) and spiked with 50 µg l–1 of Printex® 85 (grey).
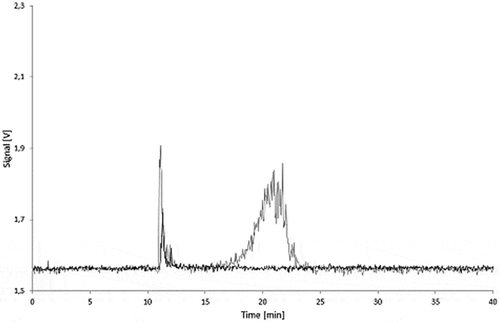
Figure 13. 5.0% Printex® 80 in PS migration sample (24 h/40°C in isooctane): untreated (black) and spiked to 25 µg l–1 with Printex® 80 (grey).
Detection limit and calibration of the AF4/MALLS system
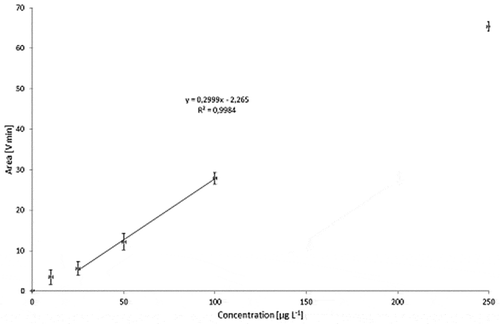
Dispersions with carbon black concentrations in the range of 10–250 µg l−1 were used to calibrate the detector ( for Printex© 80 and for Printex© 85). To take into account the angular dependence of the light-scattering, the total peak area of all MALLS detector angles was calculated and plotted against the respective concentration. The Printex© 80 signal was found to be directly proportional to the concentration () whereas the calibration curve for Printex© 85 is not linear over the full concentration range (). The lowest detectable amount of Printex© 80 was estimated to be 10 ng at an injection volume of 1000 µl (10 µg l−1). Despite the non-linearity, the 10 µg l−1 standard for Printex© 85 could still be clearly distinguished from the background () at each detector angle. Therefore, the detection limit for Printex© 85 was also estimated to be 10 ng.
Figure 14. Sequential dilution of Printex® 80: blank, 10, 25, 50, 100 and 250 µg l–1; signal of the 90° MALLS detector.
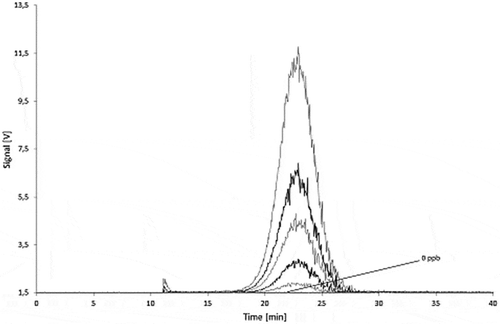
Figure 15. Sequential dilution of Printex® 85: blank, 10, 25, 50, 100 and 250 µg l–1 signal of the 90° MALLS detector.
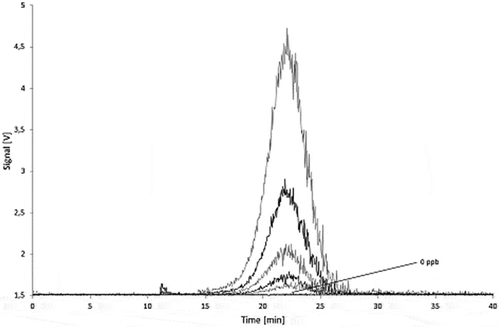
Figure 16. Calibration curve for Printex® 80: total MALLS output versus concentration of standard (1000 µl injections) with relative standard deviations.
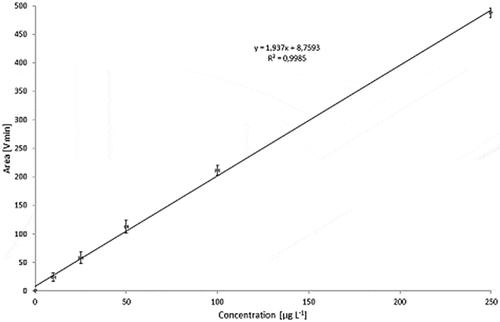
Figure 17. Calibration curve for Printex® 85: Total MALLS output versus concentration of standard (1000 µl injections) with relative standard deviations.
Stability of carbon black particles at migration conditions
During storage at migration test conditions the carbon black aggregates may agglomerate or get trapped by adsorption on the glass walls. Therefore, the influence of the storage in the simulants at the test conditions on the stability of the dispersed carbon blacks was investigated. In 95% ethanol after 10 days storage at 60°C, AF4 fractograms of Printex© 80 () as well as of Printex© 85 () showed lower signals, peak broadening, and a slightly delayed elution of carbon black compared with the fresh dispersions. The dispersions in isooctane and 3% acetic acid showed similar effects, but produced even lower signals. The results of the stability tests in the various simulants are summarised in and .
Figure 18. Stability of a Printex® 80 dispersion in 95% ethanol: signal of the 90° MALLS detector of a freshly prepared dispersion (black) and of a dispersion stored for 10 days at 60°C (grey).
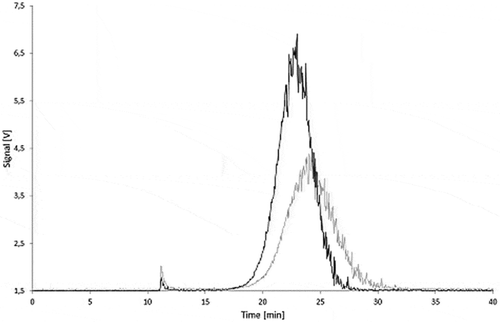
Figure 19. Stability of a Printex® 85 dispersion in 95% ethanol: signal of the 90° MALLS detector of a freshly prepared dispersion (black) and of a dispersion stored for 10 days at 60°C (grey).
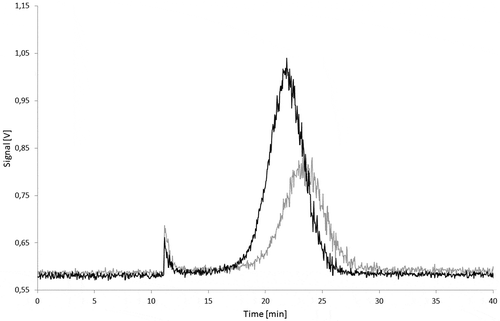
Table 3. Stability of carbon black in 95% ethanol at migration conditions (1000 µl injections of 100 µg l−1 dispersions).
Table 4. Stability of carbon black in isooctane and 3% acetic acid at migration conditions (1000 µl injections of 100 µg l−1 dispersions).
A delayed elution in the AF4 run corresponds to an increase in particle size and a peak broadening to a wider particle size distribution. Both effects indicate reagglomeration of the aggregates. Such agglomeration should have only a minor effect on the total peak area as the number of light-scattering centres remains the same. The decrease of the total signal area might be caused by adhesion of the nanomaterial on the surface of the glass bottles as isooctane and 3% acetic acid are poor dispersants for carbon black. Furthermore, they could not be injected directly and needed the solvent changed to 95% ethanol. During this process, large but reproducible losses occurred. These were compensated by the lower ethanol volume.
The detection limits obtained in 95% ethanol were corrected for the lower recovery from the storage stability test ( and ). The detection limits (ng per 1 ml injection volume) need to be related to the volume of simulant (100 ml) and the sample area (1 dm2). The detection limits after storage correspond to about 2 µg dm−2 in 95% ethanol, isooctane and 3% acetic acid for both Printex© 80 and Printex© 85. Assuming a surface to volume ratio of 6 dm2 kg−1, according to the EU cube model, the filling related detection limit corresponds to 12–14 µg kg−1 of food.
Mathematical modelling
Diffusion processes within polymers can be described by Fick’s second law. In polymers, the diffusion coefficients strongly depend on the size of the migrating species and get smaller as the size increases. Several approaches to estimate diffusion coefficients of monomers, additives, and other organic compounds in polymers exist (Piringer Citation2008). An equation for common polymers is given by the European Union modelling guideline for food contact plastics (Simoneau Citation2010) and recommended there for conformity evaluation of food contact plastics by modelling. This equation was established by Piringer in the 1990s, and further validated and refined within European Union Project SMT4-CT98-7513 (Begley et al. Citation2005; Mercea & Piringer Citation2008). The diffusion coefficient is a function of the temperature, the molecular weight of the migrating substance, and general diffusivity parameters (A´P and τ) of the polymers (Ap model). The molecular weight is used as a measure of the molecular size. The diffusivity parameters A´P and τ were statistically derived from diffusion coefficients obtained experimentally in such a way that they overestimate the real diffusion on a 95% confidence basis. The equation is valid for plastic additives and monomers of a molecular weight essentially below 1000 Daltons but may be extrapolated up to 4000 Daltons (FABES 2003). For simplification reasons, the activation energy for the diffusion is assumed to be constant for all molecules in this model, though in reality the activation energy increases with increasing molecular size (Reynier et al. Citation1999; Welle & Franz Citation2012). In consequence, the overestimation of real migration is higher for larger molecules.
In order to illustrate the dependency of the diffusion on the size of the migrating species, three additives in LDPE and PS have been modelled. The results are extrapolated to the size of carbon black nanoparticles and typical aggregates. The three selected model additives are two phenolic antioxidants (Irganox 1076 and Irganox 1010) and the hindered amine stabiliser (HALS) Tinuvin 770. For comparison, identical plaques as used in the carbon black migration experiments were assumed (3 mm thick LDPE and PS plaques) with an initial concentration of 5.0% although such a high additive concentration is highly unrealistic. This theoretical level was chosen to mimic the carbon black compounds under study. The selected migration test conditions were 10 days at 40°C. The molecular weights and volumes of the three additives vary by a factor of 4 (). The predicted migration rates in both LDPE and PS decrease approximately by a factor of 10 and the diffusion coefficient by a factor of 100 every time the molecular weights double.
Table 5. Migration modelling of three additives in relation to their molecular size (plaques 3 mm, 5% additive concentration, 10 days/40°C, K = 1, surface to volume ratio 6 dm2 kg−1).
Nanomaterials are characterised by the external dimensions of their constituents which are primary particles, aggregates and agglomerates. For comparison with the conventional migration modelling, the molecular volumes of the additives and the volumes of these constituents up to 100 nm in diameter were calculated assuming spheric geometry. A spherical nanoparticle of 10 nm in diameter has a volume of 524 nm3, which is about a thousand times larger than that of Irganox 1076. Using the approximation above, this would correspond to a diffusion coefficient of around 10−29 cm2 s−1 in LDPE at 40°C. A hypothetical discrete carbon black primary particle with a diameter of 16 nm would have a volume of 2.145 nm3, which is 900 times larger than that of Tinuvin 770. A hypothetical 100 nm spherical carbon black aggregate would have a volume of 5.2 105 nm3, which is 200 thousand times larger than that of Tinuvin 770. In consideration of the exponential relationship between migration rate and particle size in the mathematical model, no detectable carbon black migration should be expected.
In a complementary approach, theoretical molecular weights were estimated from nanoparticle volumes and used for modelling the diffusion coefficients (Bott et al. Citation2014). In this case an alternative model was chosen (Piringer Citation2008) which can be mathematically extrapolated to larger molecular weights. For 10 nm particles, the calculated diffusion coefficient was 1 10−35 cm2 s−1 in LDPE at 40°C, corresponding to a theoretical migration below 1 femtogram kg–1 after 10 days. For larger particles, a theoretical migration of less than one particle per kg of simulant in contact with 6 dm2 would be expected.
A completely different approach to estimate migration of nanoparticles was published by Simon et al. (Citation2008). They proposed to address polymers like highly viscous liquids and to derive diffusion coefficients by the Stokes–Einstein equation from viscosity and particle radius. The viscosities had been estimated from that in the molten stage. For the three additives and the three particles (10–100 nm diameter), the diffusion coefficients at 25°C were calculated () with the Stokes–Einstein equation and the viscosities given in the publication of Simon et al. The 10 nm diameter particle corresponds to the 5 nm radius example in Simon et al. The diffusion coefficients of the additives obtained by this approach were compared with that obtained from the AP model in the modelling guide (). The smaller additives Irganox 1076 and Irganox 1010 are underestimated by the Simon et al. approach both in LDPE and PS. Furthermore, the dependency from the size is very small related to that from the validated modelling guide approach. The diffusion coefficient in the Stokes–Einstein equation is proportional to the inverse radius of the substance or particle whereas in the AP model (as well as in the above-mentioned alternative model from Piringer) there is an exponential dependency of the diffusion coefficient from the molecular weight as measure for the volume of the diffusing species. From Irganox 1076 to Tinuvin 770, the diffusion coefficient according Simon et al. decreases by factor 1.6, whereas in the AP model a decrease by a factor of nearly ten thousand is obtained. This tremendous difference between the two models can be attributed to the assumption of a viscous liquid in case of Simon et al. or a solid polymer respectively. In principle, the dependency from the size must be smaller under the assumption of a liquid where only its viscosity restricts the movement of dissolved or dispersed substances. In the solid state of a polymer the diffusing species are facing a much higher resistance from the polymer chains and network which act as a migration barrier. Thus for the large particles the diffusion coefficients are highly overestimated by the Simon et al. approach which appears to be not suitable for realistic estimation of the migration of nanoparticles therefore, especially for those which are used as fillers in concentrations in the percentage range. The diffusion coefficient for a 100 nm diameter particle in LDPE (DP = 6.6 10−16 cm2 s−1) would correspond to a migration of 0.74 mg kg−1 from our test plates with 5.0% carbon black at 25°C after 10 days, that of a 200 nm particle (DP = 3.3 10−16 cm2 s−1) to 0.53 mg kg−1. Under the stronger test condition at 60°C, no migration was detectable and this suggests that the approach of Simon et al. does not reflect reality. Furthermore, both modelling approaches which were derived from polymer properties in the solid state come to the conclusion that the carbon black particles are completely immobilised and migration will always be smaller than the detection limit of any sensitive method.
Table 6. Comparison of diffusion coefficients at 25°C obtained according to Simon et al. (Citation2008) with that according to the modelling guideline (Simoneau Citation2010).
Conclusions
Both experimental results and theoretical considerations lead to the conclusion that carbon black particles, once incorporated into LDPE or PS, are not migrating out of the matrix into food. The chosen carbon black grades can be seen as representative for all other grades of carbon black used in food contact plastics. The size of the primary particles (16 nm) and that of the aggregates (mean radius of gyration 65 nm) is in the lower range of the specification given in European Union Plastics Regulation No. 10/2011. LDPE is generally recognised as the plastic material with the highest diffusivity. Both, the chosen carbon black grades and LDPE as test polymer, can be considered as worst case scenarios for such migration testing, therefore. Thus, this conclusion can be generalised and extended to other food contact plastics in which carbon black is completely embedded. As a consequence consumers will not be exposed to carbon black particles incorporated in plastics when using those materials or articles for food packaging or as kitchen utensils.
Funding
The authors thank the International Carbon Black Association (ICBA) for the financial support of this study.
Acknowledgement
Technical and analytical support and assistance, in particular related to AF4 analyses, by Gerd Wolz, Fraunhofer IVV, is greatly appreciated.
References
- Andersson M, Wittgren B, Wahlund K-G. 2003. Accuracy in multiangle light scattering measurements for molar mass and radius estimations. Model calculations and experiments. Anal Chem. 75:4279–4291.
- [ASTM] American Society for Testing and Materials. 2013. Standard Terminology Relating to Carbon Black. In: ASTM Standard D3053-13a. p. 4.
- Begley T, Castle L, Feigenbaum A, Franz R, Hinrichs K, Lickly T, Mercea P, Milana M, O’Brien A, Rebre S, et al. 2005. Evaluation of migration models that might be used in support of regulations for food-contact plastics. Food Addit Contam: Part A. 22:73–90.
- Bott J, Störmer A, Franz R. 2014. A comprehensive study into the migration potential of nano silver particles from food contact polyolefins. In: Benvenuto MA, Ahuja S, Duncan TV, Noonan GO, Roberts-Kirchhoff ES, editors. Chemistry of food, food supplements, and food contact materials: from production to plate. Washington (DC): American Chemical Society, ACS symposium series. 1159:51–70
- Brar SK, Verma M. 2011. Measurement of nanoparticles by light-scattering techniques. TrAC Trends Anal Chem. 30:4–17.
- [EC] European Commission 2011a. COMMISSION RECOMMENDATION of 18 October 2011 on the definition of nanomaterial (2011/696/EU). Off J Eur Union. 275:38–40.
- [EC] European Commission. 2011b. COMMISSION REGULATION (EU) No 10/2011 of 14 January 2011 on plastic materials and articles intended to come into contact with food. Off J Eur Union. L 12/1.
- [EFSA] European Food Safety Authority. 2011. Scientific opinion – guidance on the risk assessment of the application of nanoscience and nanotechnologies in the food and feed chain. EFSA Journal. 9:2140.
- Environment Canada, Health Canada. 2011. Carbon Black – Draft Screening Assessment for the Challenge.
- Giddings JC. 1993. Field-flow fractionation: analysis of macromolecular, colloidal, and particulate materials. Science. 260:1456–1465.
- Gray CA, Muranko H. 2006. Studies of robustness of industrial aciniform aggregates and agglomerates–carbon black and amorphous silicas: a review amplified by new data. J Occup Environ Med. 48:1279–1290.
- Hunt G, Lynch I, Cassee F, Handy R, Fernandes T, Berges M, Kuhlbusch T, Dusinska M, Riediker M. 2013. Towards a consensus view on understanding nanomaterials hazards and managing exposure: knowledge gaps and recommendations. Materials. 6:1090–1117.
- [ICBA] International Carbon Black Association. n.d. Factsheet: Particle properties of Carbon Black. Journal. [downloaded 27.7.2014]
- [ICBA] International Carbon Black Association. 2004. Carbon Black User’s Guide – Safety, Health, & Environmental Information. ICB Association.
- [ISO] International Organization for Standardization. 2010. Nanotechnologies – Vocabulary - Part 1: Core terms (ISO/TS 80004-1:2010). Technical specification of the Technical Committee ISO/TC 229 ‘Nanotechnologies’.
- Mercea P, Piringer O. 2008. Possibilities and limitations of migration modeling. In: Piringer OG, Baner AL, editors. Plastic packaging: interactions with food and pharmaceuticals. Weinheim: Wiley-VCH; p. 499–522.
- Messaud FA, Sanderson RD, Runyon JR, Otte T, Pasch H, Williams SKR. 2009. An overview on field-flow fractionation techniques and their applications in the separation and characterization of polymers. Prog Polymer Sci. 34:351–368.
- Piringer O. 2008. A uniform model for prediction of diffusion coefficients with emphasis on plastic materials. In: Piringer OG, Baner AL, editors. Plastic packaging – interactions with food and pharmaceuticals. 2nd ed. Weinheim: WILEY-VCH Verlag GmbH & Co. KGaA; p. 163–194.
- Podzimek S. 2011. Light scattering, size exclusion chromatography and asymmetric flow field flow fractionation: powerful tools for the characterization of polymers, proteins and nanoparticles. Hoboken (NJ): John Wiley & Sons.
- Reynier A, Dole P, Feigenbaum A. 1999. Prediction of worst case migration: presentation of a rigorous methodology. Food Addit Contam. 16:137–152.
- Savolainen K, Pylkkänen L, Norppa H, Falck G, Lindberg H, Tuomi T, Vippola M, Alenius H, Hämeri K, Koivisto J, et al. 2010. Nanotechnologies, engineered nanomaterials and occupational health and safety – a review. Saf Sci. 48:957–963.
- [SCENIHR] Scientific Committee on Emerging and Newly Identified Health Risks. 2009. Risk Assessment of Products of Nanotechnologies.
- Schmidt B, Katiyar V, Plackett D, Larsen EH, Gerds N, Koch CB, Petersen JH. 2011. Migration of nanosized layered double hydroxide platelets from polylactide nanocomposite films. Food Addit Contam: Part A. 28:956–966.
- Schmidt B, Petersen JH, Bender Koch C, Plackett D, Johansen NR, Katiyar V, Larsen EH. 2009. Combining asymmetrical flow field-flow fractionation with light-scattering and inductively coupled plasma mass spectrometric detection for characterization of nanoclay used in biopolymer nanocomposites. Food Addit Contam: Part A. 26:1619–1627.
- Simon P, Chaudhry Q, Bakos D. 2008. Migration of engineered nanoparticles from polymer packaging to food – a physicochemical view. J Food Nutr Res. 47:105–113.
- Simoneau C. 2010. Applicability of generally recognised diffusion models for the estimation of specific migration in support of EU Directive 2002/72/EC. JRC scientific and technical reports: EUR 24514 EN.
- Software MIGRATEST©Lite 2001 (Version April 2003), FABES ForschungsGmbH, München. [2003].
- Voll M, Kleinschmit P. 2010. Carbon, 6. Carbon black. In: Ullmann’s encyclopedia of industrial chemistry. Weinheim: Wiley-VCH Verlag.
- Wang M-J, Gray CA, Reznek SR, Mahmud K, Kutsovsky Y. 2003. Carbon black. In: Mark HF, editor. Encyclopedia of polymer science and technology. Hoboken, NJ: John Wiley and Sons, Inc; p. 52–91.
- Watson AY, Valberg PA. 2001. Carbon black and soot: two different substances. AIHAJ Integr Am Ind Hyg Assoc. 62:218–228.
- Welle F, Franz R. 2012. Diffusion coefficients and activation energies of diffusion of low molecular weight migrants in Poly(ethylene terephthalate) bottles. Polymer Test. 31:93–101.