
ABSTRACT
This study aimed to obtain insights into the presence of cadmium, lead, mercury and arsenic in feed materials and feed over time for the purpose of guiding national monitoring. Data from the Dutch feed monitoring programme and from representatives of the feed industry during the period 2007–13 were used. Data covered a variety of feed materials and compound feeds in the Netherlands. Trends in the percentage of samples that exceeded the maximum limit (ML) set by the European Commission, and trends in average, median and 90th percentile concentrations of each of these elements were investigated. Based on the results, monitoring should focus on feed material of mineral origin, feed material of marine origin, especially fish meal, seaweed and algae, as well as feed additives belonging to the functional groups of (1) trace elements (notably cupric sulphate, zinc oxide and manganese oxide for arsenic) and (2) binders and anti-caking agents. Mycotoxin binders are a new group of feed additives that also need attention. For complementary feed it is important to make a proper distinction between mineral and non-mineral feed (lower ML). Forage crops in general do not need high priority in monitoring programmes, although for arsenic grass meal still needs attention.
Introduction
Animal feed and feed materials can be contaminated with undesirable substances, which may originate from the environment and/or the production process. When production animals consume such contaminated feed, the contaminants may transfer to food of animal origin, such as liver, meat and milk. In the European Union (and most of the rest of the world) legislation is in place to manage the feed and feed material contamination. Official limits and guidelines indicate safe levels of each contaminant, often per feed (material) group. Also procedures for control of the presence of the contaminant are prescribed, e.g., the number of samples to be taken for which contaminants. Within the European Union (EU) Regulation (EC) No. 882/2004 gives rules for the official controls that have to be performed to ensure the verification of compliance with feed and food law, animal health and animal welfare rules (EC Citation2004). In accordance with this regulation each EU member state draws up a multi-annual control programme for feed and feed materials. The programme indicates feed materials and contaminant combinations to be checked as well as the frequency with which the controls will be implemented. Next to European or national monitoring of feed and feed materials, feed-producing companies have their own control programmes for contaminants. To establish such control programmes, on a risk-based approach it is necessary to have insight into the presence and level of the contaminants in each of the feed materials and animal feeds.
One group of relevant contaminants in feed materials and animals feeds are certain heavy metals and elements. The heavy metals mercury, cadmium and lead and the metalloid arsenic are of concern because they are readily transferred through food chains, have toxic properties and are not known to serve any essential biological function (NRC Citation2005; Lopez-Alonso, Citation2012). Industrial and agricultural development has been largely responsible for pollution of the environment, although some contamination is also derived from natural geological sources (Rajaganapathy et al. Citation2011; Lopez-Alonso, Citation2012). Within the European Commission (EC), the maximum presence of cadmium, lead, mercury and arsenic in feed and feed materials have been regulated in Directive 2002/32/EC, last amended for heavy metals by Regulation (EU) Citation2015/186.
The aim of the current study was to gain insight into the contamination with cadmium, lead, mercury and arsenic of feed materials and compound feed used in the Netherlands. The emphasis is on compliance with the maximum limits (MLs) set in the EU, on background concentrations and on possible trends over time. The results can be used to define priorities for national monitoring plans.
Materials and methods
Data collection
Data from the National Feed monitoring programme (NP) of the Netherlands Food and Consumer Product Safety Authority (NVWA) and monitoring data from representatives from the Dutch feed industry (IND) were provided for this study. Data cover monitoring results, i.e., the presence of the four elements in feed materials and feed used in the Netherlands, between 2007 and 2013. Data do not contain results from targeted samples taken as a follow-up on incidents. However, the monitoring programmes do have a risk-based design. In most samples all four elements were analysed at the same time. The analysis of mercury, cadmium, arsenic and lead concentrations in the samples was performed as described in Adamse et al. (Citation2009) using validated and accredited methods (). Data from RASFF were used for comparison. These data, covering the same time period, were subtracted from the RASFF portal with search criteria product type ‘feed’ and hazard category ‘heavy metals’ (RASFF Citation2014). The RASFF data include all notifications from the EU. Usually, the feed materials that are notified in RASFF are also used in the Netherlands. This means that the warnings from other European countries are relevant for the Dutch situation as well.
Table 1. Detection methods used. For IND samples LOQs vary between matrices and laboratories that performed the analyses.
Data analysis
Data (especially product names) were harmonised to enable combining them into one dataset. The products were grouped according to feed groups defined in Regulation (EC) No. 767/2009 (EC Citation2009) and according to the groups used for defining the MLs for cadmium, mercury, lead and arsenic in animal feed and feed materials according to Directive 2002/32/EC (EC Citation2002), last amended for heavy metals by Regulation (EU) Citation2015/186 (EU Citation2015). This enables grouping products with the same ML. Where applicable, subgroups were used to highlight specific feed materials that differ from the rest of the group.
Because the data originate from different suppliers the LOQs varied, but in general the LOQs for mercury, cadmium, lead and arsenic were 0.01, 0.02, 0.1 and 0.1 mg kg–1, respectively. Values reported as < LOQ were replaced by zero for statistical analysis. Apparent outliers, i.e., samples with an exceptionally high concentration, were examined individually and excluded from the dataset when they appeared to be the result of targeted sampling (Adamse Citation2014).
Descriptive analysis was used to calculate averages (avg), medians (P50), 90th (P90) percentiles and percentage of samples exceeding the ML per feed group (% > ML). The Pearson correlation coefficient (MS Excel®) was used to evaluate the significance of potential trends in the presence of the element over the time period considered. Trends with R2 values exceeding 0.30 were considered significant. In some trend analyses (Van der Fels-Klerx et al. Citation2012) 20 observations per year were considered a minimum, but in the current analysis every amount of measurements per year is taken into account. However, sometimes the number of samples was too low to consider any trend to be significant. This will be addressed where applicable.
Interpreting the results
The monitoring results were studied per contaminant and feed material product (sub)group. Each contaminant/product (sub)group combination was studied in detail with separate trend analyses using the average, median, P90 or % > ML. The result of those analyses are summarised in separate tables for each contaminant. Results are evaluated and colours in the trend tables are added to indicate the level of priority this feed of feed material should have in the national monitoring plan. The priority was considered high (I) when two or more of the following criteria are fulfilled: average concentration higher than 20% of ML, more than 3% of the samples exceeded the ML, a significant increase of the average concentration between 2007 and 2013, and/or more than five RASFF notifications. The priority was also considered high when 10% or more of the samples exceeded the ML. The priority was considered medium (II) when only one of the criteria was fulfilled. With low priority (III) none of the criteria was fulfilled.
Results and discussion
In general the percentage of samples of all feeds and feed materials that exceed the ML was low for each of cadmium, lead, mercury and arsenic, and did not increase or decrease significantly (–). However, there were some exceptions, which are discussed below.
Table 2. Summary of the evaluation of cadmium in animal feed and feed materials between 2007 and 2013.
Table 3. Summary of the evaluation of in lead in animal feed and feed materials between 2007 and 2013.
Table 4. Summary of the evaluation of in mercury in animal feed and feed materials between 2007 and 2013.
Table 5. Summary of the evaluation of in arsenic in animal feed and feed materials between 2007 and 2013.
Cadmium
Most alerts and notifications on cadmium in RASFF concerned feed additives belonging to the functional group of compounds of trace elements and sea animal-related feed materials. This coincides with the results of the current study. In this study feed materials of marine origin (especially fish meal with an average concentration of 34% of the ML, 2.9% exceeding the ML) was ranked in the high priority class (). Complementary feed (average concentration 41% of the ML), feed materials of vegetable origin (average concentration 7% of the ML, but increasing significantly between 2007 and 2013) and phosphates (average concentration 29% of ML) were considered medium priority. For the majority of the feed categories the priority was considered low, having average concentrations well below (namely < 10% of) the corresponding MLs. Further monitoring for cadmium should focus mainly on feed material of mineral origin (notably phosphates), and fish meal and products containing fish meal. For complementary feed, excluding mineral feeds and pet food, only five samples were taken and so it is not possible to draw conclusions about the importance.
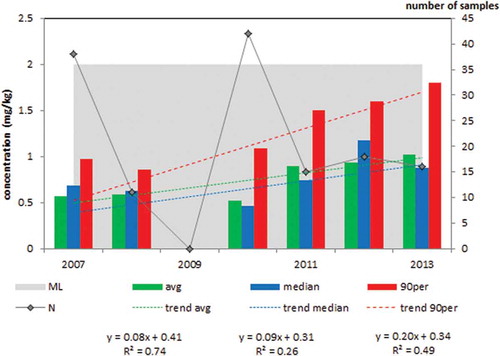
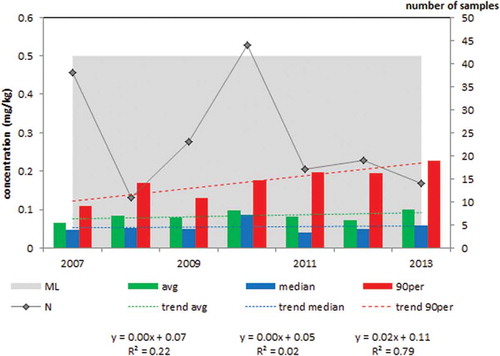
The high-priority group was feed material of marine origin, especially fish meal. The presence of elements like cadmium in the aquatic environment originates from natural (volcanic activity, weathering of bedrocks) or from anthropogenic sources such as mining activities, incineration of waste and agricultural use (Rajaganapathy et al. Citation2011; Amlund et al. Citation2012; López-Alonso Citation2012). Transfer of cadmium to fish is generally low (Amlund et al. Citation2012), but RASFF reported five incidents with cadmium in fish meal and also the current study and previous studies (MIK Citation1985; Adamse et al. Citation2009) show that cadmium in feed materials of marine origin should have a high priority. In the current study both the average and the P90 cadmium concentration increased significantly over the years () and the average concentration is around 34% of the ML. A considerable number of fish meal samples originated from Peru (37 out of 140 in total). Out of the 32 samples with cadmium levels of 1 mg kg–1 or higher, 10 samples were from Peru. This justifies the relatively high number of samples taken from fish meal from this country. However, none of the samples from Peru exceeded the ML of 2 mg kg–1 and no significant trends were present over time. The increase in concentration over time was mainly caused by samples with relatively high cadmium concentrations collected from several European countries in the last few years. However, it is likely that (part of the) samples classified as originating from Germany are actually from Peru since there is a large throughput of fishmeal from Peru in the harbour of Hamburg (personal communication). For insights into the influence of country of origin of the feed material on contaminant levels it is very important that the original country of origin is registered correctly during sampling.
Figure 1. Average, median and 90th percentile concentration of cadmium in fish meal; N = 141; ML = 2 mg kg–1.
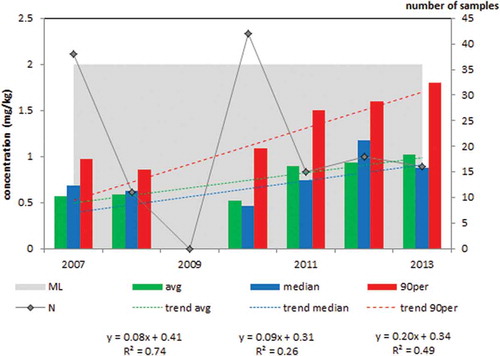
Many feed materials of vegetable origin have been analysed for their cadmium content. Feed materials of plant origin generally have low levels of elements. However, when the plants grow in a strongly contaminated environment (industrial emissions, traffic etc.) the heavy metal concentration in feed materials of plant origin can increase due to either uptake of the plant or by adhering soil particles, which may cause elevated levels in forage (Lopez-Alonso, Citation2012). Cadmium is very widespread in the soil and can be taken up by the plant (EFSA Citation2004b). The cadmium concentration of only one sample exceeded the ML: grass meal, with 2.4 mg kg–1 in 2012. The average, median and P90 cadmium concentration increased significantly between 2007 and 2013 () although the average concentration remains well below the ML (1 mg kg–1). Moreover, it should be noted that the average concentration is quite close to the LOQ and so these upward trends should be considered with some precautions. Important contributors to feed of vegetable origin were grass (including meal), alfalfa, soya bean expeller/extracted. No significant increase or decrease in cadmium concentrations could be observed in those product groups and the average concentration remains well below the ML (1 mg kg–1). Based on the current result it is recommended to include grass meal in the monitoring programme because of elevated levels in part of the samples and one ML exceedance were found recently.
Figure 2. Average, median and 90th percentile concentration of cadmium in feed materials of vegetable origin; N = 668; ML = 1 mg kg–1.
In feed materials of mineral origin, including phosphates, significant quantities of cadmium can be present resulting in elevated levels in mineral supplements and pre-mixtures (Lopez-Alonso, Citation2012; Dai et al. Citation2016). In a previous study (Adamse et al. Citation2009) covering the period 2000–06 the highest percentage of samples with cadmium concentrations exceeding the ML were from complementary feeds, excluding mineral feeds. In the current study no samples of this product group were reported with cadmium concentrations above the ML. After 2006 the product descriptions have improved with a better distinction between complementary feed from mineral origin and other complementary feeds. As a result, only few samples have been taken from that category. The ML for complementary mineral feed (5 mg kg–1) is high compared to the ML of 0.5 mg kg–1 for complementary feeds, excluding mineral feeds and pet feed.
For phosphates no samples exceeded the ML of 10 mg kg–1. However, the average cadmium concentration was 29% of the ML. This justifies continuation of monitoring, also because RASFF reported three incidents regarding phosphates.
Lead
Most alerts and notifications on lead in RASFF concerned complementary mineral feeds (mineral mixes) or zinc oxide. Other studies also reported high lead concentrations in minerals (e.g., Lopez-Alonso, Citation2012; Dai et al. Citation2016). In the current study () the highest percentage of samples with lead concentrations exceeding the ML (of 30 mg kg–1) were from feed additives belonging to the functional groups of binders and anti-caking agents, especially in the subgroup unspecified clay minerals (5.6% of 18 samples). The average lead concentrations of entire group of binders were relatively high (approximately 25% of the ML) and 1.1% of the samples exceeded the ML, although less than before 2007 (Adamse et al. Citation2009). The priority was considered medium for the entire group, but high for the subset of unspecified clay minerals. Since 2012 mycotoxin binders are allowed to be used in animal feed as a new category of feed additives. Until now, no ML has been established in the EU. Those materials often have a clay-like background. Currently they are sometimes (wrongly) classified as complementary feed (ML = 10 mg kg–1) or as mineral mix (ML = 15 mg kg–1). The highest lead concentrations found were around 30 mg kg–1. It is important to monitor those products in the coming years and also to classify them in the appropriate category.
In the products with medium priority the average lead concentration was between 1% and 17% of the ML, but their concentration increased significantly between 2007 and 2013. This concerned complementary mineral feeds, pre-mixtures, fish meal, manganous oxide and ‘other feed additives’. For the other feed categories the priority was considered low, with average concentrations well below (namely < 10% of) the corresponding MLs.
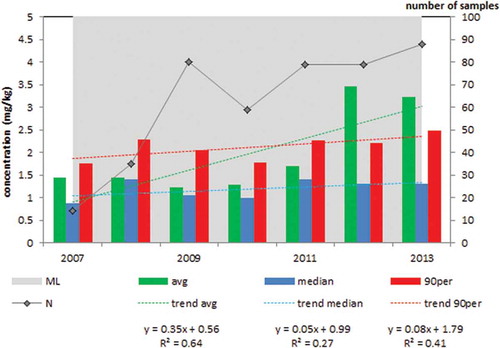
Complementary mineral feeds have a relatively high percentage of samples exceeding the ML (1.4%, six of 434 samples). There was a significant increase in both average and 90th percentile concentrations of lead in complementary mineral feeds (). The average lead concentrations was approximately 14% of the ML. In the largest subgroup, complementary mineral feeds for ruminants the average, median and 90th percentile lead concentrations also increased significantly. The reason for the upward trend for complementary mineral feeds is as yet unexplained.
Figure 3. Average, median and 90th percentile concentration of lead in complementary mineral feeds; N = 434; ML = 15 mg kg–1.
In three other products which ranked as medium priority, pre-mixtures, fish meal () and manganous oxide, the increase of the average concentration was significant. However, no samples exceeded the ML and average concentrations were well below the ML. For fishmeal the average concentration is quite close to the limits of quantification and so this upward trend should be considered with some precautions.
Figure 4. Average, median and 90th percentile concentration of lead in fish meal: N = 145; ML = 10 mg kg–1.
For ‘other feed additives’ there is no ML. In most samples the concentration was below 3 mg kg–1 (14 samples) or below the LOQ (89 samples), except for Myco-AD (a feed additive to bind mycotoxins; 2011 26 mg kg–1), choline chloride (2011, 33 mg kg–1) and calcium propionate (2013, 34 mg kg–1). The upward trend in the average concentration is probably caused by these samples that were taken in the second half of the time period studied.
The highest ML for feed materials was for forage (30 mg kg–1). As with cadmium, contamination with lead, especially in forage crops, is often caused by contaminated soil or dust that is deposited on plants (EFSA Citation2004a). However, in the current study no forage samples have been reported with lead concentrations exceeding the ML and the average concentration was only 2% of the ML. The average lead concentration in forage decreased significantly for the period 2000–06 (Adamse et al. Citation2009). The decrease is in line with the decreased use of leaded fuel. With the introduction of unleaded fuel in the mid-1980s, lead has considerably decreased in the environment all over Europe (EFSA Citation2013; Alldrick Citation2014). In the current study, the number of samples taken from forage products decreased. Since the average and individual concentrations were well below the ML this seems justified.
Mercury
The origin of mercury in feeds and feed materials can be natural (volcanic activity) as well as from industrial pollution. In this study, only four samples out of in total 1497 samples exceeded the ML, two in feed material and two in compound feed (). For another 906 samples (feed additives and pre-mixtures) no ML was set for mercury. No feeds and feed materials where ranked at high priority and only one product (pre-mixtures) was ranked as medium (). For pre-mixtures there was no ML, but the concentration increased significantly over the years. Of the 441 samples of pre-mixtures that were analysed, three samples had a mercury concentration between 0.2 and 0.9 mg kg–1, much lower than the alert reported by RASFF (17.8 mg kg–1). All others samples had a concentration below 0.1 mg kg–1 (the lowest ML for mercury in feed and feed materials). Based on the current results, the contribution of pre-mixtures to the exposure of animals to mercury is expected to be not significant.
There were different MLs for feed materials: 0.5 mg kg–1 for fish, other aquatic animals and products derived thereof, 0.3 mg kg–1 for calcium carbonate and calcium and magnesium carbonate, and 0.1 mg kg–1 for the other feed materials. For fish, other aquatic animals and products derived thereof no samples exceeded the ML. In a similar study covering 2000–06 (Adamse et al. Citation2009) a decrease of the average mercury concentration was observed after 2003. Between 2007 and 2013 this decrease was not significant anymore.
In the subcategory fish meal the 90th percentile concentration increased significantly between 2007 and 2013 () indicating an increase of the higher concentrations to around 50% of the ML. When the country of origin was taken into account, the highest concentrations were reported for fish meal from Peru, comparable with the 2009 report (Adamse et al. Citation2009). The average concentration in fish meal from Peru increased almost significantly between 2007 and 2013 (R2 = 0.29). In fish meal from Denmark and Norway the average concentration decreased but in fish meal from the EU (specific countries not specified) the average concentration increased significantly (R2 = 0.41). The latter was the reason for the (not significant) increase in average concentration of the total fish meal group. Monitoring fish meal and products containing fish meal, e.g. fish feed, will still be necessary, especially since mercury accumulates in fish tissues. EFSA reported that 8.2% of complete feed for fish (often containing fish) in their study (280 samples between 2003 and 2006) contained mercury levels above the ML (EFSA Citation2008).
Figure 5. Average, median and 90th percentile concentration of mercury in fish meal. N = 166; ML = 0.5 mg kg–1.
One sample of pet food (without target animal specified) from 2013 exceeded the ML with a mercury concentration of 0.46 mg ml–1. In general, only a few samples of pet food were collected per year. However, in 2013 50 samples were taken (out of 56 in total). In 2012 RASFF reported four incidents with mercury in cat feed from Thailand, also referred to in their annual report (RASFF Citation2012). This, in combination with notifications on high arsenic concentrations in the same product, probably triggered the large number of samples collected in the course of the national monitoring programme in the Netherlands in 2013. Only three samples of cat feed (out of 32) contained mercury levels above the LOQ, none of them exceeded the ML of 0.3 mg ml–1. Due to the low number of samples it was not possible to perform a trend analysis.
Arsenic
Arsenic in feed and feed material originates from natural geological source, from pollution by industrial activities or specific feed additives (EFSA Citation2005). There are many different MLs for arsenic in the various feed materials (). The highest ML is for zinc oxide (100 mg kg–1) and the lowest (2 mg kg–1) is for complete feed and feed materials (with some exceptions). Between 2007 and 2013 in total 14 samples (out of 2701 with an ML) exceeded the ML. For another 828 samples (feed additives and pre-mixtures) no ML for arsenic was applicable.
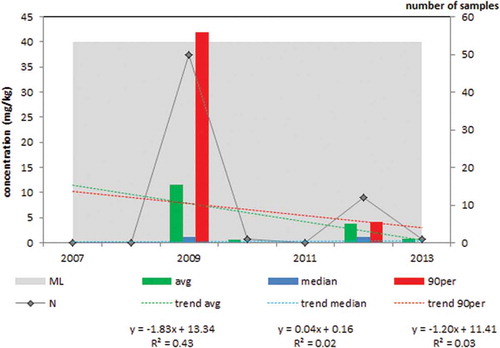
Two product subcategories were ranked with a high priority. One is seaweed meal and feed materials derived from seaweed (average concentration 24% of the ML, 11% exceeding the ML; ). Seaweeds tend to accumulate arsenic. Especially the brown algae S. fusiforme (Harvey) Setchell (synonym Hizikia fusiformis (Harvey) Okamura) is known for its high concentration of arsenic (Makkar et al. Citation2016). Since most of the samples of seaweed meal (50 out of 64) were taken in 2009 no trend could be determined. The other high priority category is the feed additives cupric sulphate pentahydrate, cupric carbonate, di copper chloride trihydroxide and ferrous carbonate (only cupric sulphate in this study, average concentration 45% of the ML, 5.4% exceeding the ML). Cupric sulphate is produced from industrial by-products, with a high risk of having impurities such as arsenic (Wang Citation2014). For cupric sulphate no significant trend could be detected.
Figure 6. Average, median and 90th percentile concentration of arsenic in seaweed meal and feed materials derived from seaweed; 2007–13, N = 64; ML = 40 mg kg–1.
Several product categories were ranked as medium priority (). Some because there were five or more RASFF notifications regarding this product group, namely feed materials with an ML of 2 mg kg–1 (six notifications) and complete feed for pet animal (nine notifications). Others because the average arsenic concentration was higher than 20% of the ML, namely phosphates and calcareous marine algae (average concentration 21% of the ML) and zinc oxide (32% of ML). A third group showed a significant increase of the average arsenic concentration between 2007 and 2013, namely mineral feed and binders (Fig. 3.7). For binders (i.e., feed additives belonging to the functional groups of binders and anti-caking agents) there is no ML.
In feed materials with an ML of 2 mg kg–1 the highest concentrations reported were 1.6 mg kg–1 in vegetable feeding stuff (2009) and 1.4 mg kg–1 in green maize (2007). The average concentration was low, 0.1 mg kg–1, i.e., 3% of the ML. RASFF reported notifications about dried apples, sugar beet pulp, sunflower seed meal and yeast. This category appears to have some incidents but does not show to be a structural problem.
For the category samples of complete feed for pet animals it was not always clear if the feed contained fish, sea animals or seaweed. The ML for pet feed without fish, sea animals or seaweed is 2 mg kg–1 whereas the ML for pet feed with fish, sea animals or seaweed is 10 mg kg–1. RASFF reported nine notifications regarding arsenic in pet feed, most of them having concentrations below 10 mg kg–1. As with the pet food samples containing mercury most notifications involve pet food from Thailand in 2011 and 2012, and three were related to fish (RASFF Citation2011, Citation2012). Only five samples in the current dataset contained arsenic concentrations above the LOQ, and four of them were below 2 mg kg–1. One sample from 2013 contained 4.7 mg kg–1 and thus would exceed the ML of 2 mg kg–1 (the product description did not indicate the presence of fish or seaweed). It was not possible to determine trends since most samples were from one year.
According to a study performed by EFSA in 2005 using data from several member states the highest levels of arsenic are found in fishmeal and fish oils. This is reflected in the levels of arsenic in compound feeds for fish, for which these are major feed ingredients (EFSA Citation2005). In the current study, fish meal does not seem to be a problem regarding arsenic with average concentrations of 12% of the ML and only one sample exceeding the ML. For fish feed, no samples have been tested for the presence of arsenic in this period.
In the feed material category phosphates and calcareous marine algae the average concentration was 21% of the ML (of 10 mg kg–1). The average and median arsenic concentration increased significantly between 2009 and 2013. For a large part this was caused by monocalcium phosphate (highest concentration was 6.41 mg kg–1 in 2011) but the three samples of calcareous marine algae with concentrations around 4 mg kg–1 also contributed to this increase.
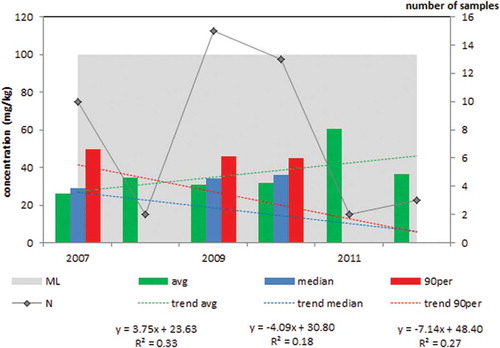
No samples of zinc oxide (Figure 7) or manganese oxide exceeded the ML of 100 mg kg–1, but the average concentration was relatively high (32% of the ML). The highest value was 74.4 mg kg–1 in zinc oxide. The number of samples decreased to zero in 2013 therefore no trends could be determined between 2007 and 2013.
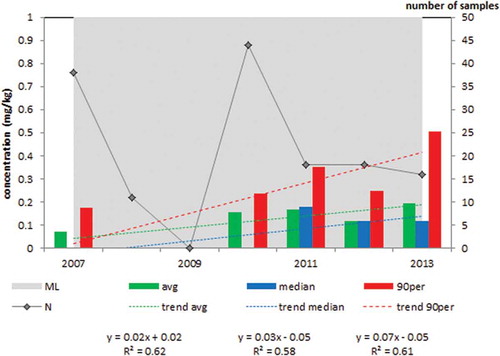
The average arsenic concentration in complementary feed was rather low (9% of the ML) and no samples exceeded the ML (12 mg kg–1). In mineral feed no samples exceeded the ML either. A few samples (2.5%) contained concentrations of more than 50% of the ML. This corresponds to the statement of EFSA that mineral supplements are not generally considered to be a major source of arsenic (EFSA Citation2005). However, the average, median and 90th percentile concentration of arsenic in mineral feed increased significantly ().
Figure 8. Average, median and 90th percentile concentration of arsenic in mineral feed; 2007–2013, N = 438; ML = 12 mg kg–1.
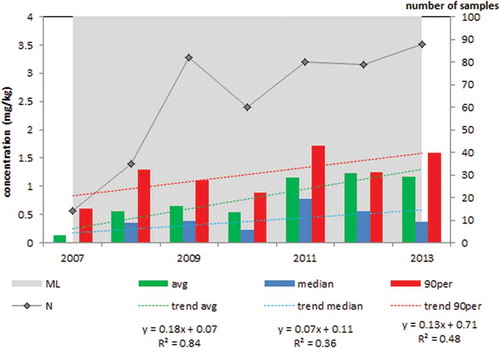
Figure 7. Average, median and 90th percentile concentration of arsenic in zinc oxide; 2007–12, N = 77; ML = 100 mg kg–1.
There was no ML for the feed additives belonging to the functional group of binders and anti-caking agents. The highest concentration reported was 31 mg/mg in zeolite. Both the average and the median concentration increased significantly. This increase was mainly caused by sepiolite (116 of the 209 samples) with an average concentration of 6 mg kg–1. Analysis of the subset sepiolite also showed a significant increase (R2 = 0.65) of the average arsenic concentration over the time period considered.
Usefulness of monitoring data for trend analysis
Knowledge about contaminant levels in feed is often gathered in controlled studies where prearranged amounts of samples are taken from more or less controlled environments during a limited period (e.g., Nicholson et al. Citation1999, Citation2003; Li et al. Citation2005; Granados-Chinchilla et al. Citation2015; Dai et al. Citation2016). This approach ensures that statistically relevant amounts of samples are taken and enables researchers to study trends over time of contaminant levels in certain feeds or feed from certain producers. The current study shows that monitoring data, spanning a long period and multiple sources of data, can be used to obtain insight into the levels and trends of heavy metals in feed and feed materials for the purpose of setting monitoring priorities. Due to the variation in the number of samples collected per year it is important to always pay attention to the number of samples before determining whether a trend really is significant, even when the statistical test indicates that it is. It is important to harmonise the names of the products sampled by different parties in order to classify them properly. The uncertainty whether a feed is a mineral feed or not is an important example of this. Animal feed containing fish or seaweed is another example. Finally, for imported feed materials that contain elevated levels of heavy metals, e.g., fish meal, it is important that the country of origin is known.
Conclusions
Based on the results, monitoring for cadmium, lead, mercury and arsenic should focus on feed material of mineral origin, feed material of marine origin, especially fish meal, seaweed and algae as well as feed additives belonging to the functional groups of (1) trace elements (notably cupric sulphate, zinc oxide and manganese oxide for arsenic) and (2) binders and anti-caking agents. Mycotoxin binders are a new group of feed additives that also need attention. For complementary feed it is important to make a proper distinction between mineral and non-mineral feed because the ML in the latter group is usually lower. In seaweed/algae products a relatively large number of samples contained arsenic concentrations that exceeded the ML. Forage crops in general do not need high priority in monitoring programmes, although for arsenic grass meal still needs attention.
Acknowledgements
The authors thank the Dutch Food and Consumer Product Safety Authority (NVWA), Productschap Diervoeders (PDV) and SecureFeed for the use of their data; and Harry van Egmond and Martijn van der Lee from RIKILT Wageningen University & Research for technical information.
Disclosure statement
No potential conflict of interest was reported by the authors.
Additional information
Funding
References
- Adamse P. 2014. Trendanalyse van historische gegevens. Handleiding voor het gebruik van monitoringsgegevens (in Dutch). RIKILT report 2014.001. Wageningen University & Research. Available from: http://edepot.wur.nl/321270
- Adamse P, Driessen JJM, de Jong J, van Polanen A, van Egmond HJ, Jongbloed AW. 2009. Trendanalyse van gehalten aan kwik, cadmium en lood in diervoeders en diervoedergrondstoffen (in Dutch). RIKILT Report 2009.019. Wageningen University & Research. Available from: http://edepot.wur.nl/132982
- Alldrick AJ. 2014. Chemical safety of cereal-based foods: risk management considerations. Qual Assur Saf Crops Foods. 6:3–14.
- Amlund H, Berntssen MHG, Lunestad BT, Lundebye AK. 2012. Aquaculture feed contamination by persistent organic pollutants, heavy metals, additives and drug residues. In: Fink-Gremmels J, editor. Animal feed contamination, effects on livestock and food safety. Cambridge: Woodhead Publishing Series in Food Science, Technology and Nutrition: Number 215; p. 205–229.
- Dai SY, Jones B, Lee K-M, Li W, Post L, Herrman TJ. 2016. Heavy metal contamination of animal feed in texas. J Regul Sci. 01:21–32.
- EC. 2002. Directive 2002/32/EC of the European Parliament and of the Council of 7 May 2002 on undesirable substances in animal feed. Off J Eur Union. 140/10.
- EC. 2004. Regulation (EC) No. 882/2004 on official controls performed to ensure the verification of compliance with feed and food law, animal health and animal welfare rules. Off J Eur Union. 165/2.
- EC. 2009. Regulation (EC) No. 767/2009 of the European Parliament and of the Council of 13 July 2009 on the placing on the market and use of feed, amending European Parliament and Council Regulation (EC) No. 1831/2003 and repealing Council Directive 79/373/EEC, Commission Directive 80/511/EEC, Council Directives 82/471/EEC, 83/228/EEC, 93/74/EEC, 93/113/EC and 96/25/EC and commission decision 2004/217/EC. Off J Eur Union. 229/1.
- EFSA. 2004a. Opinion of the scientific panel on contaminants in the food chain on a request from the Commission related to lead as undesirable substance in animal feed. EFSA J. 71:1-20.
- EFSA. 2004b. Opinion of the Scientific Panel on Contaminants in the Food Chain on a request from the Commission related to cadmium as undesirable substance in animal feed. EFSA J. 72:1-24.
- EFSA. 2005. Opinion of the scientific panel on contaminants in the food chain on a request from the Commission related to arsenic as undesirable substance in animal feed. EFSA J. 180:1–35.
- EFSA. 2008. Scientific opinion of the panel on contaminants in the food chain. Mercury as undesirable substance in animal feed. EFSA J. 654:1-76.
- EFSA. 2013. Scientific opinion of the panel on contaminants in the food chain. Lead in food. EFSA J 2010. 8:1570. (published on 22 March 2013, replaces version 2010)
- EU. 2015. Commission Regulation (EU) 2015/186 of 6 February 2015 amending Annex I to Directive 2002/32/EC of the European Parliament and of the Council as regards maximum levels for arsenic, fluorine, lead, mercury, endosulfan and Ambrosia seeds. Off J Eur Union. 31/11.
- Granados-Chinchilla F, Prado Mena S, Mata Arias L. 2015. Inorganic contaminants and composition analysis of commercial feed grade mineral compounds available in Costa Rica. Int J Food Contam. 2:8.
- Li Y, McCrory DF, Powell JM, Saam H, Jackson-Smith D. 2005. A survey of selected heavy metal concentrations in wisconsin dairy feeds. J Dairy Sci. 88:2911–2922.
- López-Alonso M. 2012. Animal feed contamination by toxic metals. In: Fink-Gremmels J, editor. Animal feed contamination, effects on livestock and food safety. Cambridge: Woodhead Publishing Series in Food Science, Technology and Nutrition: Number 215; p. 183–204.
- Makkar HPS, Tran G, Heuzé V, Giger-Reverdin S, Lessire M, Lebas F, Ankers P. 2016. Seaweeds for livestock diets: A review. Anim Feed Sci Technol. 212:1–17.
- MIK. 1985. De gehalten aan enkele spoorelementen in mengvoedergrondstoffen en voordroogkuilen en de gehalten aan enkele mineralen en spoorelementen in mengvoeders. Werkgroep mineralen in krachtvoer in relatie tot bemesting en milieu. Den Haag: NRLO-TNO; p. 48.
- Nicholson FA, Chambers BJ, Williams JR, Unwin RJ. 1999. Heavy metal contents of livestock feeds and animal manures in England and Wales. Bioresour Technol. 70:23–31.
- Nicholson FA, Smith SR, Alloway BJ, Carlton-Smith C, Chambers BJ. 2003. An inventory of heavy metals inputs to agricultural soils in England and Wales. Sci Total Environ. 311:205–219.
- NRC. 2005. Mineral tolerance of animals. 2nd revised ed. Washington (DC): National Research Council of the national academies, The National Academies Press.
- Rajaganapathy V, Xavier F, Sreekumar D, Mandal PK. 2011. Heavy metal contamination in soil water and fodder and their presence in livestock and products: a review. J Environ Sci Technol. 4:234–249.
- RASFF. 2011. Rapid Alert System for Food and Feed 2011 Annual Report. [ cited 2016 Aug 30]. Available from: http://ec.europa.eu/food/safety/rasff/docs/rasff_annual_report_2011_en.pdf
- RASFF 2012. Rapid Alert System for Food and Feed 2012 Annual Report. [ cited 2016 Aug 30]. Available from: http://ec.europa.eu/food/safety/rasff/docs/rasff_annual_report_2012_en.pdf
- RASFF. 2014. [ cited 2014 Oct 17]. Available from: https://webgate.ec.europa.eu/rasff-window/portal/
- Van der Fels-Klerx HJ, Klemsdal S, Hietaniemi V, Lindblad M, Ioannou-Kakouri E, Van Asselt ED. 2012. Mycotoxin contamination of cereal grain commodities in relation to climate in North West Europe. Food Addit Contam Part A. 29:10, 1581–1592.
- Wang P, Zhang Q, Lan Y, Xu S, Gao R, Li G, Zhang H, Shang H, Ren D, Zhu C, Li Y, Li XJiang G. 2014. Dioxins contamination in the feed additive (feed grade cupric sulfate) tied to chlorine industry. Sci Rep. 4:5975. doi:10.1038/srep05975