
ABSTRACT
Feed additives need to be authorised to be placed on the market according to Regulation (EU) No. 1831/2003. Next to laying down the procedural requirements, the regulation creates the European Union Reference Laboratory for Feed Additives (EURL-FA) and requires that applicants send samples to the EURL-FA. Once authorised, the characteristics of the marketed feed additives should correspond to those deposited in the sample bank of the EURL-FA. For this purpose, the submitted samples were subjected to near-infrared (NIR) and Raman spectroscopy for spectral characterisation. These techniques have the valuable potential of characterising the feed additives in a non-destructive manner without any complicated sample preparation. This paper describes the capability of spectroscopy for a rapid characterisation of products to establish whether specific authorisation criteria are met. This study is based on the analysis of feed additive samples from different categories and functional groups, namely products containing (1) selenium, (2) zinc and manganese, (3) vitamins and (4) essential oils such as oregano and thyme oil. The use of chemometrics turned out to be crucial, especially in cases where the differentiation of spectra by visual inspection was very difficult.
Introduction
Feed additives are an integral part of modern animal husbandry combining high performance in production with animal health and welfare. Such additives may not be put on the market without pre-market authorisation by the European Commission following a procedure established by Regulation (EU) No. 1831/2003 (European Union Citation2003). The authorisation can only be granted after a scientific evaluation demonstrating that the additive has no harmful effects on human and animal health and the environment. While until 2004 feed additives were authorised according to a system established in the early 1970s (European Communities, Citation1970), the new procedure of Regulation (EU) No. 1831/2003 introduced significant modifications such as the separation of risk assessment and risk management and the creation of the European Union Reference Laboratory for Feed Additives (EURL-FA) hosted by the European Commission’s Directorate General Joint Research Centre in Geel (Belgium). The European Food Safety Authority (EFSA) is responsible for conducting the scientific evaluation before authorisation and the European Commission via its Directorate General Health and Food Safety (DG SANTE) is in charge of the authorisation or denial of authorisation. Moreover, the EURL-FA conducts the evaluation of the analytical methods submitted by the applicants in order to assess the suitability of these methods for official control purposes. These methods may, for instance, aim at the determination of the feed additives in feed to check for compliance with legal limits or the identification of this product. More information about the operation of the EURL-FA and its role in the authorisation of feed additives is provided by von Holst et al. (Citation2016).
When preparing the application for the authorisation of a certain feed additive, the applicant also has to send three samples of this additive to the EURL-FA, which is in charge of reception, storage and maintenance of the samples. For the submission of the feed additive samples and to facilitate the proper identification and storage, the EURL-FA had prepared for the applicants various forms and a guideline available on the EURL’s website (see https://ec.europa.eu/jrc/en/eurl/feed-additives/guidance-for-applicants). For instance, considering the different characteristics of the feed additives, the EURL-FA allows for storage of the samples at three different temperature conditions, namely RT (22 ± 5°C), fridge (4°C) and freezer (–18°C) conditions. The shipment of the samples needs to be accompanied by a certificate of analysis and information about the shelf-life of the product. In cases where the shelf-life of the sample has passed, but the feed additive is not yet authorised according to Regulation (EC) No. 1831/2003, the applicant has to send a replacement to the EURL-FA. Currently, the EURL-FA repository contains a total number of about 2100 samples, corresponding to 700 feed additives.
Given the entirely different functions and properties of feed additives, these products are divided into five categories as specified in Regulation (EC) No. 1831/2003 (European Union Citation2003). Four of these categories are further sub-classified into various functional groups. Each feed additive is authorised with a unique identification number, containing the number and letter of the corresponding category and functional group. For instance, fumonisin esterase belongs to category 1 (technological additive) and functional group m (substances for the reduction of the contamination of feed by mycotoxins) and has the number 1m03, where 03 specifies this product. Feed additives are authorised via regulations containing key information, such as (1) the characterisation of the product that are often purity criteria, (2) the conditions of use expressed in terms of maximum content of the feed additive in feed – if applicable, (3) a short description of the method of analysis as recommended by the EURL-FA, and (4) a link to the corresponding opinion of EFSA as scientific basis for the authorisation.
Each opinion of EFSA for a feed additive and the corresponding authorisation by the European Commission is related to a specific product represented by corresponding samples in the EURL’s repository. It is, therefore, crucial that once the product is authorised, feed additives placed under this authorisation on the market keep the characteristics specified in the dossier and reflected by the samples submitted to the EURL-FA, thus ensuring sufficient traceability of this procedure.
Feed additives currently authorised within the European Union are listed in the feed additive register (European Commission Citation2016a) and represent an entirely different group of products including pure substances, preparations and microorganisms. For instance, benzoic acid is authorised as a substance with a minimum purity criterion of 99.9%, whereas the coccidiostat monensin is separately authorised for various preparations which contain, in addition to the active substance, other ingredients such as the carrier (examples for carriers in the case of coccidiostats are calcium carbonate, calcium sulphate, wheat bran and soybean meal). Moreover, these ingredients are specified in the corresponding regulations authorising the preparations. This aspect also has an impact on the samples applicants have to send to the EURL-FA since for feed additives belonging to the group of zootechnical additives, the EURL-FA requires the shipment of samples of the preparation as such and the active substance(s).
While there are new feed additives such as mycotoxin binders that require authorisation according to Regulation (EC) No. 1831/2003 before their use, a significant number of products currently available on the market still benefit from an authorisation granted before 2004, i.e., according to Council Directive 70/524/EEC. However, the industry had to apply for reauthorisation according to the new regulation for all feed additives that should remain on the market by November 2010. Given the high number of feed additives involved, the reauthorisation is not finished yet for all these products. The reauthorisation exercise foresees that once the EFSA has finalised its scientific evaluation on a specific product, the European Commission decides whether the feed additive concerned gains authorisation to be placed on the market or to be withdrawn.
On its own initiative, the EURL-FA subjected all feed additive samples to be analysed by vibrational spectroscopic techniques, namely near infrared (NIR) and Raman spectroscopy because these methods are complementary and have the potential of characterising the feed additives in a non-destructive manner without any complicated sample preparation (Ambrose et al. Citation2016; Banas et al. Citation2017; Graham et al. Citation2012). The evaluation of spectra often requires the use of multivariate statistics as shown in a recent publication, in which the application of mid and NIR microscopy to the analysis of various feed additive containing coccidiostats as the active substance was demonstrated (Omar et al. Citation2015). Another application of this technique in the field of characterisation of feed additives is the analysis of zinc chelate of protein hydrolysates and a corresponding method based on spectroscopy submitted by an applicant when asking for authorisation of this product. Zinc chelate of protein hydrolysates may also contain zinc in a non-chelated form, and the objective of the measurement is to assess the fraction of chelated zinc in the feed additive. The measurement is carried out by mid-infrared spectroscopy coupled with principal component regression (PCR) analysis and is based on the fact that the degree of chelation has a significant effect on the spectra. By measuring calibration samples with known degree of chelation, a PCR model is established from the measured spectra. The obtained PCR model is afterwards applied on new samples to estimate their degree of chelation (EURL Feed Additives Citation2016). Moreover, this spectroscopic method has been included in the regulation (European Commission Citation2016b) authorising this feed additive and is, therefore, compulsory to be used for official control purposes, to enforce a minimum of 85% zinc chelation, which is one of the composition criterion of the feed additive specified in this regulation.
The purpose of this paper is to explore further the capability of spectroscopy for a rapid characterisation of different feed additives in order to establish whether specific authorisation criteria are met. The study is based on the analysis of feed additive samples from different categories and functional groups. The examples include (1) products containing inorganically and organically bound selenium, (2) manganese and zinc sulphate, and (3) ten different vitamins. Each case of these three examples deals with the comparison of spectra of different feed additives, while the fourth case was related to the identification of oregano and thyme oil used as active substances in a single preparation.
Materials and methods
All samples included in this study were feed additives as received from the applicant and taken from the EURL-FA repository. Until now, the spectra of about 1100 samples were measured covering a period of 6 years. These samples include (1) the original feed additives that the applicants sent to the EURL-FA when submitting the application for authorisation and (2) the corresponding replacement samples.
Sample preparation
A huge advantage with the construction of a spectral database using NIR and Raman spectroscopy is the minimal sample preparation involved. For NIR measurements, solid samples were placed in 4 ml glass vials and measured directly. Small portions of liquid samples were poured into glass Petri dishes and measured using a transflectance sampling accessory. Raman spectra were measured by placing small portions of the solid materials into special stainless steel holders and compacting well with a hand press. Liquid samples were measured directly in glass NMR tubes which had been cut down to fit inside the laser compartment of the Raman spectrometer.
The spectra of most samples could be measured with little problem. However, of the 1100 feed additive samples measured, a total of 74 were burned by the Raman laser, hence no spectrum was obtained. From 49 feed additive samples, either no Raman signal could be measured or the corresponding signal-to-noise ratio was very low. Thirty samples gave various problems of insufficient sample size, very high background signal or poor reproducibility, the latter possibly due to sample inhomogeneity. A total of 53 samples gave unacceptable NIR results primarily because of insufficient sample size or too aggressive nature, i.e., orthophosphoric acid, formic acid, sodium hydroxide.
In the case of the solid samples, three subsamples out of each of the three feed additive samples submitted by the applicant were taken. From each subsample, three NIR and three Raman spectra were acquired, i.e., nine Raman spectra and nine NIR spectra were obtained for each feed additive.
In the case of the liquid samples and because of their inherent homogeneity, each of the three samples of the feed additive was measured just once each for NIR and also for Raman spectroscopy.
NIR spectroscopic measurement
NIR analyses were carried out in a Fourier-transform NIR spectrometer from Perkin Elmer (Perkin Elmer Spectrum One NTS instrument, Zaventem, Belgium) coupled to an NIRA-integrating sphere accessory with a high-sensitivity InGaAs detector. The spectra were collected with a scanning range of 1000–2500 nm and a resolution of 16 cm–1; 25 scans were performed for each of the spectra with the data-acquisition Perkin-Elmer Spectrum software (v.5.3.0). Liquid samples were measured using the transflectance accessory. It consists of a special machined aluminium diffuse reflector allowing two passes of the beam through the sample, giving a total path length of 0.5 mm. The Perkin-Elmer Squelcher software minimises background reflectance from the glass Petri dish. Spectra were collected from 4000 to 10,000 cm–1, with a resolution of 16 cm–1 and 25 scans per spectrum.
Raman spectroscopic measurement
Raman spectroscopy was performed on a Bruker Vertex 70 spectrometer (Bruker, Evere, Belgium) equipped with a RAM II module and two laser channels for Raman analysis; a first channel with an integrated air-cooled diode pumped Nd:YAG excitation laser running at 1064 nm with a liquid N2 cooled ultrahigh sensitivity Ge detector and the second channel with an integrated air-cooled diode pumped excitation laser at 785 nm and a Si-avalanche diode TE-controlled detector. Both excitation lasers had a maximum power output of 500 mW. The spectra were collected with a Raman shift scanning range of 0–3600 cm–1 and a resolution of 2 cm–1; 64 scans were averaged for each spectrum with the OPUS software (OPUS, v.7.2) being used for data acquisition.
The spectra were either evaluated through visual inspection or subjected to multivariate statistical analysis, as explained below.
Data treatment and chemometrics
In the frame of the statistical analyses, each spectrum was considered as an independent measurement reflecting the variability of the composition of the products studied. The spectra obtained from the different samples by the Raman and NIR spectrometers were processed and subjected to various multivariate statistics using the software package Unscrambler®X (CAMO Software, Trondheim, Norway). When acquiring spectroscopic data, pre-processing of the spectra is one of the most important steps in the analysis to remove undesired systematic variation in the data such as baseline drift, scatter effects and to improve the signal-to-noise ratio. The most common pre-processing techniques are the multiplicative scatter correction (MSC), standard normal variate (SNV), Savitzky–Golay smoothing and filtering, and the first- and second-order derivation (Rinnan et al. Citation2009; Omar et al. Citation2015). Different spectra pre-processing were employed for the Raman measurements depending on the sample. In the case of the Raman data for sulphates, the combination of SNV and first derivate (Savitzky–Golay) with a window size of five and a second-order polynomial was applied as a pre-processing tool for the spectra to enhance the signal-to-noise ratio for building the models. For the Raman spectra of the vitamins, the spectra were subjected to SNV.
Principal component analysis (PCA) was employed to achieve an accurate differentiation among the different spectra within feed additive groups. PCA is a valuable tool for the proper exploration of data; it is an unsupervised method which reduces the dimensionality of the original data matrix into uncorrelated variables containing the maximum information (Abbas et al. Citation2009; Guzmán et al. Citation2012). Score plots were used to see the distribution of the samples and the loading plots were used to interpret the spectral information.
Results and discussion
Identification of inorganic and organically bound selenium
Selenium is an important trace element, which is marketed under the category ‘nutritional additives’ and the functional group ‘compound of trace elements’ via different products, namely selenised yeast, selenomethionine, sodium selenite and sodium selenate. Separate regulations authorise these products. For instance, L-selenomethionine from chemical synthesis is authorised by Regulation (EU) No. 121/2014 (European Commission Citation2014), whereas selenomethionine produced by Saccharomyces cerevisiae NCYC R646 is authorised by Regulation (EU) No. 427/2013 (European Commission Citation2013). For inorganic selenium, two feed additives are currently authorised – still according to the old legislation – namely sodium selenite and sodium selenate. Therefore, these products need to be reauthorised following the new legislation. However, an application has been exclusively submitted for sodium selenite, whereas a corresponding application for sodium selenate has not been presented. Consequently, the authorisation for the latter product is expected to expire soon.
The authorisation regulations include detailed characterisations for the different products and also establish a maximum content of total selenium in feed at 0.5 mg kg–1. Moreover, for organically bound selenium, the corresponding regulations (European Commission Citation2013) contain the additional provision that the maximum supplementation with organic selenium in feed is 0.2 mg kg–1.
The enforcement of these provisions requires the availability of different analytical methods. Within the frame of the reauthorisation exercise, the EURL has already published various reports on these feed additives, focusing on the method for the quantification of total selenium in the feed additive and feed (EURL Feed Additives Citation2015) such as hydride generation atomic absorption spectrometry (HGAAS). This method is suitable for enforcement of the legal limit of 0.5 mg total selenium, whereas the control of the additional provision regarding the content of organic selenium in feed is not possible with this technique. A recent EURL report also contained the recommendation for a method based on high-performance liquid chromatography and inductively coupled plasma mass spectrometry (HPLC-ICP-MS) (EURL Feed Additives Citation2012a) for the determination of selenomethionine in feed additives containing organic selenium. However, this method requires specific instrumentation and is rather laborious. Therefore, it does not lend itself well to routine analysis. Given the complexity of analysing feed samples to establish which of the different selenium-containing feed additives has been added to this matrix, the application of spectroscopy to these products rather than analysing feed was considered as an alternative approach.
In this study, Raman spectroscopy was applied to establish whether the spectra of various selenium-containing feed additives, namely sodium selenite, sodium selenate, selenised yeast, selenomethionine and their non-selenium-containing counterparts of the organic selenium products were significantly different from each other.
Spectra from 13 feed additives were used in the evaluation, namely (1) one selenomethionine product, (2) one methionine product, (3) two sodium selenite products, (4) one sodium selenate product, (5) five selenised yeasts and (6) three yeasts (S. cerevisiae). A representative Raman spectrum of each of the above-mentioned compound groups is shown in , revealing that the spectra are very different from each other. The inorganic selenium feed additives, sodium selenite and sodium selenate have very characteristic spectra because the former product has main bands at 740 and 780 cm–1, while the latter product has main bands at 847 and 902 cm–1. In contrast, the organic selenium feed additives, selenomethionine and selenised yeast do not show the sharp peaks present in the spectra of sodium selenite and selenate. Also, the spectra from the organic selenium products are different from each other since selenomethionine has an intensive peak at 595 cm–1, which is absent in the spectra of selenised yeast. The spectrum of selenised yeast is different from the spectra of the products since its Raman response is very weak. Comparing these spectra by visual inspection, it was confirmed that Raman allows a rapid distinction between the various products, thus establishing whether the specific additive used contains inorganic or organic selenium. Moreover, methionine and selenised yeast do not show a strong Raman response in the region of the main bands of sodium selenite. Therefore, a blend of the latter feed additive with methionine or yeast could be easily differentiated from selenomethionine or selenised yeast, respectively. Finally, the use of Raman spectroscopy could also be applied to identify the addition of sodium selenate, which has practical implications once this product is now longer authorised for the EU market.
Zinc and manganese sulphates
Zinc and manganese compounds are used as feed additives under the category ‘nutritional additives’ and functional group ‘compounds of trace elements’. Most often, the trace elements are added as inorganic salts such as sulphates or chlorides, but they are also available as chelates of amino acid hydrates. Feed additives that contain the same trace element but differ in terms of their composition are nevertheless separately authorised under specific identification numbers. For instance, zinc sulphate heptahydrate and zinc sulphate monohydrate are separately authorised under the identification numbers 3b604 and 3b605, respectively (European Commission Citation2016b). For both feed additives, the regulation establishes different values for the minimum zinc content in the product, which were 220 g kg–1 for the former and 340 g kg–1 for the latter product, whereas the maximum zinc content in feed is identical in both cases.
The EURL-FA already evaluated the analytical methods related to various zinc (EURL Feed Additives Citation2016) and manganese products (EURL Feed Additives Citation2012b). Corresponding methods of analysis as recommended by the EURL include various Pharmacopeia methods, such as complexometric titration for the identification of the additive and inductively coupled plasma atomic emission spectrometry (ICP-AES) for the determination of the target trace element in the product and in feed. The use of these techniques for the characterisation of the feed additives is demanding for official control laboratories since it requires the application of entirely different methods. Therefore, we applied Raman and NIR spectroscopy to establish whether feed additives of the functional group of trace elements could be differentiated using spectroscopy. For the study, the following feed additives, which contain zinc or manganese as target trace element and also differ in terms of their composition were selected: Zinc sulphate heptahydrate (ZnSO4·7H2O), zinc sulphate monohydrate (ZnSO4·H2O) and manganese sulphate monohydrate (MnSO4·H2O). For zinc sulphate heptahydrate, a sample from one applicant was exclusively available. For manganese sulphate monohydrate, two samples from two different applicants were available, whereas for zinc sulphate monohydrate, three different samples were included in this study, namely one sample and its replacement sample from one applicant and a third sample from another applicant. According to the analytical certificate, the purity of the products was above 96%.
Results from Raman spectroscopy
Raman spectroscopy has already been used for the identification of differences among sulphates of similar composition and structure (Culka et al. Citation2014) showing that the amount of water molecules can significantly modify the spectra (Chio et al. Citation2005). Therefore, the influence of the fraction of water of hydration on the spectra of the zinc-containing feed additives on the measured spectra was investigated. Also, the spectra were examined to assess the influence of the specific trace element.
The obtained Raman spectra of the monohydrated compounds (Zn and Mn) are shown in ) and revealed a small shift of the main peaks such as in the range of 1021 cm–1. Also, the spectra of the zinc-containing samples have an additional peak at 1079 cm–1, which cannot be found in the manganese containing samples. On the other hand, a peak at 655 cm–1 is exclusively visible in the spectra of the manganese-containing samples.
Figure 1. Raman spectra of sodium selenite, sodium selenate, selenised yeast, selenomethionine and the non-selenium-containing counterparts (yeast and methionine) products used as feed additives with their main Raman bands marked in the range 2000 to 70 cm–1.
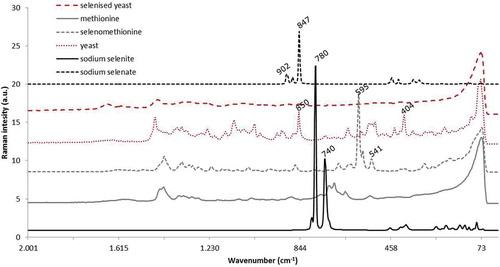
Figure 2. Raman spectra of feed additives: (a) effect of the trace element based on measurements of two ZnSO4·H2O and two MnSO4·H2O feed additives with the shift of the main peaks marked; and (b) effect of hydration based on measurements of ZnSO4·H2O and ZnSO4·7H2O, showing the shift of the main peak due to the amount of water of hydration.
The spectra of zinc sulphate monohydrate and zinc sulphate heptahydrate are presented in ). The visual inspection shows significant differences between both spectra. For instance, the main peak visible in the monohydrate form at 1023 cm–1 is shifted to 984 cm–1 in the heptahydrate form. Also, the spectra of the monohydrate form show some smaller peaks that are much weaker or even not visible in the spectra of the heptahydrate.
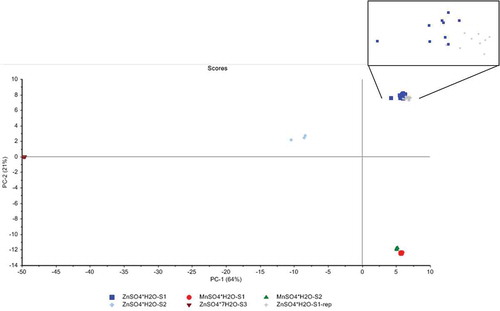
Since the Raman spectra of the monohydrated products were very similar, their differentiation was difficult by visual inspection of these spectra. Therefore, the spectra of all zinc and manganese containing products were subjected to PCA, and the results of the scores of principal component (PC) 1 and PC2 for these samples are presented in . PC1 explains 64% and PC2 explains 21% of the total variance in the data, giving a total of 85% for both PCs. The evaluation of the scores of the samples shows that PC1 explained mainly the fraction of water of hydration since on the left side of this PC is the heptahydrate form of ZnSO4, while on the right side are the monohydrate form of ZnSO4 and MnSO4. Moreover, the variance along PC2 explains the capability of distinguishing the compounds according to their metal, i.e., Zn or Mn since the zinc-containing products were mainly in the upper part of the score plot, whereas the manganese containing products were in the lower part of the score plot. The details of the sample names in also allow an assessment of the influence of the provenance/batch number of the samples indicated by S1, S1 replacement, S2 and S3 on the measured spectra. The evaluation indicates that the provenance or production batch only played a minor role since the two MnSO4 (S1 and S2) samples from different applicants and the original and replacement ZnSO4 samples (S1 and S1 rep) from the same applicant formed almost a single group in the score plot, respectively. Just the monohydrated ZnSO4 sample (S3) from another applicant formed a separate group, but was still in the correct range regarding the water of hydration content and the trace element.
Figure 3. Results of the PCA conducted on the Raman spectra of the studied ZnSO4 and MnSO4 compounds: the distribution of the scores of the samples indicates that the additives were differentiated along the PC1 according to their content of water of hydration and along PC2 according to their trace element. Inside the square magnification of ZnSO4·H2O-S1 and its replacement.
Also, the loadings of PC1 and PC2 were evaluated and showed that the key information regarding the separation of the trace elements sulphates was found in the range of 1250 to 70 cm–1.
Results from NIR spectroscopy
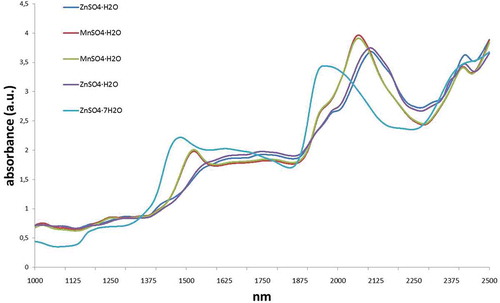
The same approach, as with the Raman was attempted with NIR. First, a quick evaluation of the products was carried out to determine if the identification of the products by NIR could be feasible. As can be observed in , both monohydrated products show very different spectra and can be easily identified in comparison with Raman spectroscopy. As can be observed in as well, the water molecules provide very different spectra among the sulphates with the same metal. Thus, NIR can be a very useful technique to distinguish among MnSO4 and ZnSO4 products.
Figure 4. NIR spectra of five sulphate products used as feed additives: ZnSO4·H2O, ZnSO4·7H2O and MnSO4·H2O measured in the range 2500 to 1000 nm.
Vitamins
Vitamins are important feed additives authorised under category 3 ‘nutritional additives’ as specified by the regulation (European Union Citation2003). While the majority of vitamins are produced by chemical synthesis, some products such as vitamin B2 are also produced by fermentation (Albers et al. Citation2001). Often, specific vitamins represent a group of different forms. For instance, vitamin B1 covers two distinct substances, namely thiamine mononitrate and thiamine hydrochloride, which are authorised separately under different identification numbers (European Commission Citation2015). Since vitamins have been used in animal nutrition prior to 2003 based on authorisations according to previous legislation, applications for authorisation of these products have been submitted within the frame of the reauthorisation exercise. While the reauthorisation for all vitamins has not yet been finalised, the EURL-FA has already issued the corresponding evaluation reports. In all cases, different methods of analysis have been recommended, namely for the characterisation of the vitamins and the determination in compound feed, respectively. The analytical methods used for the characterisation of the products differed significantly since they included thin-layer chromatography, HPLC coupled with UV detection and infrared spectroscopy.
In the current study, the Raman and NIR spectra of the following 10 vitamins as submitted by the applicant to the EURL-FA were evaluated to establish whether these products could be separated by spectroscopy: vitamins B1, B2, B3, B6, B12, E, K3, D3, A and C.
The evaluation of the NIR spectra indicated that no separation amongst the vitamins could be obtained (results not shown). Therefore, the investigation focused on the measurements done with Raman spectroscopy. The results from the PCA of the Raman spectra are presented in , showing the score plot of PC1 and PC2, which explained 31% and 24% of the total variance, respectively. The visual inspection of the scores obtained of the samples shows that by using the results from the first PCs, samples were grouped according to the different vitamins. The PC1 scores of the samples from vitamin A and D3 are on the right side and well separated from the other vitamins, which show up on the left side of PC1. In some cases there are separate subgroups within a specific vitamin. For instance, for vitamin K3, there are three different subgroups identified in as 1, 2 and 3. A more detailed evaluation revealed that these subgroups refer to the three distinct forms of vitamin K3, namely subgroup 1 refers to menadione dimethylpyrimidinol bisulfite, subgroup 2 to menadione nicotinamide bisulfite and subgroup 3 to menadione sodium bisulfite. Moreover, subgroups 1 and 3 contain samples from different provenance, but they correctly cluster together, as subgroup 1 contained the original and replacement samples from the same applicant and subgroup 3 contained even the samples from two different companies that had submitted separately for the same vitamin K3 form. The separation of the vitamin K3 into their different forms has practical application because menadione nicotinamide bisulfite and menadione sodium bisulfite are authorised vitamin K3 forms (European Commission Citation2015) which is not the case for menadione dimethylpyrimidinol bisulfite.
Figure 5. PCA of the Raman spectra (wave number range of 2000 to 70 cm–1) of all vitamins included in this study. PC1 and PC2 explain 31% and PC2 24% of the total variance, respectively. Products can be differentiated along the first two PCs according to the type of vitamin. Moreover, the different forms of specific vitamins are well separated. For instance, the spectra of the vitamin K3 products occur in three different forms: 1 = menadione dimethylpyrimidinol bisulfite, 2 = menadione nicotinamide bisulfite and 3 = menadione sodium bisulfite.
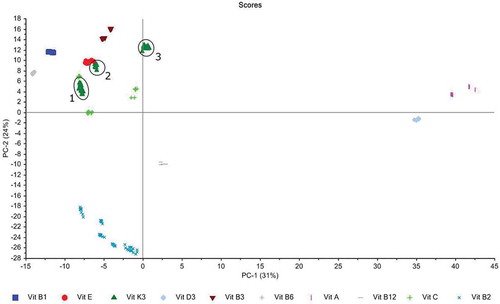
Also, the vitamin B2 samples form subgroups in the score plot of PC2 versus PC1 (), which again is probably linked to the different forms beyond the vitamin B2 feed additives submitted to the EURL-FA. In detail, the vitamin B2 group is composed of samples containing riboflavin and riboflavin sodium phosphate, respectively. Also the production process of these products was different because one product was produced by chemical synthesis (EURL Feed Additives Citation2014b) whereas the other products were produced by fermentation containing, in addition to the target substance, i.e., riboflavin or riboflavin sodium phosphate and other ingredients such as fermentation solubles (EURL Feed Additives Citation2010). Therefore, we assume that the different composition of the vitamin B2 samples may have caused difference in the corresponding Raman spectra as indicated in the score plot ().
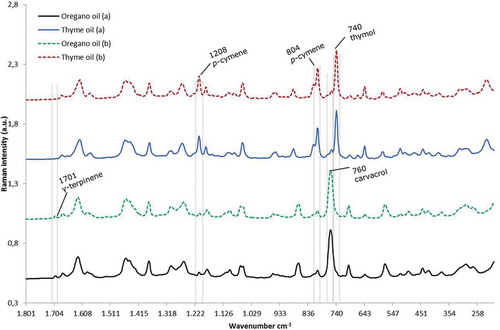
Figure 6. Raman spectra of the mislabelled bottles containing oregano and thyme oil. The main bands of thymol, carvacrol, p-cymene and γ-terpinene are marked at 740, 760, 804, 1208 and 1701 cm–1 respectively. The presence and absence of the main bands corresponding to the principal monoterpenes can be checked between the discontinuous red lines.
Finally, subgroups have been also observed for vitamin C, which corresponded to three different and authorised forms, namely ascorbic acid, calcium ascorbate and sodium ascorbyl phosphate.
Mislabelling of the active substances oregano and thyme oil of a feed additive preparation
This example is related to a specific preparation for which an application for authorisation has been submitted under the category/functional group 4(b) ‘zootechnical additives’/‘gut flora stabilisers’ according to the classification system of Regulation (EC) No. 1831/2003. This preparation contains the main ingredients such as wheat meal and four active substances, namely sodium ethylenediaminetetraacetate, tannin/tannic acid added via Castanea sativa Mill, thymol added via thyme oil and carvacrol added via oregano oil as specified in the corresponding EURL-FA report (EURL Feed Additives Citation2014a). This report also includes the evaluation of the applicant’s method for the determination of thymol and carvacrol in the preparation, which comprises two steps, namely the extraction of the sample with pressurised liquid extraction and subsequently the analysis of the extract with gas chromatography coupled to flame ionisation detection.
Since the submission of this preparation was under the category zootechnical additives, the applicant had to send to the EURL-FA, together with samples of the preparation, samples of the four active substances, respectively. From all samples, Raman spectra were obtained including two identical samples (labelled as ‘a’ and ‘b’) from thyme oil and oregano oil.
The visual inspection of the spectra revealed that the two oregano oil samples were not similar, and the same occurred with spectra obtained from the two samples of thyme oil. Moreover, one spectrum of the sample labelled as oregano oil was identical to one spectrum of the product labelled as thyme oil and vice versa; so the spectra were the same in couples, but were not coinciding with their labelling. Thus, a deeper investigation was required to identify a possible reason for this observation.
Monoterpenes are a class of terpenes with a basic molecular formula of C10H16, and the major substances of this class in the two essential oils are carvacrol, thymol, p-cymene and γ-terpinene (Rouatbi et al. Citation2007; Usai et al. Citation2011; Ruben et al. Citation2014), as summarised in . These compounds are present in several plants at variable concentrations, but one of the peculiarities between both analysed oils is that oregano oil has carvacrol and γ-terpinene as the main monoterpenes, but thyme oil mainly consists of thymol and p-cymene (Rouatbi et al. Citation2007; Usai et al. Citation2011; Ruben et al. Citation2014). Therefore, the characteristic Raman bands from each of the monoterpenes available from the literature (Schulz et al. Citation2005) were included in this evaluation.
Table 1. Molecular structure of the main four monoterpenes present in oregano and thyme oil, together with their main Raman signals.
The presence of the main bands for carvacrol and thymol in Raman spectroscopy were checked at 760 and 740 cm–1 respectively. The essential oil that lacks a carvacrol signal at 760 cm–1 should be thyme oil, and the essential oil that lacks a band at 740 cm–1 will be oregano oil. Moreover, the high concentration of p-cymene in thyme oil shows two prominent bands at wave numbers 804 and 1208 cm–1 which are not so important in oregano oil, as shown in .
Based on the evaluation of the spectra from thyme oil and oregano oil obtained from the samples and comparing them with literature spectra of their four main compounds, the identity of these oils was confirmed. Therefore, it could be concluded that the mismatch of the spectra from the samples was due to the wrong labelling of the bottles of the two essential oils.
Conclusions
The authorisation of feed additives within the European Union requires that the industry sends samples of the feed additives to the EURL-FA. Since the beginning of its operation in 2004, the EURL-FA received samples from all feed additives that are currently, either authorised by the European Union or under evaluation. The sufficient characterisation of these feed additives by analysis is important to allow for traceability and compliance with legal requirements. Therefore, the EURL-FA used its unique position in respect to the repository of feed additives and subjected, on its own initiative, all samples to an analysis by vibrational spectroscopy, i.e., NIR and Raman spectroscopy. This paper described four examples of this approach and demonstrated the applicability of this technique for the intended purpose. While a number of classical analytical techniques are available to identify feed additives by the determination of the target analyte, e.g., active substance, vibrational spectroscopy also showed the potential of distinction of different feed additives based on additional features, e.g., production system, presence of other ingredients etc. The use of vibrational spectroscopy by laboratories is facilitated by the fact that the required sample preparation is rather limited and the results of the analysis are available in a short time. One of the practical applications could be to check whether a feed additive complies with specific identification criteria included in the corresponding regulation authorising the additive, for instance by comparing the measured spectra against a previously created spectra databank.
Disclosure statement
No potential conflict of interest was reported by the authors.
References
- Abbas O, Fernández Pierna JA, Codony R, von Holst C, Baeten V. 2009. Assessment of the discrimination of animal fat by FT-Raman spectroscopy. J Mol Struct. 924:294–300.
- Albers N, Gotterbarm G, Heimbeck W, Keller T, Seehawer J, Tran TD. 2001. Vitamine in der Tierernährung. Clenze (Germany): Agrimedia.
- Ambrose A, Lohumi S, Lee WH, Cho BK. 2016. Comparative nondestructive measurement of corn seed viability using Fourier transform near-infrared (FT-NIR) and Raman spectroscopy. Sensor Actuat B-Chem. 224:500–506.
- Banas A, Banas K, Kalaiselvi SMP, Pawlicki B, Kwiatek WM, Breese MBH. 2017. Is it possible to find presence of lactose in pharmaceuticals? – preliminary studies by ATR-FTIR spectroscopy and chemometrics. Spectrochim Acta A. 171:280–286.
- Chio CK, Sharma SK, Muenow DW. 2005. Micro-Raman studies of hydrous ferrous sulfates and jarosites. Spectrochim Acta A. 61:2428–2433.
- Culka A, Košek F, Drahota P, Jehlička J. 2014. Use of miniaturized Raman spectrometer for detection of sulfates of different hydration states – significance for Mars studies. Icarus. 243:440–453.
- EURL Feed Additives. 2010. Evaluation report on vitamin B2. [ cited 2016 Aug 2]. Available from: https://ec.europa.eu/jrc/sites/jrcsh/files/FinRep-FAD-2010-0049.pdf
- EURL Feed Additives. 2012a. Evaluation report on Sel-plex 2000 and selenomethionin. [ cited 2016 Aug 2]. Available from: https://ec.europa.eu/jrc/sites/default/files/FinRep-FAD-2009-0029%2B2010-0044.pdf
- EURL Feed Additives. 2012b. Evaluation report on various manganese containing feed additives [ cited 2016 Aug 2]. Available from: https://ec.europa.eu/jrc/sites/jrcsh/files/FinRep-SANCO-Manganese.pdf
- EURL Feed Additives. 2014a. Evaluation report on Diarr-Stop S Plus. [ cited 2016 Aug 2]. Available from: https://ec.europa.eu/jrc/sites/jrcsh/files/FinRep-FAD-2010-0406-DiarrStop.pdf
- EURL Feed Additives. 2014b. Evaluation report on Riboflavin Sodium Phosphate. [ cited 2016 Aug 2]. Available from: https://ec.europa.eu/jrc/sites/jrcsh/files/finrep2_fad-2011-0051_riboflavin%20sodium%20phosphate.pdf
- EURL Feed Additives. 2015. Evaluation report on sodium selenite. [ cited 2016 Aug 2]. Available from: https://ec.europa.eu/jrc/sites/default/files/finrep-fad-sodium_selenite_group.pdf
- EURL Feed Additives. 2016. Evaluation report on various zinc containing feed additives. [ cited 2016 Aug 2]. Available from: https://ec.europa.eu/jrc/sites/jrcsh/files/FinRep-SANCO-Zinc.pdf
- European Commission. 2013. Commission Implementing Regulation (EU) No. 427/2013 of 8 May 2013 concerning the authorisation of selenomethionine produced by Saccharomyces cerevisiae NCYC R646 as a feed additive for all animal species and amending Regulations (EC) No. 1750/2006, (EC) No. 634/2007 and (EC) No. 900/2009 as regards the maximum supplementation with selenised yeast. Off J Eur Union L. 127:20–22.
- European Commission. 2014. Commission Implementing Regulation (EU) No. 121/2014 of 7 February 2014 concerning the authorisation of L-selenomethionine as a feed additive for all animal species. Off J Eur Union L. 39:53–55.
- European Commission. 2015. Commission Implementing Regulation (EU) No. 2015/897 of 11 June 2015 concerning the authorisation of thiamine hydrochloride and thiamine mononitrate as feed additives for all animal species. Off J Eur Union L. 147:8–13.
- European Commission. 2016a. European Union register of feed additives. [ cited 2016 Aug 2]. Available from: http://ec.europa.eu/food/safety/docs/animal-feed-eu-reg-comm_register_feed_additives_1831-03.pdf
- European Commission. 2016b. Commission Implementing Regulation (EU) No. 2016/1095 of 6 July 2016 concerning the authorisation Zinc acetate dihydrate, Zinc chloride anhydrous, Zinc oxide, Zinc sulphate heptahydrate, Zinc sulphate monohydrate, Zinc chelate of amino acids hydrate, Zinc chelate of protein hydrolysates, Zinc chelate of glycine hydrate (solid) and Zinc chelate of glycine hydrate (liquid) as feed additives for all animal species and amending Regulations (EC) No. 1334/2003, (EC) No. 479/2006, (EU) No. 335/2010 and Implementing Regulations (EU) No. 991/2012 and (EU) No. 636/2013. Off J Eur Union L. 182:7–27.
- European Communities. 1970. Council Directive of 23 November 1970 concerning additives in feeding-stuffs (70/524/EEC). Off J Eur Communities: Legis Dec. 14:L 270/1.
- European Union. 2003. Regulation (EC) No. 1831/2003 of the European Parliament and the council of 22 September 2003 on additives for use in animal nutrition. Off J Eur Union. Oct 18:29–43. lastly amended by Commission Regulation (EU) 2015/2294.
- Graham SF, Haughey SA, Ervin RM, Cancouët E, Bell S, Elliott CT. 2012. The application of near-infrared (NIR) and Raman spectroscopy to detect adulteration of oil used in animal feed production. Food Chem. 132:1614–1619.
- Guzmán E, Baeten V, Fernández Pierna JA, García-Mesa JA. 2012. A portable Raman sensor for the rapid discrimination of olives according to fruit quality. Talanta. 93:94–98.
- Omar J, Boix A, von Holst C. 2015. Differentiation of coccidiostats-containing feed additives by mid and near infrared microscopy. Food Addit Contam A. 32:1464–1474.
- Rinnan A, van den Berg F, Engelsen SB. 2009. Review of the most common pre-processing techniques for near-infrared spectra. TRAC-Trend Anal Chem. 28:1201–1222.
- Rouatbi M, Duquenoy A, Giampaoli P. 2007. Extraction of the essential oil of thyme and black pepper by superheat steam. J Food Eng. 78:708–714.
- Ruben O, Valeria N, Ruben G. 2014. Antioxidant activity of fractions from oregano essential oils obtained by molecular distillation. Food Chem. 156:212–219.
- Schulz H, Özkan G, Baranska M, Krüger H, Özcan M. 2005. Characterisation of essential oil plants from Turkey by IR and Raman spectroscopy. Vib Spectrosc. 39:249–256.
- Usai M, Marchetti M, Foddai M, Del Caro A, Desogus R, Sanna I, Piga A. 2011. Influence of different stabilizing operations and storage time on the composition of essential oil of thyme (Thymus officinalis L.) and rosemary (Rosmarinus officinalis L.). LWT-Food Sci Technol. 44:244–249.
- von Holst C, Robouch P, Bellorini S, González de la Huebra MJ, Ezerskis Z. 2016. A review of the work of the EU Reference Laboratory supporting the authorisation process of feed additives in the EU. Food Addit Contam Part A. 33:66–77.