
ABSTRACT
Carotenoids are used in animal nutrition mainly as sensory additives that favourably affect the colour of fish, birds and food of animal origin. Various analytical methods exist for their quantification in compound feed, reflecting the different physico-chemical characteristics of the carotenoid and the corresponding feed additives. They may be natural products or specific formulations containing the target carotenoids produced by chemical synthesis. In this study a multi-analyte method was developed that can be applied to the determination of all 10 carotenoids currently authorised within the European Union for compound feedingstuffs. The method functions regardless of whether the carotenoids have been added to the compound feed via natural products or specific formulations. It is comprised of three steps: (1) digestion of the feed sample with an enzyme; (2) pressurised liquid extraction; and (3) quantification of the analytes by reversed-phase HPLC coupled to a photodiode array detector in the visible range. The method was single-laboratory validated for poultry and fish feed covering a mass fraction range of the target analyte from 2.5 to 300 mg kg–1. The following method performance characteristics were obtained: the recovery rate varied from 82% to 129% and precision expressed as the relative standard deviation of intermediate precision varied from 1.6% to 15%. Based on the acceptable performance obtained in the validation study, the multi-analyte method is considered fit for the intended purpose.
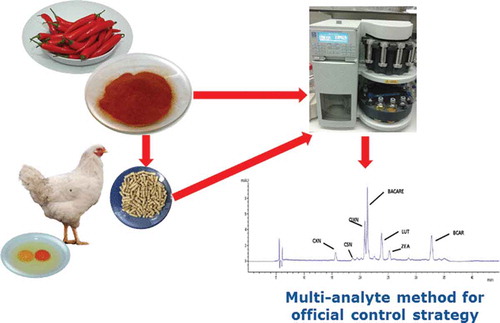
GRAPHICAL ABSTRACT
Introduction
Feed additives, including carotenoids, play an important role in animal nutrition. Prior to their use in the European Union (EU) they have to undergo an authorisation process, as specified by European legislation. Since the early 1970s applicants seeking for authorisation of their products had to follow corresponding procedures given by Commission Directive 70/524/EEC (European Communities Citation1970), whereas in 2003 a completely revised authorisation system was introduced via EU Regulation (EC) No. 1831/2003 (EU Citation2003). One of the key components of the new system is the separation of the safety assessment conducted by the European Food Safety Authority (EFSA) and the approval or denial for authorisation, which falls under the responsibility of the European Commission (EC) assisted by the Standing Committee on the Food Chain and Animal Health comprised of EU member states’ representatives. Authorised products belong to a specific category such as sensory, nutritional or zootechnical feed additives and are listed in the EU Register of Feed Additives (EC Citation2016), which is regularly updated by the EC. In addition, Regulation (EC) No. 1831/2003 created the EU Reference Laboratory for Feed Additives (EURL-FA), which has mainly two tasks: the evaluation of analytical methods submitted by the applicant; and the reception, storage and maintenance of feed additive samples. The main objective of these analytical methods is to allow the member states’ official laboratories to establish whether feed samples comply with legal requirements such as the maximum content of the feed additive in feed. More details on the operation of the EURL-FA have been given by von Holst et al. (Citation2016).
Given the high number of feed additives authorised according to the old legislation and the need to subject these products to the new authorisation procedure, EU legislation (EU Citation2003) allows for a long transition period. In consequence, the current European Union Register of Feed Additives (EC Citation2016) contains products that are still authorised according to the old system and also according to the new system. This has practical implications because the legal act authorising the feed additive according to the new system also contains a reference to the method of analysis that had been evaluated by the EURL-FA and needs to be used within the frame of official control. In contrast, authorisations under the old system do not foresee specific methods of analysis.
Carotenoids are a class of hydrocarbons (carotenes) and their oxygenated derivatives (xanthophylls). These substances contain a different number of conjugated double bounds, thus leading to various stereoisomers abbreviated as E- and Z-isomers, depending on whether the double bonds are in the trans (E) or cis (Z) configuration.
An overview of the current legal situation of the various carotenoids when used as feed additives, including specific aspects of methods of analysis, is shown in . Carotenoids are authorised as natural products containing a specific carotenoid as active substance or as specific preparations containing the carotenoid or as pure substances. For instance, the yeast Phaffia rhodozyma is an authorised feed additive with the active substance astaxanthin, whereas astaxanthin produced by chemical synthesis is authorised as pure substances. In the latter case, however, the carotenoids are often present in a stabilised matrix containing antioxidants and are coated (Amaya et al. Citation2014) to render these analytes more stable. The formulations are then the final product added to the feedingstuffs. Moreover, the legal acts authorising carotenoids as feed additives establish in all cases a maximum content of these substances in feed. Therefore, the use of the feed additives along with the added amount expressed in terms of the mass fraction of the carotenoid in feed has to be indicated on the label of the compound feed concerned as specified by Regulation (EC) No. 767/2009 (European Union Citation2009). For canthaxanthin, the corresponding regulation (EC Citation2014) even establishes MRLs of this substance in poultry tissue and eggs.
Table 1. Overview of the carotenoids used as feed additives in the European Union, mainly authorised as colorants under the category ‘sensory additives’. The feed additive may be a natural product such as Phaffia rhodozyma containing the active substance astaxanthin or the active substance, such as in the case of the carotenoids produced by chemical analysis. In the latter case the sample as deposited at the EURL-FA is a formulation containing the active substance and additional ingredients as indicated in the notes. Also contained are: (1) the conditions of use expressed in terms of target animal and maximum content; (2) the legal acts authorising the products; (3) the reference to the EURL-FA evaluation report; and (4) information from the EURL-FA report on the method of analysis.
The EURL-FA has already evaluated existing analytical methods for the determination of all target analytes in feed as proposed by the applicants for authorisation on the EU market. The types of the analytical method are given in the last column of . Moreover, the EURL-FA evaluation reports as referenced in are available on the EURL-FA’s website (https://ec.europa.eu/jrc/en/EURL-FA/feed-additives/evaluation-reports) and contain key characteristics of the evaluated methods. Although the details of the corresponding standard operating procedures differ for the various carotenoids, there are the following similarities of the methods. The feed samples are extracted with organic solutions often containing chlorinated solvents. Moreover, as the synthetic carotenoids are added to feed via specific preparations and encapsulated formulations, the methods utilise in these cases an enzyme to facilitate sufficient extraction of the target analytes from the formulations. Finally, all carotenoids with the exception of beta-carotene are determined with normal-phase HPLC coupled to a photodiode array detector in the visible range (NP-HPLC/VIS). The analytical methods specified in the corresponding EURL-FA reports () also showed that by using NP-HPLC the carotenoids are separated into their all-E-isomer, where all double bonds are in the trans configuration, and the main Z-isomers. When quantifying the total content of a specific carotenoid, these geometrical isomers need to be quantified separately and the obtained values for the mass fractions of the isomers have to be added. However, this procedure is complicated due to the fact that (1) the geometrical isomers have different absorption coefficients and (2) for the majority of cases exclusively the all-E-isomer is available. In order to cope with these restrictions, the analytical methods mentioned above foresee that the mass fractions of all isomers are calculated by using the same calibration curve established with the specific isomer (all-E-isomer), and then by taking into account relative response factors for the absorbance of the Z-isomers compared with the all-E-isomer. These response factors were previously determined in separate experiments and are given in the method protocol.
As indicated in column ‘legal act’ of , some of the feed additives are already authorised according to the new regulation and, therefore, the above-mentioned methods are compulsory for the enforcement of legal limits of the corresponding carotenoids in feed. Once the reauthorisation process is finalised, this will apply also to all other carotenoids that are still registered according to the old legislation. This means in practical terms that member states’ feed laboratories need to apply different methods for the various analytes when determining carotenoids for official control purposes. Considering the limited resources available in control laboratories, there is a strong need for analytical methods that allow for the simultaneous determination of the various carotenoids.
The objective of this study was to develop and validate a multi-analyte method that allows for the analysis of compound feed in order to determine simultaneously the following carotenoids authorised as feed additives: astaxanthin, astaxanthin dimethyldisuccinate, adonirubin, canthaxanthin, beta-carotene, capsanthin, ethyl ester of beta-apo-8ʹ-carotenoic acid, citranaxanthin, lutein and zeaxanthin. The chemical structures of these compounds are given in . Moreover, the method needs to be applicable to all types of commercial products. Therefore, this study was conducted using feed additive samples containing the carotenoids and sent by the industry to the EURL-FA when asking for authorisation of these products. The method development presented in this paper focused on sample preparation, since the reversed-phase RP-HPLC protocol was very similar to that already reported in our previous paper (Mitrowska et al. Citation2012).
Figure 1. Chemical structure of the carotenoids targeted in the study.
Materials and methods
Test materials
The test materials used in the optimisation experiments and the subsequent validation exercise were prepared with commercial compound feed and feed additive samples as provided by the applicants to the EURL-FA. These feed additive samples were either preparations from natural sources or formulations, both containing the target analytes at specified mass fractions indicated by the certificate of analysis from the producer. The mass fractions differ amongst the various feed additive samples. For instance, the feed additive Paracoccus carotinifaciens contained 23 g kg–1 astaxanthin, 3 g kg–1 canthaxanthin and 8 g kg–1 adonirubin, whereas the mass fraction of chemically produced canthaxanthin in the corresponding formulation was 100 g kg–1.
Commercial compound feed for poultry and fish was purchased from a local retailer. The feed for poultry contained maize, sunflower, soya, oats, beet molasses, monocalcium phosphate and different nutritional feed additives. The fish feed contained vegetal by-products, cereals, fish meal, oils and fat and various nutritional feed additives. Prior to their use the compound feed was first ground with a Waring blender and subsequently used for the spiking experiments.
The compound feed test materials were split into a sufficient number of subsamples required for the single-laboratory validation exercise and individually fortified with the selected feed additives. The whole amount of the fortified subsample of about 5 g was subsequently subjected to analysis without further subsampling. The required mass of the feed additive to be added to the subsamples was established from (1) the mass fraction of the carotenoid in the feed additive and (2) the maximum allowed content of the carotenoids in the compound feed as specified in . For the validation study compound feed samples with the carotenoid at three different mass fractions were prepared, namely at the maximum authorised content, below and above this level as specified in the experimental chapter of the paper. The real weighted amounts of the feed additives added to the subsamples were measured during each weighing procedure and used to calculate the mass fractions of each carotenoid in the feed sample.
Due to the fact that exclusively one feed additive for each carotenoid is authorised for poultry feed, whereas different feed additives for the same carotenoid can be used for fish feed, the preparation of the samples was slightly different for the corresponding test materials. For instance, only the source ‘canthaxanthin by chemical synthesis’ is authorised for poultry, whereas canthaxanthin can be added to fish feed via the source ‘canthaxanthin by chemical synthesis’ or ‘red carotenoid-rich Paracoccus carotinifaciens’. Even three feed additives are authorised, for astaxanthin in fish feed, namely ‘Phaffia rhodozyma’, ‘astaxanthin by chemical synthesis’ and ‘red carotenoid-rich Paracoccus carotinifaciens’. Details of the composition of the matrices used in the validation study are shown in .
Table 2. Feed additives used for the preparation of the feedingstuff test material and the composition of the test feed samples: (a) M1–M4 used for the experiments with fish feed; and (b) M5 used for the experiments with poultry feed. The typical mass fractions are either taken from the regulation authorising the additive or the EURL-FA evaluation report as specified in . For M1 and M2 different formulations for astaxanthin and canthaxanthin were used, respectively.
Fish feed
Four different feed samples (M1–M4) were prepared containing different carotenoids, while ensuring that a specific carotenoid was added exclusively from one feed additive. This procedure was required to allow for the precise calculation of the mass fraction. For instance, M1 contained astaxanthin added via a formulation with this analyte produced by chemical synthesis, M3 contained astaxanthin added via Paracoccus carotinifaciens and M4 contained astaxanthin added via Phaffia rhodozyma. Moreover test material M1, for instance, contained three different feed additives, namely formulations containing astaxanthin, astaxanthin dimethyldisuccinate and canthaxanthin, respectively.
Poultry feed
Each subsample was spiked with all feed additives authorised for poultry as specified in .
Three different test materials were prepared in this manner containing the carotenoids at the three different mass fractions as specified in the result chapter of this paper.
As shown in there are also specific authorisations for canthaxanthin in poultry feed with a maximum content of 6 and 8 mg kg–1 of this analyte in compound feed. However, the preparation of test samples with such a low content would require the addition of an extremely low amount of the corresponding feed additive and was not feasible. Instead, commercial compound feed was used, where according to the information on the label the feed contained a specific feed additive formulation with canthaxanthin produced by chemical synthesis. Furthermore, the label specified that the mass fraction of canthaxanthin in the compound feed calculated from the added product was 2.5 mg kg–1. Prior to analysis the feed was ground in a Waring blender and subsamples were taken for subsequent analysis.
Procedures
Reagents and solvents
All chemicals and solvents used were of analytical grade and suitable for HPLC. The carotenoid standards were all-E-isomers. Adonirubin was purchased at CaroteNature GmbH (Lupsingen, Switzerland). Astaxanthin ≥ 98.5%, canthaxanthin 94.0% and beta-carotene 95.0% were obtained from Sigma-Aldrich (St. Louis, MO, USA). Lutein and zeaxanthin were provided by Applichem Lifescience (Darmstadt, Germany). Astaxanthin dimethyl disuccinate, ethyl ester of beta-apo-8ʹ-carotenoic acid, capsanthin and citranaxanthin were kindly provided by DSM Nutritional Products Ltd (Kaiseraugst, Switzerland). Acetonitrile, acetone and tertbutyl-methyl ether 99% were of LC gradient grade (VWR, Lutterworth, UK), tetrahydrofuran 99% stabilised with 250–350 mg l–1 butylated hydroxytoluene (THF with BHT) was obtained from Alfa Aesar GmbH & Co KG (Karlsruhe, Germany) and water was prepared with a Milli-Q Integral 5 System (Millipore, Molsheim, France). BHT was obtained at Sigma-Aldrich, Protex 6 L (Multifect PR 6 L) was purchased at ChiralVision B.V., (Leiden, the Netherlands) and Hydromatrix was obtained at VARIAN (Agilent Technologies, Santa Clara, USA). Carotenoids are sensitive to heat and light, which needs to be taken into account when handling them in the laboratory (Britton et al. Citation1995).
Enzymatic release
For this step the proven conditions from the analytical methods submitted by the applicants were applied. A 5-g aliquot of the feed samples was added to 15 ml in the case of poultry feed or 20 ml in the case of fish feed of an aqueous solution containing 0.2 g of BHT and 100 µl of Protex 6 L (Multifect PR 6 L). The sample was then treated in an ultrasonic bath at 50°C for 20 min.
Extraction with pressurised liquid extraction (PLE)
PLE was applied in this study due to the potential of automatisation of the extraction process and its high extraction efficiency for various compounds including carotenoids, as reported in a corresponding review article (Mustafa & Turner Citation2011). Moreover, PLE has been successfully applied for the determination of carotenoids in processed food (Breithaupt Citation2004).
Approximately 13 g of Hydromatrix was added to the entire mixture from the previous step and the mixture was vigorously hand-shaken until the wet feed sample was adsorbed on the Hydromatrix. The whole amount of the mixture was then transferred to the 66 ml PLE cell. Finally, the PLE extraction was performed using a ASE 300 Dionex® (Thermo Fisher Scientific, Sunnyvale, CA, USA) extraction system applying the following instrumental conditions: the extraction solvent was acetone, the extraction temperature was 58°C, the static extraction time was 7 min, the flush volume was 120%, the purge time was 60 s and the number of static cycle was three. When the extraction was finished the volume of the extraction solution was measured in a graduated cylinder and an aliquot of 1.8 ml was taken and centrifuged for 1 min at about 13,000g. Finally, the supernatant was taken and injected into the HPLC system. The elevated extraction temperature conditions applied may lead to cis/trans isomerisation. However, such reactions are not relevant in this study since the isosbestic concept is applied, as explained below.
RP-HPLC/VIS conditions
It was also important to substitute NP-HPLC by RP-HPLC because routine laboratories utilise more often the latter technique compared with NP-HPLC. Moreover, the quantification of the various isomers of the target analytes is rather cumbersome. Therefore, a specific RP-HPLC method was applied in this study, which has been previously developed (Mitrowska et al. Citation2012) and which is based on the isosbestic concept. When applying this concept, specific wavelengths are selected at which the absorbance coefficients are identical for all geometrical isomers of a specific analyte, thus allowing the quantification of these isomers against a calibration curve exclusively established with the all-E-isomer. Furthermore, the selected RP-HPLC method allows for a sufficient separation of all carotenoids investigated in this study.
The analysis was carried out with a HPLC from HP 1100 system (Agilent Technologies) equipped with a diode array detector adjusted at 410 nm, a Prevail® C18 Supelco® guard column (5 μm C18, 7.5 × 4.6 mm) and a Suplex pKb-100 column (5 µm, 250 × 4.6 mm). The flow rate of the mobile phase was 0.5 ml min–1 and the column temperature was 20°C. The system was operated in the following gradient mode with phase A containing ACN, tBME and H2O (696:200:104; v/v/v) stabilised with 1000 mg l–1 BHT and phase B containing ACN and tBME (70:30; v/v). The mobile phase A was held at 100% for 10 min, then gradually decreased to 40% in the following 4 min. Mobile phase A was held at 40% for 14 min and from 28 to 45 min the system was re-equilibrated with the initial composition of mobile phase A. Finally, the concentration of the target analytes in the sample solutions was quantified by external linear calibration as described previously (Mitrowska et al. Citation2012).
Experimental design of the optimisation experiments
The experiments for the optimisation of the PLE conditions were conducted on a fish feed matrix fortified with formulations of astaxanthin and canthaxanthin. The target mass fraction of each analyte in compound feed was 200 mg kg–1, respectively. All samples were first subjected to the enzymatic digestion as specified above. In the next step the samples were extracted by PLE. Since the enzymatic reaction took place in an aqueous solution, the solvent selected for the subsequent PLE extraction needed to be soluble in water. Acetone meets this criterion, is widely used by laboratories and was therefore selected for the method. All optimisation experiments of the PLE were subsequently carried out with acetone.
The application of pressurised liquid extraction requires the selection of optimal settings of the following four parameters: extraction temperature; static time of extraction; flush volume (expressed as a % of the cell volume); and cycle number, which is the number of times the cell is heated and flushed. In this paper, a factorial design was applied to establish the influence of these parameters (factors) on the recovery rate of two analytes, namely astaxanthin and canthaxanthin. The specific approach was that each factor was varied at two levels. Since four factors were included in the study, the total number of combinations led to 16 different experiments. All experiments were conducted in duplicates in a random order, thus the total number of experiments was 32. The measured values of the recovery rate for the two target analytes were subsequently subjected to statistical assessment. The assessment delivers the effect of each factor. Finally, the significance (p = 0.05) of the calculated effects was assessed by taking into account the uncertainty of intermediate precision of the measurements calculated from the duplicate analyses of the 16 different experiments. The experimental frame of the factors was set taking into account general recommendations from the manufacturer of the PLE instrument used. Moreover, the extraction temperatures were set close to the conditions of the enzymatic reaction, which took place at 50°C. Therefore, the following conditions were used: 45 and 55°C for the extraction temperature, 2 and 10 min for the static time of extraction, 50% and 150% for the flush volume, and two and five cycles.
Subsequently, a second set of experiments was conducted exclusively modifying those factors that turned out to have the highest influence on the recovery rate of the target analytes in the previous experimental design. Also, the step size of these factors was reduced. More details are given in the results section.
The set-up of the experimental designs and the statistical evaluation was done with the commercial software package Statistica 10 (StatSoft Inc., Tulsa, OK, USA).
Once optimised extraction conditions were identified for canthaxanthin and astaxanthin, the method was subjected to single-laboratory validation to establish the method performance profile for all target analytes.
Single-laboratory validation
Precision and trueness
The precision of the method was determined according to ISO 5725-3 (ISO Citation1994) under repeatability conditions, where the experiments were performed on the same day, and under intermediate conditions where the experiments were distributed over different days. The obtained intermediate precisions were considered as fit for purpose if they were close to the range of the precision values reported in the EURL-FA reports of the single analyte/single product methods indicated in . Moreover, the obtained intermediate precisions should not be above 1.3 of the Horrat value, which is the ratio of the intermediate precision obtained in the validation study and the precision calculated by the Horwitz equation (Horwitz & Albert Citation2006). This criterion is included in Commission Decision 2002/657 (EC Citation2002) specifying the required performance of analytical methods for the determination of specific analytes in food of animal origin, but has been previously applied in the feed area as well (Vincent et al. Citation2008).
In this study, nine experiments were conducted for each selected concentration level, i.e., three replicates on 3 days. Moreover, feed test samples containing different feed additives such as M1, M2 and M4 but the same mass fraction of a specific carotenoid was equally distributed across the nine experiments and the measured concentrations were pooled. Therefore, the calculated estimates of the precision also include the contribution from the different feed additives to the variation of the results of analysis.
For the calculation of the repeatability standard deviation and the intermediate precision, the analytical results were subjected to analysis of variance (ANOVA) using the software package MINITABTM Statistical Software for Windows (Minitab Ltd, Coventry, UK).
The trueness of the method was estimated by the recovery rate calculated from the mean of the analytical results obtained in the precision experiments compared with the calculated content of the carotenoid in the feed taken from the spiking experiment of the test sample preparation. As mentioned above, commercial compound feed was used for the lowest level of canthaxanthin of 2.5 mg kg–1. This value corresponds to the content introduced via the added product, whereas a background level of the target analyte was not taken into account. Therefore, the corresponding analytical results obtained in the validation study were exclusively used for estimating the precision but not for the trueness of the method at this level.
Since there are no guidelines establishing fitness-for-purpose criteria for the trueness in the field of feed additive analysis, the EURL-FA set together with the network of national reference laboratories (NRLs) and in line with Commission Regulation (EC) No. 378/2005 (EU Citation2005) an acceptable range for the recovery rate between 80% and 120%.
Limit of detection and limit of quantification
The LOD was estimated applying the IUPAC Harmonised Guidelines for single-laboratory validation of methods of analysis (Thompson et al. Citation2002). It was taken as three times the intermediate precision obtained using the results from the nine experiments performed at the lower level of concentration for each analyte and each matrix. For the LOQ, the same approach was applied, but the intermediate precision was multiplied by 10.
Results and discussion
Method development
The results of the statistical assessment of the experimental design are shown for astaxanthin in and for canthaxanthin in . For both analytes the temperature and static time had the largest influence on the recovery rate. For instance, the average recovery rate for astaxanthin in all experiments conducted at 45°C was 76%, and the corresponding value for the experiments carried out a 55°C was 88%. Therefore, the effect of temperature on the recovery rate was 11%. Also, the effect of flush volume on the recovery rate of both analytes was significant, but smaller compared with the previous factors. In contrast, the effect of the number of cycles and all interactions of the factors turned out to be non-significant. When setting the temperature, static time and flush volume at the higher levels, high recovery rates of both analytes were obtained ranging from 94% to 99%. While this specific combination of the selected settings of the experimental parameters had already yielded very high recovery rates, a second factorial design close to the optimal settings was conducted in order to establish whether the same results could be obtained with lower extraction times and flush volumes. Especially the last factor was considered important, since the optimised method should be carried out with the lowest required volume of extraction solution. For instance, at 180 for the factor ‘flush %’ the solvent consumptions varied between 172 and 190 ml, whereas at 120 for the factor ‘flush %’ the solvent consumption varied between 144 and 150 ml.
Figure 2. Details of factorial design I for astaxanthin: means of the per cent recovery rates and the corresponding confidence interval (p = 0.95) obtained at the two levels of the extraction temperature, static time of extraction and flush volume, respectively.
Figure 3. Details of factorial design I for canthaxantin: means of the per cent recovery rates and the corresponding confidence interval (p = 0.95) obtained at the two levels of the extraction temperature, static time of extraction and flush volume, respectively.
The details of the second factorial are shown in . The variation of the cycle number was excluded from these trials, since this factor did not show a significant impact on the analytical results and was set at 3, i.e., between the two tested levels of 2 and 5. For the same reason also possible interactions were not assessed. Therefore, a reduced factorial design with eight experiments was performed, which was comprised of duplicates of four combinations of the selected factors. The results from the statistical assessment revealed that none of the three investigated factors had a significant effect on the recovery rate for astaxanthin, whereas small but significant effects of the factors static and flush on the recovery rate were observed for canthaxanthin. Moreover, the recovery rate for astaxanthin and canthaxanthin from all experiments was 96% and 101%, respectively. Since all combinations of the investigated factors led to high recovery rates, the final extraction conditions were selected by taking into account practical consideration, i.e., a preference for a short extraction time and a low consumption of extraction solvent. Therefore, the extraction time was set at 7 min and the flush volume was set at 120%. For the extraction temperature, 58°C was selected. All validation experiments were conducted by applying these conditions.
Table 3. Details of the factorial design II: factors that turned out to be significant in the previous factorial design were varied close to the optimal conditions established in the previous design. The number of cycles was set in all experiments at three, which was between the two levels of two and five. The significance level of the calculated effect was p = 0.05.
Single-laboratory validation
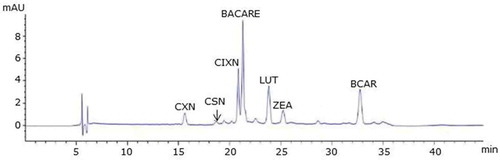
Typical examples of LC chromatograms obtained for fish and poultry feed by applying the optimised extraction conditions are shown in and , respectively. The chromatograms confirm that the target analytes are sufficiently separated to allow an identification and integration of the corresponding peaks.
Figure 4. Fish feed: RP-HPLC chromatograms of test feed samples as specified in : (a) M3 and (b) M1. AXN DMDS, astaxanthin dimethyldisuccinate; AXN, astaxanthin; CXN, canthaxanthin; ADR, adonirubin.
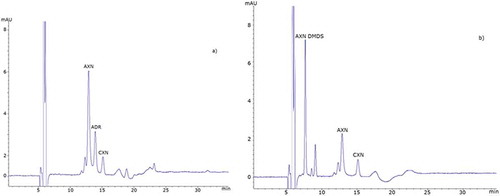
Figure 5. Poultry feed: RP-HPLC chromatograms of test feed samples as specified in . CXN, canthaxanthin; CSN, capsanthin; CIXN, citranaxanthin; BACARE, ethyl ester of beta-apo-8ʹ-carotenoic acid; LUT, lutein; BCAR, beta-carotene; ZEA, zeaxanthin.
LODs and LOQs
Estimates of the LOD and LOQ are displayed in . The LODs ranged from 0.69 to 10.2 mg kg–1 and the LOQs from 2.3 to 34.0 mg kg–1 depending of the analyte and the feed matrix. The large difference in the LODs and LOQs is due to the fact that the method protocol is adapted to the maximum content of the respective analyte. For instance, the maximum content of astaxanthin in fish feed is 100 mg kg–1 () and, therefore, the LOQ of 15 mg kg–1 is fit for purpose. In contrast, for canthaxantin in poultry feed the LOQ of 2.3 mg kg–1 was considered acceptable, since the maximum content of this compound in feed is 6 mg kg–1 () The comparison of the obtained LODs and LOQs with corresponding legal limits showed that the developed method is sensitive enough for the intended purpose.
Table 4. Limits of detection (LOD) and of quantification (LOQ) for each target analyte in poultry and fish feed expressed in mg kg–1 feed.
Precision
The results of the statistical analysis regarding the precision profile of the method and the recovery rates are presented in for poultry feed and in for fish feed. For poultry feed the relative standard deviation for intermediate precision (RSDint.pr) varied between 1% and 15%. For 21 out of 22 analyte/concentration combinations the RSDint.pr was below 10% and the corresponding Horrat value below 1.3, whereas for beta-carotene the RSDint.pr was 15% thus leading to Horrat values of 1.5 and, therefore, slightly above the target of 1.3. For fish feed the results were similar, since the RSDint.pr varied from 3.5% to 13%. Fifteen out of 18 analyte/concentration combinations had Horrat values below or equal to 1.3, whereas for astaxanthin at 50, 100 and 200 mg kg–1 the obtained values for the RSDint.pr were between 12% and 13% and the corresponding Horrat values varied from 1.4 to 1.7. While for these specific cases the target criterion was not met, the obtained precision profile of the multi-analyte method was nevertheless considered acceptable for the following two reasons. For the vast majority of the measured analyte/concentration combinations, namely 36 out of 40, the obtained Horrat values did not exceed 1.3. Moreover, the range of the RSDint.pr values obtained in the validation study was within the range of corresponding precision values of single-analyte methods for the determination of carotenoids in feed, previously evaluated by the EURL-FA ().
Table 5. Poultry feed: precision and trueness data of the method.
Table 6. Fish feed: precision and trueness data of the method.
Trueness
The obtained recovery rates are given in for poultry feed and in for fish feed. For 37 out of 40 cases, these values were in the accepted range between 80% and 120%, whereas for citranaxanthin in poultry feed the obtained recovery values varied from 124% to 129%. Given the complexity of the feed matrix and the multi-analyte nature of the procedure, the obtained estimates were still considered acceptable.
Conclusions
The multi-analyte method presented in this paper enables member states’ official control laboratories to quantify the mass fraction of all carotenoids authorised within the EU as feed additives in compound feed and to check for compliance with label information or the maximum content established by EU legislation. In cases in which the results of analysis applying the multi-analyte method confirm compliance with these provisions, samples do not need to be subjected to further investigations. Only for situations in which this analysis indicates an infringement of the provisions are subsequent confirmatory measurements required by applying the single analyte methods included in the legal act authorising the feed additive. This is a major advantage compared with the present situation in which official feed control laboratories have to apply in all cases various analytical methods depending on the specific carotenoid/product combination. This approach will also address the fact that for citranaxanthin the measured recovery rates were slightly above 120%.
Based on the successful results of the single-laboratory validation study, the method will be subjected in the next step to an inter-laboratory validation study to become a European standard for the determination of carotenoids in feedingstuffs.
Acknowledgments
The authors are grateful to their colleagues in the analytical working group of the FEFANA (European Union Association of Specialty Feed Ingredients and their Mixtures) for fruitful scientific discussions on the methodology of carotenoid analysis. Moreover, they thank Joseph Schierle, DSM Nutritional Products, Kaiseraugst, Switzerland, for his indispensable support when implementing the current methods for carotenoid analysis in our laboratory.
Disclosure statement
No potential conflict of interest was reported by the author(s).
References
- Amaya E, Becquet P, Carné S, Peris S, Miralles P 2014. Carotenoids in animal nutrition. FEFANA Available from: www.fefana.eu
- Breithaupt DE. 2004. Simultaneous HPLC determination of carotenoids used as food coloring additives: applicability of accelerated solvent extraction. Food Chem. 86:449–456.
- Britton G, Liaaen-Jensen S, Pfander H. 1995. Carotenoids Volume 1A: Isolation and Analysis. 81–107. Basel: Birkhaeuser Verlag. Chapter 5, Isolation and Analysis.
- EURL-FA Feed Additives. 2007a. Evaluation report on Astaxanthin dimethyldisuccinate. [ cited 2016 Aug 2]. Available from: https://ec.europa.eu/jrc/sites/default/files/FinRep-FAD-2006-0032.pdf
- EURL-FA Feed Additives. 2007b. Evaluation report on Panaferd-AX (Red carotenoid rich Paracoccus carotinifaciens). [ cited 2016 Aug 2]. Available from: https://ec.europa.eu/jrc/sites/default/files/FinRep-FAD-2006-0021.pdf
- EURL-FA Feed Additives. 2010a. Evaluation report on Astaxanthin (E161j). [ cited 2016 Aug 2]. Available from: https://ec.europa.eu/jrc/sites/default/files/FinRep-FAD-2009-0054.pdf
- EURL-FA Feed Additives. 2010b. Evaluation report on beta-carotene. [ cited 2016 Aug 2]. Available from: https://ec.europa.eu/jrc/sites/default/files/FinRep-FAD-2009-0046.pdf
- EURL-FA Feed Additives. 2011a. Evaluation report on Canthaxanthin. [ cited 2016 Aug 2]. Available from: https://ec.europa.eu/jrc/sites/default/files/FinRep-FAD-2008-0048.pdf
- EURL-FA Feed Additives. 2011b. Evaluation report on Carophyll Red (Canthaxanthin). [ cited 2016 Aug 2]. Available from: https://ec.europa.eu/jrc/sites/default/files/FinRep-FAD-2010-0407.pdf
- EURL-FA Feed Additives. 2011c. Evaluation report on Ethyl ester of beta-apo-8ʹ-carotenoic acid. [ cited 2016 Aug 2]. Available from: https://ec.europa.eu/jrc/sites/default/files/FinRep-FAD-2010-0224.pdf
- EURL-FA Feed Additives. 2012a. Evaluation report on Lutein (161b). [ cited 2016 Aug 2]. Available from: https://ec.europa.eu/jrc/sites/default/files/FinRep-FAD-2010-0372.pdf
- EURL-FA Feed Additives. 2012b. Evaluation report on Capsanthin. [ cited 2016 Aug 2]. Available from: https://ec.europa.eu/jrc/sites/default/files/FinRep-FAD-2010-0373.pdf
- EURL-FA Feed Additives. 2014. Evaluation report on Astaxanthin-rich Phaffia rhodozyma KBW 10061 (AJ 14971). [ cited 2016 Aug 2]. Available from: https://ec.europa.eu/jrc/sites/default/files/revisedfinrep-fad-2013-0032-Phaffia
- EURL-FA Feed Additives. 2016. Evaluation report on Citranaxanthin European Commission, JRC Directorate F – Health, Consumers and Reference Materials.
- European Commission. 2002. Commission Decision of 12 August 2002 implementing Council Directive 96/23/EC concerning the performance of analytical methods and the interpretation of results (2002/657/EC). Off J Euro Commun L. 221:8–36.
- European Union. 2009. Regulation (EC) No. 767/2009 of the European Parliament and of the Council of 13 July 2009 on the placing on the market and use of feed, amending European Parliament and Council Regulation (EC) No. 1831/2003 and repealing Council Directive 79/373/EEC, Commission Directive 80/511/EEC, Council Directives 82/471/EEC, 83/228/EEC, 93/74/EEC, 93/113/EC and 96/25/EC and Commission Decision 2004/217/EC. Off J Eur Union L. 229:1–48.
- European Commission. 2014. Commission Implementing Regulation (EU) 684/2014 of 20 June 2014 concerning the authorisation of canthaxanthin as a feed additive for breeder hens (holder of the authorisation DSM Nutritional products Ltd). Off J Eur Union L. 182:20–22.
- European Commission. 2016. European Union register of feed additives. [ cited 2016 Aug 2]. Available from: http://ec.europa.eu/food/safety/docs/animal-feed-eu-reg-comm_register_feed_additives_1831-03.pdf
- European Communities. 1970. Council Directive concerning additives in feeding-stuffs. 70/524/EEC. Off J Euro Commun. L 270:1.
- European Union. 2003. Regulation (EC) No. 1831/2003 of the European Parliament and the council of 22 September 2003 on additives for use in animal nutrition. Off J Eur Union. L 268 :29 as last amended by Commission Regulation (EU)2015/2294.
- European Union. 2005. Commission Regulation (EC) No. 378/2005 of 4 March 2005 on detailed rules for the implementation of Regulation (EC) No. 1831/2003 of the European Parliament and of the Council as regards the duties and tasks of the Community Reference Laboratory concerning applications for authorisations of feed additives. Off J Eur Union L. 59:8–15.
- Horwitz W, Albert R. 2006. The Horwitz ratio (HorRat): A useful index of method performance with respect to precision. J AOAC Int. 89:1095–1109.
- ISO 5725-3. 1994. Accuracy (trueness and precision) of Measurement Methods and Results – Part 3: Intermediate Measures of the Precision of a Standard Measurement Method. Geneva: ISO Standards.
- Mitrowska K, Vincent U, von Holst C. 2012. Separation and quantification of 15 carotenoids by reversed phase high performance liquid chromatography coupled to diode array detection with isosbestic wavelength approach. J Chromatogr A. 1233:44–:53.
- Mustafa A, Turner C. 2011. Pressurized liquid extraction as a green approach in food and herbal plants extraction: A review. Anal Chim Acta. 703:8–:18.
- Thompson M, Ellison SLR, Wood R. 2002. Harmonized guidelines for single-laboratory validation of methods of analysis (IUPAC Technical Report). Pure Appl Chem. 74:835–855.
- Vincent U, Chedin M, Yasar S, von Holst C. 2008. Determination of ionophore coccidiostats in feedingstuffs by liquid chromatography–tandem mass spectrometry. Part I. Application to targeted feed. J Pharm Biomed Anal. 47:750–757.
- von Holst C, Robouch P, Bellorini S, González de la Huebra MJ, Ezerskis Z. 2016. A review of the work of the EU Reference Laboratory supporting the authorisation process of feed additives in the EU. Food Addit Contam. 33:66–77.