

ABSTRACT
An increasing concern about food safety has been observed over the years. The presence of drugs residues in food is one of the major subjects of research in food safety. Feedingstuffs can be responsible for carryover into the food chain of residues of several drugs. This paper describes the development, validation and application of a fast and simple method for analysis of 24 antibiotic residues in feedingstuffs for cattle, pigs and poultry. Analytes include compounds from different antimicrobials classes, such as sulfonamides (sulfadiazine, sulfamethazine, sulfamethoxazole, sulfaquinoxaline, sulfachlorpyridazine, sulfadoxine, sulfadimethoxine, sulfizoxazole, sulfamerazine and sulfathiazole), fluoroquinolones (ciprofloxacin, enrofloxacin, norfloxacin, danofloxacin, difloxacin, sarafloxacin, flumequine, nalidixic acid and oxolinic acid), tetracyclines (tetracycline, doxycycline, oxytetracycline and chlortetracycline) and trimethoprim. Samples were extracted with methanol:water (70:30) 0.1% formic acid, followed by clean-up steps using centrifugation, low-temperature purification (LTP) and ultracentrifugation. Instrumental analysis was performed using liquid chromatography coupled to tandem mass spectrometry. Chromatographic separation was achieved using a C18 column and a mobile phase composed of acetonitrile and water, both with 0.1% formic acid. Validation parameters such as limit of detection (LOD), limit of quantification (LOQ), selectivity, linearity, accuracy, precision, decision limit (CCα) and detection capability (CCβ) were determined and meet the adopted criteria. LOD and LOQ were set to 30 and 75 µg kg−1, respectively. Inter-day precision were in the range from 4.0 to 11.1%, and linearity provides values of r2 above 0.95 for all analytes. The optimised method was applied to the analysis of more than 1500 real samples within the period 2012–2017. Non-compliant results were discussed and classified in terms of analytes, feed types and target species. Multivariate analysis of the data was performed using principal component analysis.
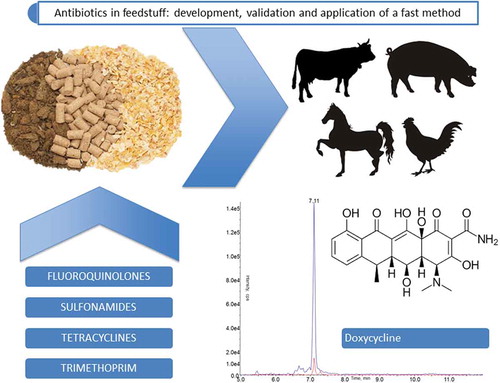
GRAPHICAL ABSTRACT
Acknowledgments
The authors thank the CAPES for the fellowship provided for Juliana Bazzan Arsand, and to National Council for Scientific and Technological Development (CNPq) for the fellowship provided to Magda Targa Martins.
Disclosure statement
No potential conflict of interest was reported by the authors.