
ABSTRACT
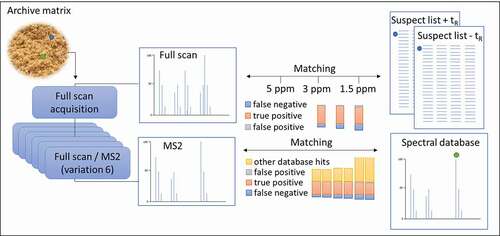
Monitoring strategies for veterinary drugs in products of animal origin are shifting towards a more risk-based approach. Such strategies not only target a limited number of predefined .substances but also facilitate detection of unexpected substances. By combining the use of archive matrices such as feather meal with suspect-screening methods, early detection of new hazards in the food and feed industry can be achieved. Effective application of such strategies is hampered by complex data interpretation and therefore, targeted data analysis is commonly applied. In this study, the performance of a suspect-screening data processing workflow using a suspect list or the online spectral database mzCloudTM was explored to facilitate detection of veterinary drugs in archive matrices. Data evaluation parameters specifically investigated for application of a suspect list were mass tolerance and the addition or omission of retention times. Application of a mass tolerance of 1.5 ppm leads to an increase in the number of false positives, as does omission of retention times in the suspect list. Different acquisition modes yielding different qualities of MS2 data were studied and proved to be a critical factor, where data-dependent acquisition is preferred when matching to the mzCloudTM database. Using this approach, it is possible to search for compounds on a dedicated suspect list based on the exact mass and retention times and, at the same time, detect unexpected compounds without a priori information. A pilot study was conducted and fourteen different antibiotics were detected (and confirmed by MS/MS). Three of these antibiotics were not included in the suspect list. The optimised suspect-screening method proved to be fit for the purpose of finding veterinary drugs in feather meal, which are not in the scope of the current monitoring methods and therefore, it gives added value in the perspective of a risk-based monitoring.
Introduction
For years, targeted analysis by liquid chromatography tandem mass spectrometry (LC-MS/MS) has been used to monitor specific veterinary drugs in products of animal origin. The selection of compounds and matrices in the European Union is mostly based on national production figures as described in regulations enforcing monitoring using established maximum residue limits (MRLs) (European Commission Citation2009, Citation2017).
During the last decade, different approaches for detection of veterinary drugs proved to be necessary as a result of increasing antimicrobial resistance. Besides the detection of MRL violations in food products of animal origin, the detection of antibiotic use in general also became apparent. As a result, new approaches were developed for residue detection in archive matrices, in which veterinary drugs remain detectable for a longer period of time. With the aim of detection antibiotic use, feather analysis has proven to be advantageous over routinely analysed food matrices like meat or kidney (San Martín et al. Citation2007; Cornejo et al. Citation2011; Berendsen et al. Citation2013; Jansen et al. Citation2016; Pokrant et al. Citation2018). Moreover, feather meal is of interest because this does not represent a single animal but a whole sector and potentially reflects antibiotic usage patterns in a specific region.
Besides the research of new matrices, monitoring strategies started shifting towards a non-targeted, more risk-based approach, as is mandatory according to the official controls regulation (EU) 2017/625 (European Commission Citation2017). Part of such a risk-based approach is not only targeting known substances but also searching for unexpected substances. This shift has pushed the use of high-resolution mass spectrometry (HRMS). HRMS was already recognised as a valuable tool in residue analysis of veterinary drugs, enabling untargeted measurement with high resolution and high mass accuracy (Kaufmann et al. Citation2010).
The untargeted measurement using LC-HRMS offers the possibility to expand the scope of the currently applied targeted approaches in residue analysis of veterinary drugs to a (theoretically) infinite number of substances (Kaufmann Citation2020). Also, it facilitates retrospective analysis. Since not only the pre-defined masses belonging to expected compounds but also all ions are recorded in a single run, this enables untargeted data analysis and thus facilitates searching for signals of unexpected compounds.
One approach for processing untargeted data is suspect screening. This is attractive because it is a data processing approach in which reference standards are not a necessity (Caballero-Casero et al., Citation2021; Pourchet et al. Citation2020). We advocate that applying suspect screening to archive matrices could greatly advance the early detection of the application of unexpected veterinary drugs.
Suspect-screening workflows and other untargeted processing approaches, such as non-targeted screening, were mainly used in environmental studies and mainly applied on water analysis. Recently, the number of studies using suspect screening to investigate more complex matrices has been increasing. These studies show that suspect screening is a strong tool to use as an initial step to screen a diversity of matrices for emerging contaminants, including veterinary drugs, which otherwise would have remained undetected because they were outside the scope of the targeted monitoring methods (Solliec et al. Citation2015; Du et al. Citation2017; Fabresse et al. Citation2019; von Eyken and Bayen Citation2019; Guo et al. Citation2020). Some studies also investigated the potential of data reduction strategies (Knolhoff and Fisher Citation2021) or tested the effect of specific acquisition modes on data analysis performance (Wu et al. Citation2020; Sun et al. Citation2021). However, studies that investigate the performance of suspect-screening workflow strategies for the detection of veterinary drugs in complex matrices are still scarce.
In the current research, no inclusion list with predefined masses was used during analysis. Two suspect-screening data processing workflows were designed to facilitate detection of potential unexpected veterinary drugs in the complex matrices in animal feed and feather meal. One is a data processing workflow based on an in-house created suspect list and the other is a workflow using the online spectral database mzCloudTM. Several parameters were assessed and optimised that potentially influence the data processing with respect to the quality of the detected suspects in terms of false positives and false negatives. This includes the resolution, acquisition modes (all ion fragmentation (AIF), variable data-independent analysis (vDIA) and data-dependent analysis (DDA)) and the need for a priori retention time determination. The optimised method was then applied to feather meal samples as proof of principle.
To our knowledge, this is the first time a suspect list screening approach and the application of mzCloudTM have been systematically explored and compared for application of the screening of veterinary drugs in archive matrices and animal feed. We believe that the outcomes facilitate the implementation of effective suspect-screening approaches for routine application in the food safety field.
Materials and methods
Chemicals and reagents
ULC grade methanol, acetonitrile and water were obtained from Actu-All Chemicals (Oss, The Netherlands). Formic acid, acetic acid, citric acid monohydrate, sodium hydroxide, disodium hydrogen phosphate dihydrate, sodium acetate and disodium ethylenediaminetetraacetic acid (EDTA) were obtained from VWR International (Darmstadt, Germany). Magnesium sulphate and trifluoroacetic acid (TFA) were obtained from Sigma-Aldrich (St. Louis, MO. United States).
McIlvain-EDTA buffer was prepared by dissolving 74.4 g of disodium EDTA in 500 mL of a 0.1 M citric acid solution and 280 mL of a 0.2 M phosphate buffer. The pH was adjusted to 4.0 by adding 0.1 M citric acid solution or 0.2 M phosphate buffer. After reaching pH 4.0, the total volume was adjusted to 2 L with water.
A standard mix solution was prepared in methanol/water (50/50%), containing 114 veterinary drugs at varying concentrations (20 to 4000 µg L−1). It was known that detection at this concentration is possible with the system used. The concentration for each compound and information regarding the origin and purity of the reference standards are recorded in Online Resource 1.
Preparation of fortified animal feed and feather meal
Fortified animal feed and feather meal samples containing veterinary drugs were prepared by weighing 5 g of drug-free material into a 50 mL PP tube (Greiner, Bio-One, Alphen aan de Rijn, The Netherlands) and adding 5 mL of water. Subsequently, 10 mL of a 1% acetic acid in acetonitrile solution was added. Tubes were shaken thoroughly and extracted using a head-over-head apparatus (Heidolph REAX-2, Schwabach, Germany) for 30 minutes. Water was removed from the solution by adding 4 g of magnesium sulphate and 1 g of sodium acetate and shaking thoroughly. Samples were then centrifuged for 5 min at room temperature (3500 g, Biofuge Stratos centrifuge, Heraeus instruments, Germany). The supernatant was transferred to a 12 mL glass tube and the solvent was evaporated (40°C, N2) using a TurboVap LV Evaporator (Zymark, Hopkinton, Ma, USA). Finally, extracts were reconstituted in 500 µL of the standard mix solution (in methanol/water 50/50%) containing the 114 veterinary drugs. The concentration of the veterinary drugs in the final extract is presented in Online Resource 1.
Instrumentation
Liquid Chromatography HighResolution Mass Spectrometry (LC-HRMS) analysis was performed in all cases using an Ultimate 3000 UHPLC system, which was coupled to a Q-Exactive OrbitrapTM system with a HESI-II electrospray source (Thermo Scientific, San Jose, CA, USA). The system was controlled using the software packages Xcalibur, Chromeleon MS Link and Q-Exactive Tune.
Chromatographic separation was performed using an Atlantis T3 (100 x 3 mm, 3 µm particles) analytical column (Waters, Milford, MA, USA) at a column temperature of 40°C. The mobile phases used were 2 mM ammonium formate and 0.16% formic acid prepared in water (solvent A) and in MeOH (solvent B). Operating at a flow rate of 0.3 mL min−1, the used gradient was 0–0.1 min, 0% B, 0.1–2.0 min, a linear increase to 45% B followed by a linear increase to 100% B from 2.0–8 min with a final hold of 9.5 min and an equilibration time of 5 min. The total runtime was 23 min and the injection volume was 5 µL.
Instrument calibration was performed before every analysis, using a Pierce LTQ ESI positive ion calibration solution (Thermo Scientific) and with a maximum mass deviation of 1 ppm. Chromatographic and overall system performance was checked by analysing a standard solution before analysis and comparing mass accuracy, retention time and intensity with previously acquired performance test data.
Data processing software
Data processing was performed using Compound Discoverer 3.1. (Thermo Scientific). Compound Discoverer is commercially available small molecule structure identification software, using accurate mass data, isotope pattern matching and mass spectral database searches. The 3.1 version supports using all ion fragmentation (AIF) and (variable) data-independent acquisition ((v)DIA) in addition to data-dependent acquisition (DDA) data to search against the mzCloudTM database ([LLC H] HighChem LLC, Citation2018).
The mzCloudTM database is a mass spectral database for the identification of small molecules using tandem mass spectrometry. The database currently includes a freely accessible collection of over 18,500 compounds and over 7 million high-resolution/accurate mass spectra (HighChem LLC, Citation2018) (accessed: October 2020).
Data acquisition
The performance and possibilities in data processing are influenced by settings applied for data acquisition. The resolution or the choice between data-dependent or data-independent MS2 acquisition, for example, influences the number of scans over a peak, which might affect peak detection by the processing software (Wu et al. Citation2020). In order to explore the effects of these settings, different data acquisition settings were evaluated using the standard mix solution and fortified feather meal and animal feed.
The standard mix solution and fortified animal feed and feather meal matrix were injected into the LC system in duplicate and analysed using different acquisition methods (AMs). The duplicates were analysed subsequently and were not used for data processing purposes but rather to secure correct injection and to check consistency. In each analysis, 5 solvent blanks (methanol/water (50/50%)) were injected to use during data processing as a solvent background filter.
In the processing software Compound Discoverer, peak detection is done using full scan (FS) data. Therefore, a FS-only acquisition was performed first at a resolution of 140,000 (highest possible for the used system), defined at FWHM m/z 200. The mass range was m/z 80–1075.
Besides the FS-only acquisition, different options for AMs were investigated by combining FS acquisition with different types of fragmentation (MS2) either variable data-independent acquisition (vDIA) or all-ion fragmentation (AIF) in combination with data-dependent acquisition (DDA). A total of 6 different AMs were investigated, which also include different resolution settings. The different AMs are presented in .
Table 1. The tested acquisition methods (AMs) using different resolution settings, based on combinations of FS analysis with vDIA, where the number of mass ranges (DIAs) used are shown in brackets or with AIF in combination with DDA
The vDIA methods were based on the method described by Zomer and Mol (Citation2015) and include several consecutive scan events. The vDIA methods (AM 1, 2 and 4) have 5 consecutive scan events with precursor ion ranges of m/z 75–205, 195–305, 295–405, 395–505 and 495–1085. For AM 3, the number of vDIA scan events was decreased from 5 to 3, in order to increase the number of points per chromatographic peak. This method had precursor ion ranges of m/z 75–415, 410–750 and 745–1085. For methods 5 and 6, the mass range for AIF was m/z 80–1075. DDA was set to select the 5 most abundant signals of each scan cycle with a dynamic exclusion time of 10 seconds.
During this research, no inclusion list, a list of masses to select for MS2, were used in the analysis. Also, no ‘exclusion lists’ were used in any of the DDA methods. An exclusion list gives the possibility to select background ions and exclude these for DDA scans to increase the chance of obtaining relevant MS2 spectra for a specific sample. A risk of excluding signals preliminary to data processing is the loss of possible masses of interest. The same risk is present when no exclusion list is used, where the masses of complex matrix could be selected for fragmentation instead of the masses of interest. We first chose to observe the results without the use of an exclusion list as this requires the least a priori input and is independent of the system used or matrices investigated.
All fragmentation modes were obtained using a stepped collision energy at 30 and 80 NCE. For all FS and vDIA scan events, the C-trap parameter AGC target was set to 1 x 10⁶, for the DD top 5 scan events, which was 8 × 10³ with a maximum inject time of 200 ms.
In all cases, data were not subjected to retention time correction or mass correction preliminary to data processing, by means of, for example, QC samples or ‘lock masses’.
Data processing
After data acquisition, the 5 solvents and duplicate fortified feed and feather meal samples were processed using Compound Discoverer. The processing time depends on the acquisition method used, but was at most 1 hour and 40 minutes. In Compound Discoverer, data are processed by means of a ‘workflow’. The workflow consists of different sections in which different parameters can be set. Two different suspect-screening workflows were created: a workflow where matching is based on an in-house created suspect list and a workflow using the online spectral database mzCloudTM. The two workflows match data in a different way; Compound Discoverer only uses FS data for peak matching to a suspect list, whilst it uses MS2 data to match with the mzCloudTM database. Therefore, it was necessary to evaluate different data processing parameters for each workflow.
Workflow using a suspect list
The workflow using an in-house created suspect list is shown in . In Compound Discoverer, a suspect list is called a ‘mass list’ and can be added to the workflow in section 3 ‘Search Mass Lists’ of . A suspect list might contain only the elemental composition, but additional input such as retention time and structural information can also be added.
Figure 1. Suspect screening workflow using a suspect list, where the blue sections indicate where specific parameters were varied for data processing; (1) ‘Detect compounds’ that search the FS spectra for mass peaks, (2) ‘Assign compound annotations’ that select data sources of choice for the names showing in the list of found peaks (name, formula and structure), and (3) ‘Search mass lists’ that make the programsearch the suspect lists for masses that match the detected compounds.
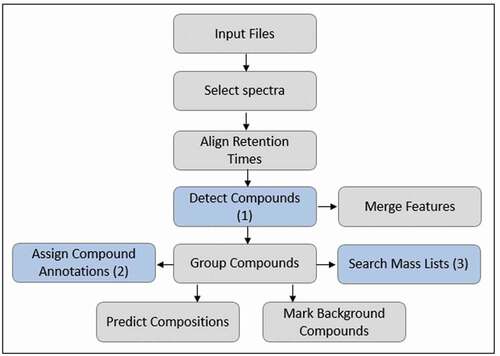
Tested parameters that might affect data processing using a suspect list are the mass tolerance, which can be set in different places in the software, and the addition of retention times to the suspect list. The acquired FS-only data (resolution = 140 k) of the standard mix solution and fortified feed and feather meal were used to test the effect of mass tolerance and added retention time on the matching of peaks, as this is influenced by FS data only.
The mass tolerance was alternately varied by changing the ppm error to 1.5, 3 or 5 ppm in the three highlighted sections of the workflow shown in . This resulted in a total of 12 different variations of workflows using a suspect list. An overview of all the settings per workflow for this test is shown in Online Resource 2. The FS data were processed using these 12 workflows and results were compared.
In order to test the effect of added retention times, a suspect list was prepared containing only the elemental composition of the compounds in the standard mix solution (see Online Resource 1) and a second suspect list was prepared including the retention times of the compounds. The FS data were first processed using a workflow with the suspect list without retention times and then reprocessed using a workflow with retention times and results were compared.
After testing above parameters based on FS data, the six different AMs combining the FS and MS2 data were processed using the workflow with optimised settings. These AMs were tested because the differences in AM could influence the quality of data and therefore the matching of peaks. The results obtained using this workflow on data of different AMs were also compared with results based on another suspect-screening workflow, which uses spectral database mzCloudTM instead of a suspect list.
Workflow using the mzCloudTM database
For the purpose of matching data to a spectral database, another workflow was prepared, which is shown in . In this workflow, instead of the ‘search mass lists’ section, the ‘search mzCloudTM’ section was added, which makes Compound Discoverer search the online mzCloudTM spectral database for a match with the MS2 data.
Figure 2. Suspect screening workflow using mzCloudTM, where the addition of the node makes the program search the online mzCloudTM database for matches with the found MS2 spectra.
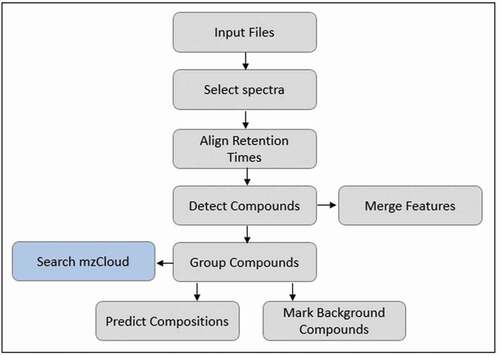
The six different AMs contain a different FS and MS2 resolution and/or type of MS2 data. As this is one of the parameters that is expected to influence matching to the mzCloudTM database, these were tested. The data of six different AMs were processed using the mzCloudTM workflow in and compared.
Data evaluation
After processing data using Compound Discoverer, a list of detected peaks is presented. The list comprises a number of detected peaks, each with merged isotopes and adducts, also called features. The 5 solvent blanks, which were included in each analysis, were used to reduce the number of features in the list by only retaining peaks, which were at least 5 times higher than the corresponding peaks in the solvent background data.
For the standard mix solution and fortified matrices, data were evaluated by comparing the number of true positives, false positives and false negatives found for each tested parameter or workflow. How these were determined is slightly different for the two workflows.
Workflow using a suspect list
When a feature has a match with a compound in the suspect list, this is called a ‘suspect list hit’. This is based on a match of the exact mass and potentially the retention time (the tolerance was set to ±0.1 min). The chromatograms of these suspect list hits were visually inspected on actually showing a peak at the correct retention time.
As only compounds in the standard solvent mix and fortified matrices are in the suspect list, a ‘true positive’ is defined as a correct suspect list hit. In case a feature was incorrectly assigned by the software (e.g. because a signal at an incorrect retention time is detected or if only noise is integrated) as a suspect list hit, this was considered a ‘false positive’. The compounds that were present in the standard solvent mix and fortified matrices, but were not assigned as a suspect list hit, were considered ‘false negative’.
Workflow using the mzCloudTM database
When a feature is matched to a compound present in the mzCloudTM database, this is called an ‘mzCloudTM hit’. All mzCloudTM hits were taken into consideration. The mzCloudTM hit list was exported to Excel (Microsoft Office 2019, Washington, USA) to evaluate the number of substances present in standard mix solution and the fortified matrices that were found to be true and false positives. A true positive in this case is determined by checking if a substance name is correctly assigned to a feature detected with the correct exact mass and at the expected retention time for that specific substance. A false positive is defined as an mzCloudTM hit, which was listed for a detected peak at an incorrect retention time. If an mzCloudTM hit was listed for a substance, which is not present in the standard mix solution, this would also be a false positive. However, this could not be assessed for the fortified matrices because these contain other substances besides the ones in the standard mix solution. Therefore, the mzCloudTM hits that indicate the presence of a substance found in the fortified feather meal and feed samples, but which are not explicitly part of this study (not present in the standard mix solution), could originate from the fact that they are originally present in the sample (e.g. specific natural compounds originating from feed commodities). For this test, all mzCloudTM hits that were not assigned as true or false positives are called ‘other mzCloudTM hits’. A result was called a false negative if a substance was present in the standard mix solution or fortified samples, but was not detected or if the name was assigned incorrectly.
Results and discussion
Effect of mass tolerance and retention time using a suspect list
The mass tolerance was varied in three places in the workflow using the suspect list () and detected peaks were matched to the suspect list including and excluding retention times. It was found that the mass tolerance was only a critical parameter in Section 1 ‘detect compounds’. Increasing or decreasing the mass tolerance in Sections 2 and 3 of the workflow did not show any change in results. The number of true positives, false positives and false negatives as a result of varying the mass tolerance in Section 1 for the use of a suspect list both with and without retention time is presented in .
Figure 3. The effect of the mass tolerance (resolution = 140,000) set to 5, 3 or 1.5 ppm (in duplicate (a and b)) on the number of false positives, true positives and false negatives (expressed as a negative number in this bar graph) found in the standard mix solution, fortified animal feed and feather meal using a suspect list with and without retention times (tR). The total number of substances in the standard mix solution is 114.
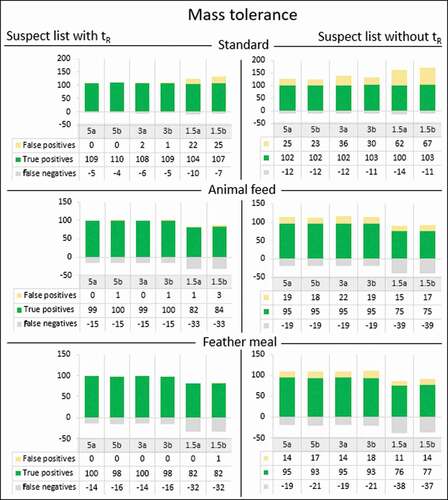
The results in show that the number of true positives found in the standard mix solution is between 100 and 110, respectively, for 88 and 96% of the compounds in the standard mix solution. The number of true positives found for the fortified animal feed and feather meal is 66–88% and 67–88%, respectively. When comparing the results when using a suspect list with or without retention times, the results in show that omitting the retention times results in a higher false positive rate. This is to be expected, because when retention time is omitted from the suspect list, an important identification factor is lost and isomeric compounds cannot be discriminated.
The success rate of the substance assignment in the standard mix solution is high, especially when using the retention time. Unexpectedly, at 1.5 ppm mass tolerance, the number of false positives in the standard mix solution increases. When decreasing the mass tolerance, a few scan points in a substance peak may fall outside the 1.5 ppm window due to the regular uncertainty in the mass measurements. Compound Discoverer will then split the detected peak into multiple peaks and thus into multiple features, which all comply with the substance assignment criterion. Through this effect, not only the number of total features but also the number of false positives are increased, as there will be multiple suspect list hits instead of one. Possibly, the number of false positives and false negatives caused by this effect could be decreased by applying even higher resolution settings (if possible).
Another observation is that for both fortified matrices, the number of true positives clearly decreases when the mass tolerance is set to 1.5 ppm. Some of the substances were not detected in the matrix (false negative), whereas they were detected in the standard mix solution. This is most likely caused by the sensitivity of these compounds in the matrix (e.g. by matrix suppression) and a less accurate mass assignment in the presence of the matrix.
Based on the data in this study, it is recommended to use a mass tolerance of 5 ppm or 3 ppm. With the currently used settings, the use of a lower mass tolerance has a detrimental effect that is related to the mass accuracy (and thus resolution) achieved by the instrument. The application of a retention time in the suspect list in the assignment of features leads to more correct feature assignment and aids in lowering the false positive rate.
Comparison of the suspect list and mzCloudTM database workflows
Different acquisition modes were evaluated and the numbers of true positives, false negatives and false positives were compared. This was done using either the workflow with suspect list (including retention times and 5 ppm mass tolerance) or the workflow with the mzCloudTM database. For the latter, the number of other mzCloudTM hits was also compared for the standard mix solution and fortified feed and feather meal. The results are shown in .
Figure 4. The number of true positives, false negatives and false positives in standard mix solution, fortified animal feed and feather meal matrix based on 6 different acquisition methods using either a suspect list workflow (including retention times (±0.1 min), 5 ppm mass tolerance) or the mzCloudTM database. Using the latter, the number of other mzCloudTM hits was also evaluated.
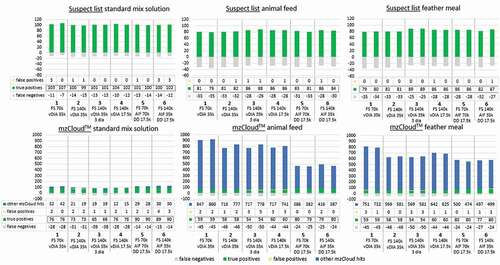
When using the suspect list for feature assignment, 87–91% of the 114 compounds were found in the standard mix solution, 69–77% in the fortified animal feed and 69–78% in the fortified feather meal. There are only minor differences observed among different AMs applied, which confirms that the AM is not a highly critical parameter when using a suspect list since feature assignments are done based on FS data when using a suspect list. The (minor) effect of AM setting is most pronounced looking at the outcomes for animal feed and feather meal. The number of true positives does not seem to be influenced by increasing resolution directly, as AM with 140,000 resolution does not always yield more true positives (AM 1 vs. AM 2). A reduction of the number of DIA windows (AM 3) or a lower MS2 resolution (AM 4–6) does seem to increase the number of true positives. The improvement is most likely the result of a shorter scan cycle time, which gives an increase in the number of data points for a single peak. This yields higher quality chromatograms and thus leads to improved assignments (Wu et al. Citation2020). When considering the duplicates, only a small variation is observed for the true positives, false positives and the false negatives.
When using the mzCloudTM database for feature assignment, 70–87% of the compounds were found in the standard mix solution and 52–77% in both animal feed and feather meal. Note that the mzCloudTM database currently includes over 18,000 compounds ([LLC H] HighChem LLC, Citation2018) (accessed: October 2020), but does not include all of the compounds present in the standard mix solution. This was taken into account when evaluating the mzCloudTM results. A manual search was made to find the substances in the standard mix solution that were not included in the mzCloudTM database and these were not taken into consideration. These substances are indicated in Online Resource 1.
Independent of the AM applied, the use of the mzCloudTM database did not result in a large increase of false positives compared to using a dedicated suspect list including retention times, whereas this was the case when retention times were omitted in the suspect list. The largest increase was with 2 to 4 false positives for AM 3. Clearly, compared to only FS matching based on the suspect list, the addition of MS2 data (be it from vDIA of DDA) significantly decreases the number of false positives, which is in line with previously published research (Chao et al. Citation2020). This means that, in terms of false positives, addition of MS2 data matching compensates for the lack of a retention time in a suspect list.
In regard to the true positive/false negative rate when using mzCloudTM, clear differences between the different AMs are seen, which was less the case using the suspect list. The differences in the MS2 data quality already become apparent from the standard mix solution data. The methods combining AIF with DDA (AM 5 and 6) clearly yield the highest true-positive and lowest false-negative rates. As matching to the mzCloudTM database is done using MS2 data, a prerequisite for the effective use of mzCloudTM is the recording of clean MS2 spectra, yielding high-quality data. The true positive/false negative rate using DDA (AM 5 and 6) is similar for mzCloudTM application and the use of a dedicated suspect list including retention times. This is not the case when applying vDIA, which yields fewer true positives in the mzCloud search compared to the dedicated suspect list. Evidently, DDA is required to obtain sufficiently high-quality MS2 data for mzCloudTM matching. The beneficial outcomes of DDA are in agreement with results reported by Wu et al. (Citation2020).
Another observation when considering the mzCloudTM data output is the difference in the number of ‘other mzCloudTM hits’ for the animal feed and feather meal. It is observed that, especially for animal feed, the number of other mzCloudTM hits is lower when using DDA compared to vDIA. This is also attributed to the higher MS2 data quality that is obtained by DDA compared to vDIA. To further support this observation, for DDA, the substances found in the fortified matrix had a 63.3–99.6% match with mzCloudTM. When using vDIA, this was 30.0 to 97.5%. Therefore, high-quality DDA data will also be beneficial for effective suspect screening when taking into account these other mzCloudTM hits. The number of other mzCloudTM hits in some cases differs between duplicates. Therefore, to increase data reduction options, analysing samples in duplicate is seen as an advantage.
In order to prevent the loss of valuable signals, when, for example, using data for retrospective analysis, the combination of AIF and DDA is essential. By combining these two, the masses not selected for DDA top 5 analysis will still be recorded in the AIF scan event, although the spectra will be less specific. Compared to AIF, vDIA has cleaner spectra and would be better to use. Unfortunately, the combination of FS, vDIA and DDA at the required resolution is not possible with the system used in the current study, considering the required scan cycle frequency. If a system that has increased scan speed is available, it is recommended to replace AIF by vDIA. Research applying combinations of vDIA and DDA using such a system already showed promising results (Sun et al. Citation2021).
When taking into account the results of both suspect list and mzCloudTM workflows, it would be optimal to combine both into a single workflow. The true positive rate using mzCloudTM and the suspect list that includes retention times is comparable. The addition of MS2 data matching using the mzCloudTM database to the workflow compensates for the lack of a retention time data in a suspect list. Being able to omit retention times also eliminates the need for a priori access to a reference standard. This opens up the possibility to easily add new compounds of interest to the suspect-screening method and, at the same time, the workflow allows the effective search for ‘target’ compounds on a suspect list that includes retention times. The following is required in order to effectively combine these two workflows: (1) high-quality FS (high resolution) data, (2) high-quality MS2 data and (3) an adequate number of scans per peak. Therefore, AM 6 was selected and a combined workflow was applied to imported feather meal samples as a proof of principle.
Proof of principle on feather meal samples
Feather meal samples that had a high risk of containing antibiotics were applied to conduct a proof of principle for the optimised suspect-screening method. In this proof of principle, the focus is on the antibiotic compounds. A total of 7 feather meal samples were prepared by a method described for feathers (Jansen et al. Citation2017). The samples were then analysed using AM 6 and the data were processed using a combination of the two evaluated workflows, including optimised parameters. The combined workflow is shown in Online Resource 3.
The samples were processed together with 5 solvents to extract background signals, as was also done for the fortified samples. Samples were also analysed using LC-MS/MS to check for tetracyclines, quinolones, macrolides, lincosamides, pleuromutilins and sulphonamides, according to the settings described by Jansen et al. (Citation2017).
Interestingly, by applying the suspect-screening workflow, a lot of different antibiotics were found in the imported feather meal samples. In , the suspect-screening results in combination with the LC-MS/MS data are shown. For the suspect-screening method, it is shown whether a compound was found using a suspect list hit, mzCloudTM hit or both. Concentrations shown are based on the LC-MS/MS analysis. In some cases, a compound was detected using the LC-MS/MS method but not in the suspect screening. This is to be expected, as lower concentrations can be achieved using LC-MS/MS compared to LC-HRMS. This also indicates the boundaries when using the suspect-screening method for these antibiotics in terms of concentration.
Table 2. Antibiotics found in imported feather meal samples, with determined concentrations (µg kg−1) of confirmed compounds by LC-MS/MS and indications whether the compound had a suspect list hit (a) and/or mzCloudTM hit (b) in suspect screening. Found compounds that were not in the scope of the LC-MS/MS analysis but were confirmed according to 2002/657/EC are indicated with an ‘x’
For two compounds, ciprofloxacin in samples 1, 3 and 5 and sulfamethoxazole in sample 6, there was a suspect list hit, but no mzCloudTM hit was found. This could be an indication that the found suspect list match is false positive. In the experiments with fortified material, it was shown that mzCloudTM contributes to the elimination of false positives. However, in cases where there is a large difference in intensity of the FS and MS2 spectrum, it is possible that the FS intensity is sufficient and the DD MS2 is not, resulting in a suspect list hit but not an mzCloudTM hit. This was the case for ciprofloxacin. In the case of sulfamethoxazole, the mass was not in the top 5 abundances and therefore not selected for MS2 fragmentation. Therefore, MS2 matching to the mzCloudTM database was done based on the AIF spectrum. As shown in the experiments with fortified material, these spectra contain too many fragments originating from other compounds to get a hit with the mzCloudTM database.
Three compounds were found using the suspect-screening method based on only an mzCloudTM hit, azithromycin, a macrolide antibiotic and gatifloxacin and levofloxacin, both fluoroquinolones. These compounds were not included in the suspect list or in the scope of the routine LC-MS/MS monitoring method. Standards were bought and the identity of all three compounds was confirmed according to 2002/657/EC (European Commission Citation2002). This shows the success of combining a dedicated suspect list with an online spectral database such as mzCloudTM.
Conclusions
In this study, suspect screening using a suspect list workflow and a spectral library mzCloudTM workflow were evaluated and it was found that these two workflows complement each other and are best combined. Specific parameters were successfully optimised. For the suspect list, the mass tolerance and the effect of a retention time criterion were studied and found to have a large impact on the number of true positives and false positives found in suspect screening. It is advised not to apply a very strict mass tolerance (< 3 ppm) to facilitate adequate peak description. When using suspect screening in FS based on a dedicated suspect list, the inclusion of retention time information is beneficial to limit the number of potentially relevant hits. When using the mzCloudTM workflow, high-quality MS2 data are required and yield similar identification power to a retention time criterion. The optimal acquisition mode for this workflow was found to be FS in combination with AIF and DDA, where at relevant concentration levels for residue analysis, 87% of the compounds were correctly detected in the standard mix solution and 77% in both animal feed and feather meal. Preferably, AIF is replaced by vDIA when using more advanced LC-HRMS systems with higher scan speed. The true positive rates using mzCloudTM and the suspect list workflow are comparable, with the advantage that for application of mzCloudTM, no retention time data are required, eliminating the need for access to a reference standard. The optimised workflow, using both suspect list and mzCloudTM, was tested in a proof of principle on imported feather meal samples, where three antibiotics, which were at first included neither in the routine LC-MS/MS method nor in the suspect list, were confirmed using LC-MS/MS analysis. These findings show that the developed suspect-screening method is fit for the purpose of finding antibiotics in feather meal, which are not in the scope of the current monitoring methods. The developed strategy thus can be applied for risk-based monitoring.
Supplemental Material
Download MS Word (113.1 KB)Disclosure statement
No potential conflict of interest was reported by the author(s).
Supplementary material
Supplemental data for this article can be accessed on the publisher’s website.
Additional information
Funding
References
- [EC] European Commission. 2002. Commission decision 2002/657/EC. Off J Eur Union. L221:8–36.
- [EC] European Commission. 2009. Regulation (EU) 37/2010. Off J Eur Union. L15:1–72.
- [EC] European Commission. 2017. (EU) 2017/625. Off J Eur Union. L95:1–142.
- [LLC H] HighChem LLC. 2018 . mzCloud advanced mass spectral database. https://wwwmzcloudorg/.
- Berendsen BJA, Bor G, Gerritsen HW, Jansen LJM, Zuidema T. 2013. The disposition of oxytetracycline to feathers after poultry treatment. Food Add Contam A. 30(12):2102–2107. doi:https://doi.org/10.1080/19440049.2013.843026.
- Caballero-Casero N, Belova L, Vervliet P, Antignac J-P, Castaño A, Debrauwer L, López ME, Huber C, Klanova J, and Krauss M, et al. 2021. Towards harmonised criteria in quality assurance and quality control of suspect and non-target LC-HRMS analytical workflows for screening of emerging contaminants in human biomonitoring. Trends Anal Chem. 136:116201. doi:https://doi.org/10.1016/j.trac.2021.116201.
- Chao A, Al-Ghoul H, McEachran AD, Balabin I, Transue T, Cathey T, Grossman JN, Singh RR, Ulrich EM, Williams AJ, et al. 2020. In silico MS/MS spectra for identifying unknowns: a critical examination using CFM-ID algorithms and ENTACT mixture samples. Anal Bioanal Chem. 412(6):1303–1315. doi:https://doi.org/10.1007/s00216-019-02351-7
- Cornejo J, Lapierre L, Iragüen D, Pizarro N, Hidalgo H, San Martín B. 2011. Depletion study of three formulations of flumequine in edible tissues and drug transfer into chicken feathers. J Vet Pharmacol Ther. 34(2):168–175. doi:https://doi.org/10.1111/j.1365-2885.2010.01208.x.
- Du B, Lofton JM, Peter KT, Gipe AD, James CA, McIntyre JK, Scholz, NL, Baker, JE, Kolodziej, EP. 2017. Development of suspect and non-target screening methods for detection of organic contaminants in highway runoff and fish tissue with high-resolution time-of-flight mass spectrometry. Environ Sci. 19(9):1185–1196.
- Fabresse N, Larabi IA, Stratton T, Mistrik R, Pfau G, Lorin de la Grandmaison G, Etting I, Grassin Delyle S, Alvarez J-C. 2019. Development of a sensitive untargeted liquid chromatography–high resolution mass spectrometry screening devoted to hair analysis through a shared MS2 spectra database: a step toward early detection of new psychoactive substances. Drug Test Anal. 11(5):697–708. doi:https://doi.org/10.1002/dta.2535.
- Guo Z, Zhu Z, Huang S, Wang J. 2020. Non-targeted screening of pesticides for food analysis using liquid chromatography high-resolution mass spectrometry-a review. Food Addit Contam A. 37(7):1180–1201. doi:https://doi.org/10.1080/19440049.2020.1753890.
- Jansen LJM, Bolck YJC, Berendsen BJA. 2016. Feather segmentation to discriminate between different enrofloxacin treatments in order to monitor off-label use in the poultry sector. Anal Bioanal Chem. 408(2):495–502. doi:https://doi.org/10.1007/s00216-015-9118-z.
- Jansen LJM, Bolck YJC, Rademaker J, Zuidema T, Berendsen BJA. 2017. The analysis of tetracyclines, quinolones, macrolides, lincosamides, pleuromutilins, and sulfonamides in chicken feathers using UHPLC-MS/MS in order to monitor antibiotic use in the poultry sector. Anal Bioanal Chem. 409(21):4927–4941. doi:https://doi.org/10.1007/s00216-017-0445-0.
- Kaufmann A. 2020. High-resolution mass spectrometry for bioanalytical applications: is this the new gold standard? J Mass Spectrom. 55(9):e4533. doi:https://doi.org/10.1002/jms.4533.
- Kaufmann A, Butcher P, Maden K, Walker S, Widmer M. 2010. Comprehensive comparison of liquid chromatography selectivity as provided by two types of liquid chromatography detectors (high resolution mass spectrometry and tandem mass spectrometry): “Where is the crossover point?”. Anal Chim Acta. 673(1):60–72. doi:https://doi.org/10.1016/j.aca.2010.05.020.
- Knolhoff AM, Fisher CM. 2021. Strategies for data reduction in non-targeted screening analysis: the impact of sample variability for food safety applications. Food Chem. 350:128540. doi:https://doi.org/10.1016/j.foodchem.2020.128540.
- Pokrant E, Medina F, Maddaleno A, San Martín B, Cornejo J. 2018. Determination of sulfachloropyridazine residue levels in feathers from broiler chickens after oral administration using liquid chromatography coupled to tandem mass spectrometry. PLoS One. 13(7):e0200206–e. doi:https://doi.org/10.1371/journal.pone.0200206.
- Pourchet M, Debrauwer L, Klanova J, Price EJ, Covaci A, Caballero-Casero N, Oberacher, H, Lamoree, M, Damont, A, Fenaille, F. et al, 2020. Suspect and non-targeted screening of chemicals of emerging concern for human biomonitoring, environmental health studies and support to risk assessment: from promises to challenges and harmonisation issues. Environ Int. 139:105545. doi:https://doi.org/10.1016/j.envint.2020.105545.
- San Martín B, Iragüen D, Hidalgo H, Anadón A. 2007. Depletion study of enrofloxacin and its metabolite ciprofloxacin in edible tissues and feathers of White Leghorn Hens by liquid chromatography coupled with tandem mass spectrometry. J Food Protect. 70(8):1952–1957. doi:https://doi.org/10.4315/0362-028X-70.8.1952.
- Solliec M, Roy-Lachapelle A, Sauvé S. 2015. Development of a suspect and non-target screening approach to detect veterinary antibiotic residues in a complex biological matrix using liquid chromatography/high-resolution mass spectrometry. Rapid Commun Mass Spectrom. 29(24):2361–2373. doi:https://doi.org/10.1002/rcm.7405.
- Sun F, Tan H, Li Y, De Boevre M, Zhang H, Zhou J, Li Y, Yang S. 2021. An integrated data-dependent and data-independent acquisition method for hazardous compounds screening in foods using a single UHPLC-Q-Orbitrap run. J Hazard Mater. 401:123266. doi:https://doi.org/10.1016/j.jhazmat.2020.123266.
- von Eyken A, Bayen S. 2019. Optimization of the data treatment steps of a non-targeted LC-MS-Based workflow for the identification of trace chemical residues in honey. J Am Soc Mass Spectrom. 30(5):765–777. doi:https://doi.org/10.1007/s13361-019-02157-y.
- Wu I-L, Turnipseed SB, Storey JM, Andersen WC, Madson MR. 2020. Comparison of data acquisition modes with Orbitrap high-resolution mass spectrometry for targeted and non-targeted residue screening in aquacultured eel. Rapid Commun Mass Spectrom. 34(7):e8642. doi:https://doi.org/10.1002/rcm.8642.
- Zomer P, Mol HGJ. 2015. Simultaneous quantitative determination, identification and qualitative screening of pesticides in fruits and vegetables using LC-Q-OrbitrapTM-MS. Food Addit Contam A. 32(10):1628–1636. doi:https://doi.org/10.1080/19440049.2015.1085652.