
Abstract
Zeranol (α-zearalanol, α-ZAL), is a resorcyclic acid lactone (RAL). Its administration to farm animals to improve meat production has been prohibited in the European Union due to the potential risk to human health. However, it has been demonstrated that α-ZAL may be present in livestock animals due to Fusarium fungi that produce fusarium acid lactones contamination in feed. The fungi produce a small amount of zearalenone (ZEN), which is metabolized to zeranol. The potential endogenous origin of α-ZAL makes it difficult to correlate positive samples to a potential illicit treatment with α-ZAL. We present two experimental studies that investigated the origin of natural and synthetic RALs in porcine urine. Urine samples from pigs that were either fed with ZEN-contaminated feed or administered α-ZAL by injection were analyzed by liquid chromatography coupled to tandem mass spectrometry, with the method validated according to Commission Implementing Regulation (EU) 2021/808. The data show that although the concentration of α-ZAL in the ZEN feed-contaminated samples is significantly lower than in the illicit administration samples, α-ZAL can occur in porcine urine via natural metabolism. Additionally, the feasibility of using the ratio of forbidden/fusarium RALs in porcine urine as a reliable biomarker for illicit treatment with α-ZAL administration was evaluated for the first time. This study demonstrated that the obtained ratio in the contaminated ZEN feed study was close to 1, while in the illegally administered α-ZAL samples the ratio is always higher than 1 (up to 135). Therefore, this study proves that the ratio criteria (already used when a forbidden RAL is detected in bovine urine) may also be used for porcine urine.
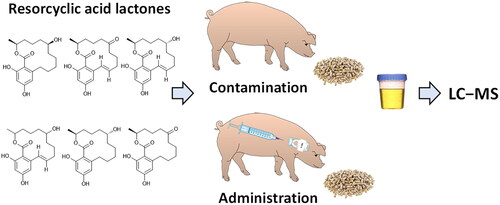
Graphical Abstract
Introduction
In livestock animals, the presence of certain chemical compounds in biological samples can be due to their natural occurrence from endogenous production as part of normal physiology (Xu P et al. Citation2018; Rechsteiner et al. Citation2020), contamination (Kagera et al. Citation2019; Jiang et al. Citation2021; Li et al. Citation2022; Xu R et al. Citation2022) or illegal administration of these (Carnevale Citation1992; Rana et al. Citation2019; Canton et al. Citation2021). In some cases, the combination of the abovementioned situations cannot be excluded (Arrizabalaga Larrañaga et al. Citation2022). Therefore, it is challenging for control laboratories to monitor them and verify if the presence of certain chemicals is due to an illegal practice or natural occurrence.
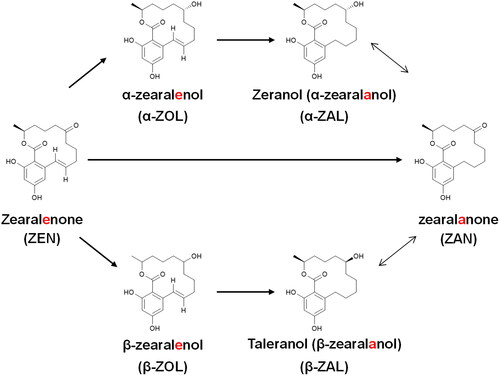
The presence of zeranol (α-zearalanol, α-ZAL) in animal species has been described previously in the literature as a natural occurrence (Knutsen et al. Citation2017) due to contamination through the presence of the Fusarium spp. toxin zearalenone (ZEN) in feed (Matraszek-Zuchowska et al. Citation2019; Liu and Applegate Citation2020) and through the administration of α-ZAL (Widiastuti and Anastasia Citation2020). α-ZAL is a non-steroidal estrogenic compound that induces live-weight gain as a growth promotor. Additionally, together with its primary metabolite, taleranol (β-zearalanol, β-ZAL), it is part of the group of resorcyclic acid lactones (RALs) that also includes α- and β-zearalenol (ZOL), zearalanone (ZAN) and ZEN. Resorcyclic acid lactones, including α-ZAL, are anabolics listed in group A1d4 of Commission Delegated Regulation (EU) (Citation2022/1644) and have been banned in European Union for animal use since 1985. However, its use for animal fattening is permitted in countries like the USA and Canada. α-ZAL is synthesized from the naturally occurring mycotoxin ZEN (). α-ZAL and ZEN are known to produce identical metabolites when administered to animals. Thus, they can be present naturally in urine and bile from goats, sheep, cows, and horses (Kennedy et al. Citation1998; Blokland et al. Citation2006). Therefore, the occurrence of α-ZAL in samples of animal origin might not be sufficient proof of illicit treatment. Thus it is necessary to establish quantitative criteria to distinguish α-ZAL abuse from environmental contamination with Fusarium spp. toxins.
Figure 1. Structures and acronyms of resorcyclic acid lactones and probable pathways of phase I metabolism (Kennedy et al. Citation1998).
RALs are determined by gas chromatography or liquid chromatography (LC) using reversed-phase chromatography coupled to mass spectrometry (MS) (Blokland et al. Citation2006; Liu and Applegate Citation2020) since MS provides high sensitivity, selectivity, and structural information for the identification and confirmation of target compounds in complex matrices (Zöllner et al. Citation2003; Hird et al. Citation2014). Echarte et al. demonstrated that LC coupled to tandem mass spectrometry (MS/MS) showed better performance than gas chromatography (GC) coupled to MS/MS for the determination of α-ZAL and its metabolites (Echarte et al. Citation2014). Additionally, multi-residue methods using high-resolution mass spectrometry (HRMS) have been applied to detect RALs in biological matrices (Kumar et al. Citation2013; Lauwers et al. Citation2019; Jongedijk et al. Citation2023). In general, RALs have been analyzed in biological matrices from animal species such as urine (Dusi et al. Citation2009; Catteuw et al. Citation2019; Matraszek-Zuchowska et al. Citation2019), muscle (Zöllner et al. Citation2002; Geis-Asteggiante et al. Citation2012; Wozniak et al. Citation2013), liver (Zöllner et al. Citation2002; Geis-Asteggiante et al. Citation2012; Wozniak et al. Citation2013), bile (Dänicke et al. Citation2014; Lega et al. Citation2017) and milk (Dänicke et al. Citation2014; Huang et al. Citation2014).
In 2018–2022, in The Netherlands, 9818 animal samples were tested for RALs residues within the National Residue Control Plan (NRCP). LC − MS/MS screening detected α-ZAL in 111 samples (1.1%). In 2004, Launay et al. developed a statistical model based on the metabolite pattern using the concentrations of all RALs in the urine of cows (Launay et al. Citation2004). This model was extensively validated for urine from cattle, and it is used in routine residue control programs in case of a non-compliant finding to indicate the origin of the finding. In 2017, other studies demonstrated that the developed method was also suitable for discriminating the presence of RALs in bovine bile (Lega et al. Citation2017). However, in many Member States RALs are also analyzed in species other than cows, including pigs. To the best of our knowledge, no scientific results demonstrate that the model mentioned above can be suitable as a guide for porcine urine analysis. Recently, based on queries put to the European Union Reference Laboratory (EURL) for growth promotors, concerns regarding the occurrence of RALs in pig urines increased compared to previous years.
This study aims to improve the knowledge about metabolic patterns of RALs in pig urine using different exposure scenarios. In one scenario, a pig received feed contaminated with ZEN, whereas, in the other scenario, α-ZAL was administrated to a pig. Furthermore, a new analytical method based on LC − MS/MS to quantify RALs in pig urine was developed and validated to determine the target compounds. Finally, the obtained results were used to evaluate if the established criteria for discriminating the presence of α-ZAL between contaminated and illegal treatment in cows is also applicable to pigs.
Materials and methods
Two animal experiments (A and B) have been conducted within the Department of Animal Sciences Group of Wageningen University and Research (The Netherlands). The ethical committee of Wageningen University approved the protocols under number 2020D-0008.004. Wageningen Food Safety Research (WFSR) carried out all analytical activities connected to the animal experiments
Experimental design
The study lasted four weeks, consisting of one week of acclimatization and three weeks of treatment. A control pig was held with each treated pig, so there were two animals per pen. The companion animals were not treated but were sampled to get information on possible within-pen cross contamination depending on the administration route. Urine samples from both treated and nontreated animals were collected daily during the four weeks on Mondays to Fridays (Figure S1).
Study A: Feed contaminated by zearalenone
This study used two grower pigs (female) weighing around 50 kg. The animals were subjected to a one-week acclimatization period, after which one was randomly selected and assigned to the treatment group. At the same time, the remaining pig was assigned to the control group. The treated animal was fed with 500 µg zearalenone kg−1 feed; 20 mg zearalenone was mixed with 45 g maize flour, and the animal fed 2 g of this mix per day, incorporated into soaked food as a food ball. The short treatment period ensures no negative effects on animal health. After 28 days, both control and treated animals were sacrificed.
Study B: α-Zearalanol administration
For the study conducted for an overall period of 4 weeks, two grower pigs (female) weighing around 50 kg were used. The study was organized according to the following protocol: both animals were allowed to familiarize themselves with their new surroundings for 7 days. Subsequently, one randomly selected animal was treated with α-ZAL as a growth promotor via intramuscular injection once a week for three weeks. Both animals were sacrificed after 28 days without any withdrawal period. The injection dose was administered alternately left and right in the neck in a 1 mg kg−1 body weight dose. This way, the animals got a maximum of 5 mL per side. For the injections, α-ZAL was administered 20 mg mL−1 for the first two weeks. For the third week, the animals showed swift growth, and therefore, an α-ZAL solution in a more concentrated form, 30 mg mL−1, was prepared and used.
Chemicals and reagents
Purified water was prepared using a Milli-Q system at a resistance of at least 18.2 MΩ cm (Millipore, Billerica, MA, USA). Ultra LC − MS grade methanol and acetonitrile were purchased from Actu-All Chemicals (Oss, The Netherlands). Acetic acid, sodium acetate, sodium carbonate, and β-glucuronidase/arylsulfatase from Helix pomatia were purchased from Merck (Darmstadt, Germany). A 0.25 M acetate buffer was prepared by dissolving 20.5 g of sodium acetate in 1,000 mL of Milli-Q water, and the pH was adjusted to 4.8 by adding acetic acid. Sodium carbonate solution (10% w/v) was prepared by dissolving 100 g of sodium carbonate in Milli-Q water, made up to a final volume of 1,000 mL. SPE Bond Elute C18 (500 mg, 3 ml) cartridges and SPE Isolute NH2-columns (100 mg, 3 mL) were purchased from VWR (Radnor, Pennsylvania, USA).
Reference standards
α-Zearalanol (α-ZAL), β-Zearalanol (β-ZAL), α-Zearalenol (α-ZOL), β-Zearalenol (β-ZOL), Zearalenone (ZEN) and Zearalanone (ZAN) were purchased from Sigma-Aldrich (St. Louis, MO, USA). α-Zearalanol-d5, β-Zearalanol-d5, α-Zearalenol-d5 and β-Zearalenol-d5 were purchased from Witega (Berlin, Germany), Zearalenone-d6 from LGC Standards GmbH (Wesel, Germany), and Zearalanone-d6 from TRC (Toronto, Canada). Individual stock standard solutions were prepared in methanol at a concentration of 1000 mg L−1 except for α-ZAL when a concentration of 497.5 mg L−1 was prepared. An intermediate standard mixture containing all the target compounds (10 mg L−1) was prepared from standard stock solutions by appropriate dilution in methanol. Working standard solutions were prepared for each series by corresponding dilution from intermediate standard mixture solution. All these standard solutions were stored at −20 °C until use.
Sample preparation
Two milliliters of pig urine were spiked with 50 µL of a 0.08 µg mL−1 internal standard solution (2 µg L−1), and a calibration curve between 0.5–50 µg L−1 was prepared. Thereafter, 2 mL of sodium acetate buffer 0.25 M (pH 4.8) were added to each tube. After vortexing, the pH was checked to make sure it was within the range of 4.8 ± 0.2. Enzymatic hydrolysis was carried out by incubation at 55 °C for two hours with 20 µL of β-glucuronidase/arylsulfatase from Helix pomatia (1/10 diluted with acetate buffer v/v).
After hydrolysis, the sample was cooled to room temperature, and solid phase extraction (SPE) was carried out. A Bond Elute C18 (500 mg, 3 ml) cartridge was conditioned with 2.5 mL methanol and 2.5 mL acetate buffer. After loading the sample, the cartridge was washed using 1.5 mL of sodium carbonate solution (10%), 3 mL water, 1.5 mL acetate buffer, and two times with 2 mL of methanol/water (50:50, v/v). Afterward, the C18 cartridge was dried under vacuum. Simultaneously, an SPE NH2-column (100 mg, 3 mL) was conditioned with 3 mL of methanol, and after conditioning placed above the 12 mL collection tube. The analytes were eluted from C18 cartridges with 2 mL of methanol directly into the NH2-columns which eluted into the collection tubes. The eluate was evaporated under a stream of nitrogen at a temperature of 40 °C. The residue was dissolved in 75 µL of acetonitrile and ultrasonicated for 1 min; 225 µL of water was added before centrifugation (2 min, 3000 rpm). The samples were transferred into injection vials, and 20 µL were injected into the LC − MS/MS system.
Instrumentation
The chromatographic separation of resorcyclic acid lactones was performed on an UHPLC system equipped with a syringe pump, an Acquity autosampler, and a column oven (Waters, Milford, Massachusetts, USA). Two UPLC Acquity columns were tested (1) UPLC BEH C18 (100 mm × 2.1 mm i.d., 1.7 µm particle size) and (2) UPLC HSS C18 column (100 mm × 2.1 mm i.d., 1.8 µm particle size), purchased from Waters. The HSS column was used in the developed method. The UHPLC system was coupled to a Triple Quad TQXS (Waters) mass spectrometer equipped with a triple quadrupole mass analyzer and an electrospray ionization (ESI) source.
The chromatographic separation was carried out with Milli-Q water (solvent A) and methanol/acetonitrile (20/80 v/v) (solvent B) as mobile phase components. The gradient elution program was as follows: 0–1.00, isocratic conditions at 70% solvent A; 1.00–6.23 min, linear gradient elution from 70 to 40% solvent A: 6.23–6.25 min linear gradient elution from 40 to 0% solvent A; 6.25–8.00 min isocratic conditions 100% solvent B. The flow rate of the mobile phase was 400 µL min−1, the injection volume was 20 µL, and column oven and autosampler temperatures were held at 30 °C and 10 °C, respectively, during the chromatographic run.
Ionization source working conditions were as follows: Source and desolvation temperatures were set at 150 °C and 400 °C, respectively; ESI spray voltage at –2.0 kV and source offset at 30 V. Nitrogen was used as desolvation and cone gas at a flow rate of 800 and 150 L h−1, respectively. The mass spectral data were acquired in selected reaction monitoring mode (MRM) in negative ion mode, and both quadrupoles (Q1 and Q3) operated at unit mass resolution. Argon (≥99.995%) was used as a collision-induced dissociation (CID) gas at a flow rate of 0.15 mL min−1 in the collision cell (Q2). Table S1 summarizes the MRM working conditions used: the selected precursor-product ion transitions for quantitation and confirmation purposes, the optimum collision energies (CEs, eV) for the selected transitions, and optimal cone voltages and dwell time. Instrument control and LC − MS/MS data analysis were carried out using Mass Lynx v4.1 software (Waters).
Method validation
The method validation has been carried out according to Commission Implementing Regulation (EU) (Citation2021/808) concerning the performance of analytical methods and interpretation of results. The validated matrix was porcine urine. In the EURL Guidance Paper (Guidance Citation2021), the Minimum Method Performance Requirement (MMPR) is set at 1–2 µg L−1. Therefore, the lowest concentration level (LCL) value has been set in this validation at 0.5 µg L−1. In order to correct analyte losses during sample extraction and matrix effects during analysis, isotope labelled internal standards for each analyte were included. The response of the compound was divided by the response of the corresponding internal standard. This ratio is called the response factor (Rf). Calibration lines were prepared by adding targeted standards in blank urine samples. For the mycotoxins α/β zearalenol, and zearalenone, Rf correction was carried out on the calibration line based on the samples without addition. The calculated Rf value of a sample without addition is subtracted from the samples with addition. The selectivity/specificity of the method was assessed directly in the chromatograms obtained from the blank and spiked urine samples. The occurrence of possible extra peaks in the retention time window expected for the analyte elution was tested by monitoring the selected two MRM transitions for each target compound in the blank matrix chromatograms. Linearity was evaluated in the range of 0.5 − 50 µg L−1 by injecting 8 solutions at increasing concentrations: 0.5, 1, 2, 3, 5, 10, 25, 50 µg L−1. The accuracy in terms of trueness and the precision (intra- and interday repeatability) of target compounds were calculated at three validation levels: 0.5, 1, and 1.5 µg L−1, and 7 replicates were carried out for each level. To estimate the recoveries of the extraction procedure, both a blank urine sample and the corresponding spiked one were submitted to the same extraction procedure. The quantitative results obtained after their UHPLC − MS/MS determination using standards prepared in the mobile phase were compared without correcting by means of the isotope internal standards. The decision limit (CCα) was calculated according to Section 2.6 in Commission Implementing Regulation (EU) (2021/808).
Results and discussion
Method development and validation
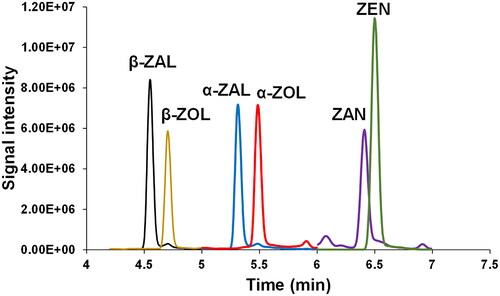
For control monitoring of residues, it is necessary due to the high workload to use simple, fast, and easy-to-use analytical methods. However, the method used in our laboratory to control RALs in animal urine samples such as from pigs was rather long. It consisted of a first extraction with Bond Elute C18 SPE cartridge and a cleanup step using an SPE NH2-column followed by a chromatographic separation using an HPLC Symmetry C18 column with 28 min of total analysis time. The long LC analysis time limits the number of samples that could be analyzed in an analysis series and, thus, the laboratory throughput. For this reason, to shorten the analysis time while maintaining chromatographic resolution and sensitivity, two UHPLC columns were tested: Acquity UPLC HSS C18 and BEH C18. Of these, the BEH C18 column did not provide enough resolution for baseline separation of β- and α- zearalanol (ZAL) and β- and α- zearalenol (ZOL), which is crucial since those are isobaric compounds that yield common product ions under tandem mass spectrometry conditions (data not shown). Hence, the BEH C18 column was discarded for further studies. In the case of HSS C18, a better resolution was observed in the separation of the RALs. The gradient elution program was optimized by testing different gradients using (A) water and (B) acetonitrile as mobile phase components. Under the optimized conditions, the most critical isobaric compounds were separated at baseline in less than 7 min. However, this was not possible to achieve for all compounds. Some partial coelutions among target compounds such as β-ZAL and β-ZOL, α-ZAL and α-ZOL, and ZAN and ZEN remained. Nevertheless, the selection of non-interfering transitions by mass spectrometry enables individual analysis. These compounds did not undergo ion suppression/enhancement effects. Additionally, as demonstrated by Han et al. (Citation2011), the presence of methanol in the mobile phase improves both the peak shape and signal response of target compounds and therefore, the addition of methanol up to 20% in component B was evaluated. This study observed that the peak height increased when using methanol:acetonitrile (20:80, v/v) compared to 100% acetonitrile, so this solvent was selected as the optimum mobile phase composition. shows the chromatogram of the targeted six RALs standard mixture solution (1 µg L−1) obtained under the optimum UHPLC conditions (Section 2.5).
Figure 2. UHPLC–ESI–MS/MS chromatogram corresponding to a standard mixture solution (1 µg L−1) of targeted compounds obtained under optimal gradient elution conditions. (β-ZAL), β-zearalanol m/z 321.3; (β-ZOL), β-zearalenol m/z 319.3; (α-ZAL), α-zearalanol m/z 321.3; (α-ZOL) α-zearalenol m/z 319.3; (ZAN) zearalenone m/z 319.3; (ZEN) zearalenone m/z 317.3.
In addition, the fragmentation data were studied to improve the detectability of the RALs and ensure the identification and quantitative determination of target compounds. Among all product ions, the two most abundant and selective ones were selected for quantitation and confirmation. The selected MRM transitions for each compound (including respective internal standards) with their optimal collision energies are given in Table S1.
To demonstrate the feasibility of the developed UHPLC − MS/MS method, validation was carried out in the range 0.5 − 5 µg L−1 (). The applied extraction technique is similar to that one used by Blokland et al. (Citation2006), which is based on a C18 SPE followed by a cleanup step with NH2-column (described in Section 2.4) and showed good recoveries ranging from 57 to 62% (). The matrix-matched calibration curves showed good linearity within the working range resulting in a correlation coefficient (R2) higher than 0.989 in all cases. Decision limits (CCα) in µg L−1 were 0.6 for β- and α- ZAL, 0.7 for β-ZOL, 0.8 for α-ZOL and ZAN, and 1.1 for ZEN. Trueness was determined using the corresponding blank sample spiked at three levels (n = 7) (described in Section 2.6). The results showed values ranging from 88 to 109% for all compounds except for α-ZOL, which gave 68 and 79% at low and medium levels, respectively. Repeatability expressed as relative standard deviation (RSD, %) was studied at the three levels (n = 7). Good precision was achieved with values ranging from 5 to 17% except for α-ZOL, where 30 and 27% were obtained at low and medium levels, respectively. Additionally, it should be highlighted that the confirmation rate was 100% among the analyzed seven replicates.
Table 1. Performance characteristics of the developed LC − MS/MS per analyte in porcine urine (n = 7).
Results animal studies
Two animal studies were performed to investigate whether it is possible to determine if the origin of RALs in pigs is due to natural contamination or intentional addition; A) feed contaminated by ZEN and B) α-ZAL administration (see Section 2.1). Urine samples from treated and nontreated animals were collected Monday to Friday during four weeks. The RALs concentrations measured in each urine sample are listed in and . Collecting a complete set of urine samples from all pigs over the whole study period was impossible, although this mainly affected the control companion animals. Samples with concentrations higher than the method application range were diluted to quantify analytes within the linearity range.
Table 2. Feed contaminated by zearalanone (Animal study A): concentrations found in urine (µg L−1).
Table 3. α-Zearalanol administration (Animal study B): concentrations found in urine (µg L−1).
Feed contaminated with zearalenone (study A)
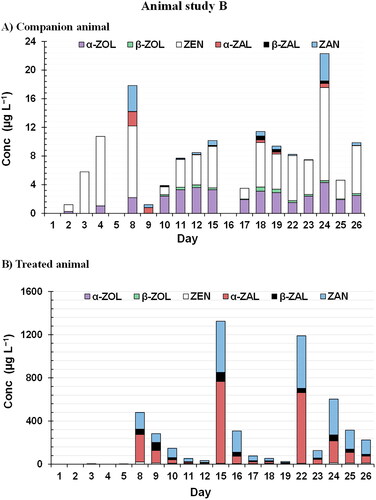
In the acclimatization stage, urine samples were collected to ensure that they were free of mycotoxins exposure. However, in urine samples from both animals in each pair (Day 1-5), ZEN and its metabolite α-ZOL were determined (≥CCα) in almost all the samples (, ). This fact underscores the possible natural occurrence of Fusarium toxins in livestock animals (Kleinova et al. Citation2002; Zöllner et al. Citation2002) due to contaminated feed. During the study weeks (Day 8-26), in the case of the companion pigs, the RALs profile remained the same for ZEN and α-ZOL in all available samples. However, it should be noted that the concentration of the analytes was increasing (). In this case, the presence of the synthetic and prohibited RALs (ZAN, α-ZAL and β-ZAL), as well as the β metabolite (β-ZOL) of the toxin, were minimal with a concentration lower than 2 µg L−1 in all cases (). In contrast, for the treated animal, during feeding with food balls containing ZEN (days 8-26), a significant change in the RALs profile can be observed in the urine samples (). ZEN showed the highest concentrations (up to 66 µg L−1) followed by ZAN (6–54 µg L−1), α-ZOL (4–32 µg L−1) and α-ZAL (4–25 µg L−1) (). The mean conversion ratio of these three metabolites was 2:1:1. The lower concentration of β-form metabolites in all analyzed samples (≤6 µg L−1) is of considerable interest. The in vivo transformation of ZEN to ZAN in porcine was unambiguously identified by Zöllner et al. (Citation2002). The authors did not identify ZAN in all analyzed samples, and therefore, they highlighted this occurrence as unclear (Zöllner et al. Citation2002). However, in the case of pigs, the present study demonstrates that the ZAN metabolite can be clearly identified in high concentrations. Additionally, this new study on pigs has revealed the in vivo transformation of ZEN to metabolites such as α-ZAL that had previously not been described in the literature. Nevertheless, detecting significant concentrations of this metabolite means that any sample containing high concentrations of ZEN would be classified as suspicious and require a follow-up investigation for residue control.
Figure 3. Profile of the six RALs ((β-ZAL), β-zearalanol; (β-ZOL), β-zearalenol; (α-ZAL), α-zearalanol; (α-ZOL) α-zearalenol; (ZAN) zearalenone; (ZEN) zearalenone) determined by UHPLC–MS/MS analysis of the collected urine samples at feed contaminated by zearalenone (Study A). Samples are labelled according to the collection day in the study.
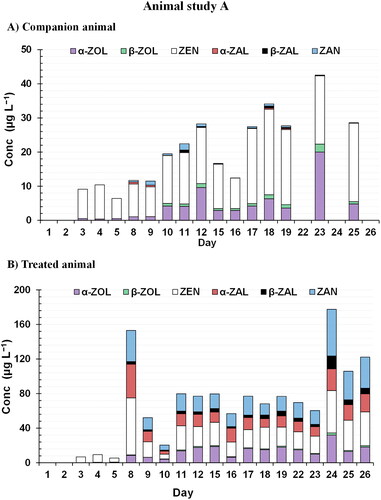
If the average concentrations are compared for both animals in each pair, the ZEN levels of the treated animal were approximately twice higher than those of the companion animal (). Additionally, it must be pointed out that the levels of RALs changed with exposure and that at the end of the treatment period, the average concentration increased significantly (). The weight of the animal was recorded every Monday (Day 1,8,15,22). In the case of the companion animal, the weight rose from 62 kg to 88 kg whereas in the treated animal it increased from 66 kg to 96 kg, thus resulting in a weight gain of 25 kg and 30 kg, respectively. The difference in weight gain could be attributed to continuous exposure to ZEN and its metabolites that promote animal growth in the case of the treated animal.
α-zearalanol administration (study B)
To study the difference in the RALs profile of pigs that have been illegally subjected to the administration of α-ZAL an animal experiment was carried out with one pig along with its non-treated companion (Section 2.3). Similarly to study A, in both pigs the presence of ZEN and α-ZOL in lower quantities could be observed in the acclimatization stage (, ). During the administration weeks (Day 8-26), in the companion animal, the concentrations of ZEN mycotoxins and its metabolites were similar to those found in the companion animal of study A (, ). Therefore, this observation confirmed the unavoidable natural presence of mycotoxin in the feed usually supplied to pigs. It should be noted that, in this case, the presence of ZAN and α-ZAL (<2 µg L−1) is also observed with a higher concentration than the corresponding β metabolites (β-ZOL and β-ZAL), highlighting the possible metabolite pathway of ZEN in pigs. After the injection of α-ZAL in the treated animal every Monday for three weeks, the obtained RALs profile can be observed in , and the concentration of each metabolite is in . Among all target compounds, α-ZAL was determined at the highest concentrations (up to 759 µg L−1), followed by ZAN (up to 474 µg L−1), β-ZAL (3–84 µg L−1) and ZEN (1–20 µg L−1) (). The mean conversion ratio of these three metabolites was 23:4:1. Both fusarium metabolites α-ZOL and β-ZOL were found at concentrations below 4 µg L−1 showing the low transformation of α-ZAL to these metabolites. These results could indicate a possible reversible transformation of the ZEN and ZAN metabolites in porcine urine.
Figure 4. Profile of the six RALs ((β-ZAL), β-zearalanol; (β-ZOL), β-zearalenol; (α-ZAL), α-zearalanol; (α-ZOL) α-zearalenol; (ZAN) zearalenone; (ZEN) zearalenone) determined by UHPLC–MS/MS analysis of the collected urine samples at α-zearalanol administration (Study B). Samples are labelled according to the collection day in the study.
As can be seen in , the signal of synthetic RALs in the case of treated animal decreased significantly from the administration day (Monday) to the 5th day after administration (Friday) every week, and therefore the detection time window of the forbidden substances after illegal administration could be limited. Additionally, the animals’ recorded weights should be noted. In the case of the companion animal, the weight increased from 58 kg to 83 kg, compared to 59 kg to 95 kg in the treated pig, thus resulting in a gain of 25 kg and 36 kg, respectively. If we compare those values with those from ZEN study, it can be observed that both companion animals gained 25 kg, whereas the treated animal in Study B resulted in a 6 kg higher gain. In this way, it is demonstrated how the use of α-ZAL significantly increases the animal’s weight. Therefore, besides the health problems α-ZAL may cause, it is also a fraudulent activity in the food system.
Discrimination between fusarium contamination and α-ZAL administration
In the early 2000s, Kleinova et al. and Launay et al. developed a statistical model based on the metabolite pattern using concentrations of all RALs in bovine urine to discriminate between abuse of zeranol and exposure to mycotoxin-contaminated feed (Kleinova et al. Citation2002; Launay et al. Citation2004). Authors carried out discrimination between abuse and natural contamination by differences in the metabolite pattern of α/β-ZAL + ZAN vs α/β-ZOL + ZEN. Following this calculation, if the ratio is lower than 1, the presence of the target compounds is related to possible feed contamination. The sample should be selected for follow-up investigation if the ratio is between 1 and 10. If the ratio is above 10, it is considered suspect due to α-ZAL administration. The authors highlighted that illegal use is indicated when the combined concentrations of α/β-ZAL + ZAN are higher than those of α/β-ZOL + ZEN.
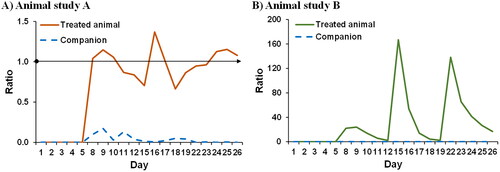
However, this model was developed for cows, and there has not been any scientific proof that it could be transferred to other species, such as pigs, for use in routine residue control programs in case of non-compliant findings. Thus, the obtained concentrations of RALs from both animal studies were tested following the ratio strategy mentioned above. The obtained ratio values on each case for both companion and treated animals are depicted in . As can be seen in and (blue dashed line), the obtained ratio for the companion animals in both studies was close to zero. This result demonstrates that if an animal has not been directly exposed to the forbidden RALs, the model will indicate that the result is due to natural contamination. In the case of the animal treated with ZEN, the natural toxin (, continuous orange line), the ratio during the first week, which is the acclimatization period, corresponds to zero. From the administration day ongoing, it changed and slightly increased; nevertheless, in this case, although the ratio value is close to 1, it ranges between 0.7 and 1.4. Thus, if we follow the criteria of Kleinova et al. (Citation2002) and Launay et al. (Citation2004), although most urine samples will indicate possible feed contamination, some will require a follow-up investigation that will indicate that these were false positives. These results are in line with the original model developed for cows. Therefore the obtained results in the urine of the animal treated with ZEN demonstrated that the model could be used to assess the source of the RALs found in these samples as caused possible by contaminated feed since the value is near 1. In the last case, with the animal treated with α-ZAL (, continuous green line), during the control week, the ratio was zero. However, a large rise in the ratio value can be observed on the days of administration (up to 115), followed by a significant decrease during the 5 days post-administration. It should be noted that during these 5 days, the ratio value was consistently above 1, so that at any subsequent time, the model would indicate either a positive sample due to administration or the need for follow-up investigation.
Figure 5. Obtained ratio based on the metabolite pattern of α/β-ZAL + ZAN vs α/β-ZOL + ZEN for (A) Animal study A: Feed contaminated by zearalenone and (B) Animal study B: α-Zearalanol administration. Blue dash lines correspond to the values of control animals while continuous lines to treated animals.
Therefore, this study demonstrates that the model previously developed by Launay et al. (Citation2004) to detect illegal use of RALs in bovine could also reliably be used in routine monitoring plans for pigs and immediately implemented in food residue control laboratories.
Conclusions
The UHPLC–MS/MS method developed has proved reliable and accurate for simultaneously determining six RALs in porcine urine samples. The method has been validated according to CIR (EU) 2021/808, obtaining CCα values between 0.6–1.1 µg L−1, good repeatability (RSD% <17), and high accuracy (88 − 109%). In addition, 80 porcine urine samples were analyzed from the study animal experiments using matrix-matched calibration for the quantitative analysis, and target compounds were determined from 0.12 up to 719 µg L−1.
The planned animal studies were successfully carried out, giving rise to new data on the behavior of the metabolite pathways of ZEN and α-ZAL in pigs. To the best of our knowledge, this is the first time that α-ZAL administration in pigs has been studied. Therefore, the obtained results are of direct interest for residue control monitoring enforcement of RALs in pigs. Although the number of animals used in this work was minimal due to the ethical aspects of experimental animal work, we can affirm that the results are trustworthy sincethey are an extension of what is known about RALs in cows.
Additionally, for the first time, this new study on pigs has revealed the in vivo transformation of ZEN to metabolites such as ZAN and α-ZAL. The difference in the RALs profile in each animal study made it feasible to have an initial view of possible contamination with ZEN and/or illegal administration with α-ZAL. Additionally, the profiles of RALs in animal studies confirm the criteria previously established in cows for the follow-up of a suspicious sample. The research on the applicability of the previously developed model for cows has shown that it can be used to detect the illegal use of RALs in pigs. It must be pointed out that the present statistical model has no legal basis and is only a screening tool that can help control laboratories and competent authorities in deciding if a non-compliant finding of RALs requires a follow-up action or might be related to ingestion of Fusarium spp. toxin contaminated feed.
Supplemental Material
Download Zip (392 KB)Acknowledgments
The Animal Sciences Group in the animal research facility Carus of Wageningen University and Research (The Netherlands) is acknowledged for conducting the animal studies, and Maria Groot for organizing the animal studies and preparing the samples.
Disclosure statement
The authors declare that they have no known competing financial interests or personal relationships that could have appeared to influence the work reported in this paper.
Additional information
Funding
References
- Arrizabalaga Larrañaga A, Groot MJ, Blokland MH, Barbu IM, Smits NGE, Sterk SS. 2022. EURL Reflection paper 2.0: natural growth promoting substances in biological samples: presence - and formation – of hormones and other growth promoting substances in food producing animals. Wageningen Food Safety Research.
- Blokland MH, Sterk SS, Stephany RW, Launay FM, Kennedy DG, van Ginkel LA. 2006. Determination of resorcylic acid lactones in biological samples by GC–MS. Discrimination between illegal use and contamination with fusarium toxins. Anal Bioanal Chem. 384(5):1221–1227. doi: 10.1007/s00216-005-0274-4.
- Canton L, Lanusse C, Moreno L. 2021. Rational pharmacotherapy in infectious diseases: issues related to drug residues in edible animal tissues. Animals. 11(10):2878. doi: 10.3390/ani11102878.
- Carnevale RA. 1992. Illegal residues in meat and poultry. Consumers’ Research Magazine. p. 33. +.
- Catteuw A, Broekaert N, De Baere S, Lauwers M, Gasthuys E, Huybrechts B, Callebaut A, Ivanova L, Uhlig S, De Boevre M, et al. 2019. Insights into in vivo absolute oral bioavailability, biotransformation, and toxicokinetics of zearalenone, α-zearalenol, β-zearalenol, zearalenone-14-glucoside, and zearalenone-14-sulfate in pigs. J Agric Food Chem. 67(12):3448–3458. doi: 10.1021/Acs.jafc.8b05838.
- Commission Implementing Regulation (EU) 2021/808. on the performance of analytical methods for residues of pharmacologically active substances used in food-producing animals and on the interpretation of results as well as on the methods to be used for sampling and repealing Decisions 2002/657/EC and 98/179/EC.
- Commission Delegated Regulation (EU) 2022/1644 of 7 July 2022 supplementing Regulation (EU) 2017/625 of the European Parliament and of the Council with specific requirements for the performance of official controls on he use of pharmacologically active substances authorised as veterinary medicinal products or as feed additives and of prohibited or unauthorised pharmacologically active substances and residues thereof
- Dänicke S, Keese C, Meyer U, Starke A, Kinoshita A, Rehage J. 2014. Zearalenone (ZEN) metabolism and residue concentrations in physiological specimens of dairy cows exposed long-term to ZEN-contaminated diets differing in concentrate feed proportions. Arch Anim Nutr. 68(6):492–506.
- Dusi G, Bozzoni E, Assini W, Tognoli N, Gasparini M, Ferretti E. 2009. Confirmatory method for the determination of resorcylic acid lactones in urine sample using immunoaffinity cleanup and liquid chromatography–tandem mass spectrometry. Anal Chim Acta. 637(1-2):47–54.
- Echarte JM, Fernández DC, Chiacchio CA, Torres Leedham VM. 2014. Comparison of a validated LC/MS/MS method with a validated GC/MS method for the analysis of zeranol and its related mycotoxin residues in bovine urine samples collected during argentina’s residue monitoring control program (2005–2012). J AOAC Int. 97(5):1470–1475.
- Geis-Asteggiante L, Lehotay SJ, Lightfield AR, Dutko T, Ng C, Bluhm L. 2012. Ruggedness testing and validation of a practical analytical method for >100 veterinary drug residues in bovine muscle by ultrahigh performance liquid chromatography–tandem mass spectrometry. J Chromatogr A. 1258:43–54.
- Guidance E. 2021. EURL guidance on minimum method performance requirements (MMPRs) for specific pharmacologically active substances in specific animal matrices.
- Han Z, Ren Y, Zhou H, Luan L, Cai Z, Wu Y. 2011. A rapid method for simultaneous determination of zearalenone, α-zearalenol, β-zearalenol, zearalanone, α-zearalanol and β-zearalanol in traditional Chinese medicines by ultra-high-performance liquid chromatography–tandem mass spectrometry. J Chromatogr B. 879(5-6):411–420. doi: 10.1016/j.jchromb.2010.12.028.
- Hird SJ, Lau BPY, Schuhmacher R, Krska R. 2014. Liquid chromatography-mass spectrometry for the determination of chemical contaminants in food. Trac, Trends Anal Chem. 59:59–72. doi: 10.1016/j.trac.2014.04.005.
- Huang LC, Zheng N, Zheng BQ, Wen F, Cheng JB, Han RW, Xu XM, Li SL, Wang JQ. 2014. Simultaneous determination of aflatoxin M1, ochratoxin A, zearalenone and α-zearalenol in milk by UHPLC–MS/MS. Food Chem. 146:242–249. doi: 10.1016/j.foodchem.2013.09.047.
- Jiang Y, Ogunade IM, Vyas D, Adesogan AT. 2021. Aflatoxin in dairy cows: toxicity, occurrence in feedstuffs and milk and dietary mitigation strategies. Toxins13(4):283. doi: 10.3390/toxins13040283.
- Jongedijk E, Fifeik M, Arrizabalaga-Larrañaga A, Polzer J, Blokland M, Sterk S. 2023. Use of high-resolution mass spectrometry for veterinary drug multi-residue analysis. Food Control. 145:109488. doi: 10.1016/j.foodcont.2022.109488.
- Kagera I, Kahenya P, Mutua F, Anyango G, Kyallo F, Grace D, Lindahl J. 2019. Status of aflatoxin contamination in cow milk produced in smallholder dairy farms in urban and peri-urban areas of Nairobi County: a case study of Kasarani sub county. Kenya. Infection Ecology & Epidemiology. 9(1):1547095. doi: 10.1080/20008686.2018.1547095.
- Kennedy DG, Hewitt SA, McEvoy JDG, Currie JW, Cannavan A, Blanchflower WJ, Elliot CT. 1998. Zeranol is formed from Fusarium spp. toxins in cattle in vivo. Food Additives & Contaminants. 15(4):393–400. doi: 10.1080/02652039809374658.
- Kleinova M, Zöllner P, Kahlbacher H, Hochsteiner W, Lindner W. 2002. Metabolic profiles of the mycotoxin zearalenone and of the growth promoter zeranol in urine, liver, and muscle of heifers. J Agric Food Chem. 50(17):4769–4776. doi: 10.1021/jf020160p.
- Knutsen HK, Alexander J, Barregård L, Bignami M, Brüschweiler B, Ceccatelli S, Cottrill B, Dinovi M, Edler L, Grasl-Kraupp B, et al. 2017. Risks for animal health related to the presence of zearalenone and its modified forms in feed. Efsa J. 15(7):e04851. eng.
- Kumar P, Rúbies A, Centrich F, Granados M, Cortés-Francisco N, Caixach J, Companyó R. 2013. Targeted analysis with benchtop quadrupole–orbitrap hybrid mass spectrometer: application to determination of synthetic hormones in animal urine. Anal Chim Acta. 780:65–73.
- Launay FM, Ribeiro L, Alves P, Vozikis V, Tsitsamis S, Alfredsson G, Sterk SS, Blokland M, Iitia A, Lövgren T, et al. 2004. Prevalence of zeranol, taleranol and Fusarium spp. toxins in urine: implications for the control of zeranol abuse in the European Union. Food Additives & Contaminants. 21(9):833–839. doi: 10.1080/02652030400002121.
- Lauwers M, De Baere S, Letor B, Rychlik M, Croubels S, Devreese M. 2019. Multi LC-MS/MS and LC-HRMS methods for determination of 24 mycotoxins including major phase i and ii biomarker metabolites in biological matrices from pigs and broiler chickens. Toxins 11(3):171. doi: 10.3390/toxins11030171.
- Lega F, Angeletti R, Stella R, Rigoni L, Biancotto G, Giusepponi D, Moretti S, Saluti G, Galarini R. 2017. Abuse of anabolic agents in beef cattle: could bile be a possible alternative matrix? Food Chem. 229:188–197. doi: 10.1016/j.foodchem.2017.02.069.
- Li Z, Xiong J, Fantke P. 2022. Screening of pesticide distributions in foods of animal origin: a matrix-based approach for biotransfer factor modeling of grazing mammals. Environ Sci Process Impacts. 24(4):609–624. doi: 10.1039/D1EM00454A
- Liu J, Applegate T. 2020. Zearalenone (ZEN) in livestock and poultry: dose, toxicokinetics, toxicity and estrogenicity. Toxins. 12(6):377. doi: 10.3390/toxins12060377.
- Matraszek-Zuchowska I, Wozniak B, Posyniak A. 2019. Resorcylic acid lactones in urine samples of slaughtered animals resulting from potential feed contamination with zearalenone. Food Additives & Contaminants: part B. 12(2):105–115. doi: 10.1080/19393210.2019.1566933.
- Rana MS, Lee SY, Kang HJ, Hur SJ. 2019. Reducing veterinary drug residues in animal products: a review. Food Sci Anim Resour. 39(5):687–703. eng. doi: 10.5851/kosfa.2019.e65.
- Rechsteiner D, Schrade S, Zähner M, Müller M, Hollender J, Bucheli TD. 2020. Occurrence and fate of natural estrogens in swiss cattle and pig slurry. J Agric Food Chem. 68(20):5545–5554. doi: 10.1021/acs.jafc.0c00858.
- Widiastuti R, Anastasia Y. 2020. Zeranol residue detected by hplc in bovine meet from three different cities in Java island. Trop Anim Sci J. 43(3):270–275. doi: 10.5398/tasj.2020.43.3.270.
- Wozniak B, Zuchowska IM, Zmudzki J. 2013. Determination of stilbenes and resorcylic acid lactones in bovine, porcine and poultry muscle tissue by liquid chromatography–negative ion electrospray mass spectrometry and QuEChERS for sample preparation. J Chromatogr B. 940:15–23. doi: 10.1016/j.jchromb.2013.09.018.
- Xu P, Zhou X, Xu D, Xiang Y, Ling W, Chen M. 2018. Contamination and risk assessment of estrogens in livestock manure: a case study in Jiangsu province, China. Int J Environ Res Public Health. 15(1)
- Xu R, Kiarie EG, Yiannikouris A, Sun L, Karrow NA. 2022. Nutritional impact of mycotoxins in food animal production and strategies for mitigation. J Animal Sci Biotechnol. 13(1):69. doi: 10.1186/s40104-022-00714-2.
- Zöllner P, Jodlbauer J, Kleinova M, Kahlbacher H, Kuhn T, Hochsteiner W, Lindner W. 2002. Concentration levels of zearalenone and its metabolites in urine, muscle tissue, and liver samples of pigs fed with mycotoxin-contaminated oats. J Agric Food Chem. 50(9):2494–2501. doi: 10.1021/jf0113631.
- Zöllner P, Leitner A, Jodlbauer J, Mayer BX, Linder W. 2003. Improving LC-MS/MS analyses in complex food matrices, part II – mass spectrometry. LC GC Europe. 16:354–362.