
 ?Mathematical formulae have been encoded as MathML and are displayed in this HTML version using MathJax in order to improve their display. Uncheck the box to turn MathJax off. This feature requires Javascript. Click on a formula to zoom.
Abstract
The Codex Alimentarius Commission has adopted a maximum level for lead in honey (0.1 mg/kg). Despite representing a population of more than half a billion, exposure and risk assessments for lead specific to the Arab region are lacking. The aim of this work was to collect analytical data for lead in honey available in Arab countries and to assess the risk caused by exposure to lead from these samples for local consumers. A regional mean lead concentration in honey, obtained through a meta-analysis of 57 studies, was used in deterministic risk assessments for adults (nephrotoxicity and cardiovascular effects) and young children (developmental neurotoxicity). A regional pooled mean concentration of 0.12 mg/kg [95%CI: 0.07–0.21] (0.13 mg/kg, if non-detects are considered at their highest possible value) was obtained. Margins of exposure of 363 [71–17182] and 865 [168–40909] were calculated for adults, and of 48 [9–2273] for children, indicating potential concern for the latter population subset. These values were produced using GEMS consumption data, and considering the same intake for both children and adults, potentially overestimating the risk for children. Nevertheless, food competent authorities should consider measures to reduce lead concentration in honey available for sale in the region to prevent trade constraints and to better protect vulnerable populations.
Introduction
Lead is a toxic heavy metal that has been widely disseminated in the environment through its use in various industrial processes. Exposure to lead was estimated to cause approximately 1 million deaths in the year 2019 only (WHO Citation2023). Chronic exposure to lead, even at low levels, is known to have adverse effects on human health (EFSA Panel on Contaminants in the Food Chain (CONTAM) Citation2010). Children are particularly vulnerable, as the central nervous system is the main target for lead toxicity, and blood levels of lead are directly correlated with a reduction of the intelligence quotient in children (Galiciolli et al. Citation2022). In adults, lead has toxicological effects on almost all organs, with nephrotoxicity and cardiovascular effects as the major concerns (Carrington et al. Citation2019).
The leading cause of exposure to lead is human activities and, as human activities vary per country, exposure is country-specific (Obeng-Gyasi Citation2019). However, exposure also occurs via food, as lead is regularly detected in food commodities, including leafy vegetables (Othman Citation2010; Feleafel and Mirdad Citation2013; Malavolti et al. Citation2020), cereal products (Othman Citation2010; Kim et al. Citation2014), potatoes (Kim et al. Citation2014), tap water (Kim et al. Citation2014) and fish (Lee et al. Citation2019; Malavolti et al. Citation2020). Currently, honey is not considered a foodstuff of concern regarding exposure to lead. In fact, honey is often correlated with positive effects on human health (Šedík et al. Citation2019; Al-Ghamdi and Ansari Citation2021). However, it is recognized that honey is a good sentinel food product for the monitoring of pollutants and is often used in the risk assessment of several contaminants including pesticides (Ashraf et al. Citation2023), antibiotics (Ahmed et al. Citation2023), and even microplastics (Alma et al. Citation2023). Heavy metals are no exception (Lambert et al. Citation2012), and risk assessments for lead in honey have been conducted in different countries (Ru et al. Citation2013; Bommuraj et al. Citation2019; Fakhri et al. Citation2019).
The presence of lead in honey and influencing factors have been extensively studied in the scientific literature. Heavily contaminated environments will result in high levels of heavy metals in honey (Atrouse et al. Citation2004; Bosancic et al. Citation2020). However, it seems that in moderately or lightly contaminated environments, lead is not transferred from plants to honey (Bouhlali et al. Citation2019; Tomczyk et al. Citation2023). Other factors, like seasonal effects (de Oliveira Resende Ribeiro et al. Citation2015) or the botanical origin of honeys (Sahinler et al. Citation2009) could have an influence on heavy metals concentrations.
In 2022, the Codex Committee on Contaminants in Food recommended the adoption of a maximum level (ML) of 0.1 mg/kg (CAC Citation2022) for this heavy metal in honey, which was adopted by the 45th session of the Codex Alimentarius Commission in November 2022 (CAC Citation2023). Consequently, it is very likely that various food regulatory jurisdictions will follow this course of action by adopting this ML. So far, the EU is the only jurisdiction that has an enforceable ML for lead in honey (European Union Citation2023).
It is however noteworthy that the development of the Codex ML was based on the analysis of the Global Environmental Monitoring System (GEMS) data, with representation from a limited number of countries, including only one major producer (CAC Citation2022). Lead levels in honey from regions not represented in this database may differ and they may encounter trade barriers if this ML is adopted. Notably, the GEMS database does not include data for lead in honey from the Middle East/North Africa (MENA) region and the various Arab states.
The aim of the present work was to compile and evaluate previously published analytical data regarding presence of lead in honey samples, collected between 2005 and 2023 in the member states of the Arab League and to assess the risk caused by exposure to lead from these samples for local consumers.
Materials and methods
Literature search strategy
A systematic review was performed to retrieve articles related to the occurrence of lead in honey (not honeydew) within 22 countries of the Arab League. Relevant references were identified through a systematic search in Google Scholar, restricted to articles published between January 2005 and June 2023. The following terms were used: lead OR metals OR heavy metals OR trace metals OR trace elements OR elements OR metalloids OR heavy metals AND honey AND a country (Algeria, Bahrain, Comoros, Djibouti, Egypt, Iraq, Jordan, Kuwait, Saudi Arabia, Lebanon, Libya, Mauritania, Morocco, Oman, Palestine, Qatar, Somalia, Sudan, Syria, Tunisia, United Arab Emirates and Yemen). All articles from the first 10 pages of results were retrieved (per country) and screened. To increase the precision of the search, the references list of retrieved articles was also reviewed to identify additional relevant articles.
Inclusion/exclusion criteria
Inclusion criteria were defined as follows: full-text available; published in English, French or Arabic; any type of scientific article except reviews; reports lead detection (with concentration specified) or non-detection; reports number of samples screened; reports analytical method used to detect/quantify lead; if only non-detection is reported, the limit of detection (LOD) and/or limit of quantification (LOQ) of the analytical method used is specified; if detection is reported, sufficient data is available to determine a mean lead concentration and related statistics (e.g. standard deviation, standard error, relative standard deviation). Articles not meeting these criteria were excluded. Reviews and other documents published without peer-review process were also discarded. The origin of samples (i.e. country where samples were produced) was not considered as an exclusion/inclusion criterion, as honey samples tested were assumed to be available to consumers in the country where testing was conducted, regardless of their origin. In the same way, no discrimination was made based on the analytical method used. However, when several methods were used, only results for one method (i.e. atomic absorption spectroscopy) were selected.
Extracted data
The extracted data included: country where the samples were purchased, country of origin of the samples (if available); year of publication of the article; number of samples screened for lead; LOD (if available); LOQ (if available); concentration range (if available); individual lead concentration results (i.e. per sample) or average lead concentration results (i.e. for a clearly specified number of samples); standard deviation or standard error; number of samples below LOD (if available); number of samples below LOQ (if available); type of samples (e.g. individual, pooled, average, composite); authors and DOI number. Raw data and individual results were privileged instead of average results when available. The data is available in the supplementary data file.
Meta-analysis
A meta-analysis of the mean lead concentrations in honey reported in the selected publications ( and ) was conducted. Lead concentration (fresh weight) means and standard deviations were either (i) directly extracted from publications (i.e. when aggregated mean concentration and standard deviation results for a single set of samples were reported), (ii) calculated using standard formulas for arithmetic mean and standard deviation (i.e. when individual per-sample lead concentration measurements were reported), or (iii) calculated using weighted mean and standard deviation formulas (i.e. when aggregated mean concentration and standard deviation results of several sample sets were presented). Non-detect results were treated following two substitution scenarios, as suggested by the GEMS – Food Contamination Monitoring and Assessment Programme (GEMS/Food-EURO Citation1995): they were assumed to be 0, or they were assumed to be the LOD reported in the study. If the study did not report the LOD, the LOQ was used. If the study did not report the LOD nor the LOQ, the lowest reported measurement was used.
Figure 1. Selection process for the studies included in the meta-analysis.
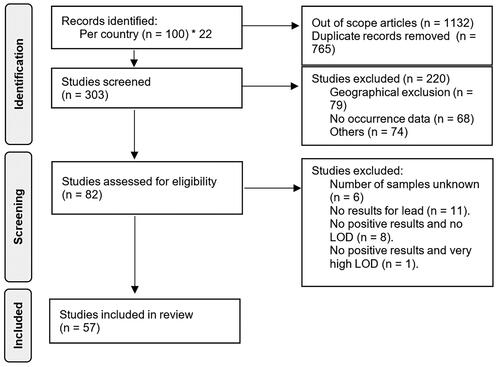
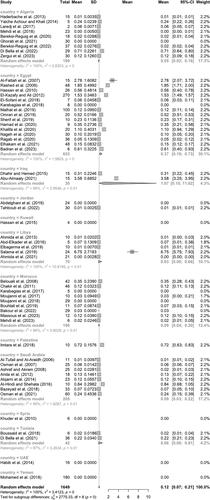
Figure 2. Pooled mean lead concentrations (mg/kg) in honey in the Arab region and per country, when nondetects were assumed to be 0. Abdelghani et al. Citation2019; Abd-Elkader et al. Citation2016; Ahmida et al. Citation2013; Ahmida et al. Citation2021; Al Tufail & Al Araidh Citation2006; Al-Hindi & Shehata Citation2014; Alqarni et al. Citation2014; Arida et al. Citation2012; Ashraf & Akram Citation2008; Badran et al. Citation2023; Bakour et al. Citation2022; Bazeyad et al. Citation2019; Belouali et al. Citation2008; Bereksi-Reguig et al. Citation2020; Bereksi-Reguig et al. Citation2022; Boussaid et al. Citation2018; Chakir et al. Citation2011; Dhahir & Hemed Citation2015; Di Bella et al. Citation2021; Elbagerma et al. Citation2019; Elhakam et al. Citation2021; El-Sofany et al. Citation2018; Ghorab et al. Citation2021; Habib et al. Citation2014; Haderbache et al. Citation2013; Hamad et al. Citation2020; Hassan et al. Citation2010; Hassan et al. Citation2015; Karabagias et al. Citation2017; Karabagias et al. Citation2018; Khuder et al. Citation2010; Laredj et al. Citation2017; Malhat et al. Citation2019; Massous et al. Citation2023; Mehdi et al. Citation2018; Mehdi et al. Citation2023; Mohammed et al. Citation2018; Moujanni et al. Citation2018; Moujanni et al. Citation2017; Nageh et al. Citation2020; Omran et al. Citation2019; Osman et al. Citation2007; Osman et al. Citation2021; Ragab et al. Citation2020; Sherif et al. Citation2019; Tahboub et al. Citation2022; Yaiche Achour & Khali Citation2014; Zergui et al. Citation2023.
Mean lead concentrations were analysed for the region and per country. Between-study heterogeneity was assessed using I2 and heterogeneity variance (τ2), and determined to be high ( and ), as expected. Thus, pooled means were estimated using the random effects model (REM). Standard Knapp-Hartung adjustments to calculate the confidence intervals of the pooled means were not applied, as this would lead to unrealistic intervals for certain country subgroups (i.e. Iraq, Tunisia) consisting of few studies with high variability (Friede et al. Citation2017). The restricted maximum-likelihood τ2 estimator was used, as recommended for continuous outcome data (Harrer et al. Citation2021). Considering that most mean values were close to zero, a log-transformation was applied, preventing the lower bounds of the confidence intervals from including negative values. Means were automatically transformed back to non-log scale in the outputs of the REM and forest plots. Publication bias was evaluated using Begg’s funnel plot and Egger’s test. Subgroup differences (i.e. per country) were assessed with Cochran’s Q test. Statistical analyses were performed using the R packages meta (Balduzzi et al. Citation2019) and dmetar (Harrer et al. Citation2019) in RStudio (RStudio Team Citation2020), R version 4.2.1.
Deterministic health risk assessment
The estimated daily intake (EDI) of lead from consumption of honey, expressed in μg lead per kg of body weight per day, was calculated as:
The pooled mean lead concentration obtained from the meta-analysis when non-detects were replaced by LOD, LOQ or the lowest reported measurement of the study () was used, converted to μg/kg. The daily intake of honey consumed per specific countries’ diets was estimated based on GEMS/Food Regional Diets from 2012: 0.00022 kg per day for Algeria, Iraq, Jordan, Libya, Morocco, Palestine, Syria, Tunisia and Yemen; 0.00141 kg per day for Egypt; and 0.0011 kg per day for Saudi Arabia (Sy et al. Citation2013; [FAO/WHO] FAO/WHO IEDI Calculation Template 17-Cluster Diet 2022). A daily intake of honey for the whole region was estimated based on GEMS/Food Regional Diets from 2003 (0.0008 kg per day) (WHO Citation2003). We also used this daily intake for countries for which honey consumption data were not available (Kuwait and United Arab Emirates). For the purpose of this risk assessment, honey intake was assumed to be identical for adults and children, since no data specific to children were available. Body weights of 60 kg for adults and 10 kg for young children (WHO Citation2017) were used.
The health risk posed by chronic exposure to lead from consumption of honey was assessed using the margin of exposure (MOE), calculated as:
Oral reference levels representing safe exposure to lead have not been set, as toxicological thresholds for the occurrence of adverse health effects in humans have not been identified and are assumed to be extremely low (Smith et al. Citation2021). Notably, in 1999, the FAO/WHO Joint Expert Committee on Food Additives (JECFA) set a provisional tolerable weekly intake of 25 µg/kg bw/day, which was withdrawn in 2011 as the committee determined no safe levels of lead could be established (JECFA Citation2011). Thus, in the absence of internationally recognized safe levels for lead, this risk assessment is based on benchmark doses reported by the European Food Safety Authority’s (EFSA) Panel on Contaminants in the Food Chain (CONTAM Panel) (EFSA Panel on Contaminants in the Food Chain (CONTAM) Citation2010), interpreted using a MOE approach (EFSA Citation2023). The CONTAM Panel considered developmental neurotoxicity in young children, and cardiovascular effects and nephrotoxicity in adults, as the critical effects for lead risk assessment, and used the lower 95% confidence limit of the benchmark dose (BMDL) for the observed adverse health effects – based on blood lead levels and expressed as dietary intakes – as reference point in their risk assessment (EFSA Panel on Contaminants in the Food Chain (CONTAM) Citation2010). For comparison, the blood lead levels associated with a decrease of 1 IQ point in children estimated by JECFA (Citation2011) and the CONTAM Panel (EFSA Panel on Contaminants in the Food Chain (CONTAM) Citation2010) are quite similar (i.e. 5.1 µg/dL and 5.6 µg/dL, respectively, when using a linear model, and 1.8 µg/dl and 2.3 µg/dL, respectively, when using a bilinear model). In their risk assessment (EFSA Panel on Contaminants in the Food Chain (CONTAM) Citation2010), for developmental neurotoxicity in young children and for cardiovascular effects in adults, a BMDL of 1% (i.e. benchmark response = 1 IQ point and = 1.2 mm Hg systolic blood pressure, respectively) was selected by the Panel (i.e. BMDL01 developmental = 0.5 μg lead per kg of body weight per day, and BMDL01 cardiovascular = 1.50 μg lead per kg body weight per day). For nephrotoxicity in adults, based on the prevalence of chronic kidney disease, the Panel selected a BMDL of 10% (i.e. BMDL10 nephrotoxicity = 0.63 μg lead per kg body weight per day). In our study, these BMDL values were used to calculate the MOE (). In alignment with the Panel’s interpretation, MOE ≥10 was considered of no concern for all three adverse effects (i.e. developmental neurotoxicity in young children, and cardiovascular effects and nephrotoxicity in adults). For developmental neurotoxicity in young children, at MOE between 1 and 10, the risk is likely to be low, but not such that it could be dismissed as of no potential concern (EFSA Panel on Contaminants in the Food Chain (CONTAM) Citation2010).
Results
Characteristics of studies
In total, 57 articles were selected after the screening process () and used for the meta-analysis, representing studies from 13/22 countries of the MENA region, and a total of 1649 observations. No data were retrieved from Bahrain, Comoros, Djibouti, Lebanon, Mauritania, Oman, Qatar, Somalia, and Sudan. Major contributors were Egypt (15 studies), Algeria and Morocco (9 studies each), Saudi Arabia (8 studies), and to a certain extent, Libya (5 studies). For other countries, only one or two studies were selected after the screening process. Among the 57 articles included in the meta-analysis, 24 were published in high-ranking indexed journal (i.e. journals considered as Q1 or Q2 on SCImago (Falagas et al. Citation2008)), 12 in medium/low ranking indexed journals (i.e. Q3 and Q4 on SCImago), and 24 in not indexed but peer-reviewed journals.
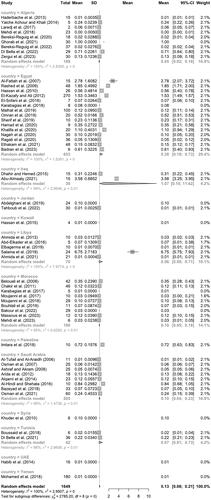
Figure 3. Pooled mean lead concentrations (mg/kg) in honey in the Arab region and per country, when nondetects were assumed to be LOD/LOQ/lowest reported measurement.
Meta-analysis
Heterogeneity
Meta-analysis results are presented as forest plots in and . When non-detects were assumed to be 0, the overall τ2 was calculated as 3.4123 [95%CI: 2.3319–5.4379], with an I2 of 100%. When non-detects were assumed to be LOD, LOQ or the lowest measurement, τ2 was calculated as 2.9380 [95%CI: 2.0073–4.5918], with an I2 of 100%. These values confirmed the high between-study heterogeneity anticipated, and the choice of REM to estimate pooled means. Assessment of publication bias in the entire data set resulted in relatively symmetrical funnel plots ( and ). Egger’s test results were not significant (p > 0.01) for both substitution scenarios (), indicating absence of publication bias (i.e. results included in the meta-analysis do not differ systematically from unpublished or unavailable results).
Figure 4. Funnel plot of the mean lead concentration in mg/kg (log scale) in honey in the Arab region, against the standard error of each publication included in the meta-analysis, when non-detects were assumed to be 0. Dashed lines indicate the pooled mean (log scale) and 95% confidence interval.
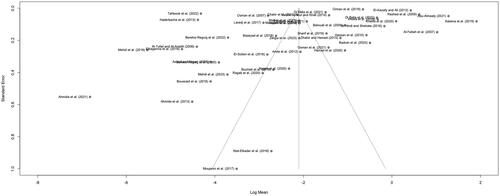
Figure 5. Funnel plot of the mean lead concentration in mg/kg (log scale) in honey in the Arab region, against the standard error of each publication included in the meta-analysis, when non-detects were assumed to be LOD/LOQ/lowest reported measurement. Dashed lines indicate the pooled mean (log scale) and 95% confidence interval.
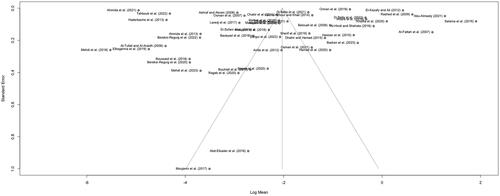
Table 1. Linear regression tests of funnel plots asymmetry (Egger’s test) when non-detects were assumed to be 0 or LOD/LOQ/lowest reported measurement.
Pooled means
Results are expressed in fresh weight. When non-detects were assumed to be 0 (), a regional pooled mean concentration of lead of 0.12 mg/kg [95%CI: 0.07–0.21] was obtained. Q test results (χ2; 8 degrees of freedom = 2775.33) indicated significant differences (p < 0.01) between subgroups’ (i.e. countries) means. When non-detects were assumed to be LOD, LOQ or the lowest reported measurement (), a regional pooled mean concentration of lead of 0.13 mg/kg [95%CI: 0.08–0.21] was obtained. Q test results (χ2; 8 degrees of freedom = 2796.74) also indicated significant differences (p < 0.01) between subgroups’ means. For both non-detects substitution scenarios, country-specific pooled mean lead concentrations were obtained for Algeria, Egypt, Iraq, Saudi Arabia, Libya, Morocco, and Tunisia. For the remaining countries, the number of studies was not sufficient to conduct a country-specific meta-analysis. Country-specific means ranged from 0.03 mg/kg (Libya) to 1.07 mg/kg (Iraq), when non-detects were assumed to be 0, and from 0.05 mg/kg (Algeria) to 1.07 mg/kg (Iraq), when non-detects were assumed to be a threshold quantity. The estimates for Iraq, however, are based on only 2 studies and include a wide confidence interval. The second highest pooled mean concentration, based on 15 studies, was obtained for Egypt (0.37 mg/kg and 0.38 mg/kg, when non-detects were assumed to be 0 or a threshold quantity, respectively).
Deterministic risk assessment
Risk was assessed considering mean lead concentrations obtained when non-detects were assumed to be a threshold quantity (i.e. LOD, LOQ or the lowest reported measurement), as a worst-case scenario. Given that consumption was higher in Egypt, this country ranked as the highest risk for the region, and Jordan, Kuwait, United Arab Emirates (UAE) and Yemen, the lowest (). For the Arab region, MOE of 363 (nephrotoxicity) and of 865 (cardiovascular) were obtained for adults. For young children, the regional MOE was 48. Egypt was the only country with an estimated MOE below 10 (developmental neurotoxicity in young children), suggesting that exposure to lead through honey may represent a health risk for this population.
Table 2. Margin of exposure (MOE) and estimated daily intake (EDI; in μg per kg of body weight per day) of lead from consumption of honey in the Arab region, based on mean lead concentrations estimated when non-detects were assumed to be LOD, LOQ or the lowest reported measurement of the study.
Discussion
This study assessed the risk posed by the presence of lead in honey in member states of the Arab League, using previously published lead concentration data from 13/22 (59%) countries of the region. Most countries with no available data are countries not known for an important honey production (e.g. Djibouti, Kuwait, Palestine, Qatar). Nevertheless, the absence of data for Lebanon is concerning and may be explained by the poor documentation practices of their beekeeping sector (El Hajj et al. Citation2023). Major data contributors were situated in North Africa, except for Saudi Arabia, and all possess a strong history of beekeeping (Al-Ghamdi and Nuru Citation2013, Hussein Citation2000).
Overall, the characteristics of the meta-analysis conducted (i.e. similar weights assigned to each study) are typical of studies with minimal within-study variance but substantial between-studies variance (Borenstein et al. Citation2010). Although a pooled mean concentration of lead in honey – with a relatively precise confidence interval – was obtained for the Arab region, different countries may have significantly different means. However, to further investigate this hypothesis, an increased number of studies per country would be required, especially for countries with little representation in the meta-analysis (e.g. Iraq, Jordan, Kuwait, Palestine, Syria, Tunisia, UAE, Yemen). The high between-studies heterogeneity observed (I2 > 99%) was expected, considering the different analytical methodologies, laboratory practices, sampling schemes, etc. applied in each study. Several countries like Palestine, Iraq, Syria, Libya, or Yemen also presented several armed conflicts during the covered period which could lead to high variability in the results (Skalny et al. Citation2021). Potential between-subgroups differences (i.e. significant differences between countries’ means, as suggested by Q test results), which would require more comprehensive data to be properly characterized, may be related to geographical and/or climate conditions influencing the production of honey in each country.
The meta-analysis approach provides a valuable tool for the analysis of existing data; it allowed us to exploit results collected in a wide geographic area and use them to assess regional risk. This approach, however, relies on the robustness of the published analytical results, which, in our study, was assessed through the literature review’s inclusion/exclusion criteria. Although some studies (n = 24) included in the meta-analysis were published in non-indexed journals, there were no valid reasons (statistical or other) to exclude them from the meta-analysis, even if the peer-review process could be challenged. Moreover, considering the limited funding for research activities (e.g. article publishing fees) in this region, we chose to include all studies that met the defined criteria, regardless of the journal of publication. Three countries were represented by data published only in non-indexed journals (i.e. Libya, 5 articles; Iraq, 2 articles; and Kuwait, 1 article) and these results may have been subjected to a lesser scrutiny. Similarly, 9 articles out of 15 from Egypt were retrieved from non-indexed journals. In addition, regardless of the journal of publication, the data retrieved may not be fully representative of the concentration of lead in honey in the region. In particular, sampling plans and location may be biased towards high-risk situations (i.e. from cities or industrial areas). Also, although Egger’s test results indicate no publication bias, in studies of this nature (i.e. detection of a contaminant in food), it is possible that ‘negative’ (non-detects) are less likely to be published than ‘positive’ results. Indeed, most of the published studies included in this meta-analysis report detection and quantification with very low standard error ( and ), as also seen in meta-analyses of other food contaminants (Rahmani et al. Citation2018). In addition, studies reporting non-detection only and that did not disclose LOD or LOQ were excluded, which further reduced the number of ‘negative’ observations. For this reason, we decided to use the lowest reported measurement when LOD and LOQ were not available, thus avoiding rejecting certain studies. In our case, the number of data points where this substitution was applied involved was 57 out of 1649 (see supplementary data), and the maximal substitution concentration used was 0.5 mg/kg, which is below some of the LOQs of studies included in this meta-analysis. Furthermore, the difference between pooled means calculated assuming non-detects to be 0 or a threshold quantity (i.e. LOD, LOQ or lowest reported measurement) was minimal (0.12 mg/kg [0.07–0.21] versus 0.13 mg/kg [0.08–0.21]), showcasing the limited number of non-detect substitutions in the meta-analysis, and therefore, their limited influence. The potential lack of representation of ‘negative’ results limits the interpretation of prevalence of lead in honey in the Arab region. Nevertheless, data used in this study tend overall towards an overestimation of the exposure to lead from honey.
In general, regulatory agencies apply Codex guidance and manage lead in food based on the ‘As Low As Reasonably Achievable’ principle, advising producers to control and prevent points of introduction of this contaminant (Codex Alimentarius Citation1995). Regulatory agencies usually monitor lead levels in honey as a sentinel product to track environmental pollution (Smith et al. Citation2021), but do not necessarily use MLs to mitigate lead exposure. For instance, threshold lead levels may be used to indicate the need for efforts to mitigate contamination problems and reduce potential lead sources during the food production process (Government of Canada, 2023). Interestingly, the regional mean lead concentration obtained based on this meta-analysis is higher than 0.1 mg/kg, indicating that most Arab honeys could be potentially rejected by countries that decide to adopt the Codex ML. Of the 57 articles included in the meta-analysis, 27 presented means ≥ 0.1 mg/kg, including 6 with reported means >1 mg/kg (4 in Egypt, 1 in Iraq and 1 in Libya). This suggests that Arab regulatory agencies could take measures to reduce lead levels in honey, for example by replacing processing equipment or modifying storage conditions, as well as directing beekeepers to selected areas of harvest that are likely to be less impacted by environmental lead contamination. This could even lead to prohibiting honey production in certain areas based on a close monitoring of the impact of environmental pollution on this industry.
At first glance, exposure to lead from honey seems to convey a low or moderate concern for adults in the region, based on this risk assessment’s results, featuring MOEs >100 (). However, the estimated risks for young children may raise the level of concern, with MOEs <10 for Egypt (). For a consumption fixed at 0.8 g per day, and without considering any other lead sources, we estimate that a mean lead concentration of 0.63 mg/kg in honey would result in an MOE of 10 for developmental neurotoxicity, suggesting a potential concern for young children. Concentrations of lead in honey ≥ 0.63 mg/kg have been reported in Algeria (Di Bella et al. Citation2022), Egypt (Al-Fattah et al. Citation2007; Rashed et al. Citation2009; El-Kazafy and Ali Citation2012; Khalifa et al. Citation2020), Iraq (Abu-Almaaly Citation2021), Libya (Salama et al. Citation2019) and Palestine (Imtara et al. Citation2018). However, adult consumption was assumed in this risk assessment, which is likely an overestimation, thus leading to an overestimation of developmental risk for children. Similarly, we estimate that mean lead concentrations of 4.7 mg/kg and 11.3 mg/kg would indicate a potential concern (nephrotoxicity and cardiovascular effects, respectively) in adults. Concentrations of lead in honey ≥ 4.7 mg/kg have been reported in Libya (Salama et al. Citation2019), representing products not suitable for human consumption on the long-term, according to the results of this risk assessment. Other than using lead MLs as an indicator of potentially unfit food items, another approach is the one applied by the US Food and Drug Administration, which considers interim reference levels for lead from food (2.2 μg per day for children 0-6 and 7+ years of age, and 8.8 μg per day for women of childbearing age) as benchmarks to evaluate whether an estimated exposure is a potential concern (Flannery and Middleton Citation2022). They use these values to determine on a case-by-case basis when a food item is contributing significantly to lead exposure to support recall and import rejections. For comparison, daily consumption of 22 g (or approximately 3 teaspoons) of ‘average’ honey from the Arab region would represent a lead intake of 2.2 μg.
Nonetheless, lead exposure through food comes mainly from sources other than honey, and honey is a minimal contributor given the small amounts consumed per day. For example, lead exposure is mostly linked to consumption of bread, fish, and tomatoes in Egypt (Loutfy et al. Citation2012), and to vegetables, cereals and cereal products, and beverages in Saudi Arabia (Othman Citation2010). According to the GEMS database, honey consumption is low in several countries of the region (less than 1 g per day), and only Egypt and Saudi Arabia have an average consumption of honey above 1 g per day, which limits the impact of honey as an exposure vehicle. If the pooled mean lead concentration reported in this study is maintained (i.e. 0.13 mg/kg), as well as the body weight assumptions, we estimate that a daily honey intake of 3.9 g would be required for young children to be at risk (MOE = 10) (0.5 g in Iraq – 50 g in Jordan, Kuwait, UAE and Yemen), and of 29.1 g and 69.2 g for adults to be at risk (nephrotoxicity and cardiovascular effects, respectively). This indicates that honey could be an issue for people with high consumption rates. For example, honey may become a significant contributor to lead exposure if it is further consumed as a substitute for sugar sources and/or as a result of its known health benefits, which may encourage consumers to increase its intake on a regular basis.
Certain important limitations may affect the results of this risk assessment. Notably, we used a deterministic risk assessment approach instead of a probabilistic one, which does not allow for a comprehensive overview of the risk range. In addition, the only variable considered (i.e. mean lead concentration) was simulated based on results for most but not all Arab countries. Thus, regional or seasonal variations may not have been fully captured in the meta-analysis, as discussed above. Like in many other risk assessments, the most important limitation was the lack of robust and representative food consumption data (i.e. per country, per age group), available as a distribution and not as an aggregated mean. For example, reliance on GEMS consumption data, although data consumption per cluster and a mean regional value are available, did not allow us to study the effect of potential over consumption. In addition, to fully capture the risks for specific populations (e.g. beekeepers), the availability of targeted consumption data would have been valuable. This is important for young children, a population particularly vulnerable to lead’s adverse health effects, as the assumption of a universal mean daily intake for all age groups is unlikely. Consequently, our results for young children should be taken with caution, as their consumption was probably overestimated. Finally, this study assessed the risk posed by exposure to lead through honey exclusively, and does not consider other, potentially more important, food sources.
Conclusion
A meta-analysis was performed on 57 studies reporting lead concentrations in honey samples in the Arab region, to estimate a pooled mean. This concentration was used in a deterministic risk assessment on 3 toxicological impacts caused by lead. The meta-analysis indicated that the region could be considered as an entity in terms of lead concentration in honey, so countries with few data points could use regional values for their own risk assessment needs, or country-specific data for major contributors. Risk assessment indicates that exposure to lead from honey may represent a moderate concern for adults and even a higher concern for young children in some countries of the region (e.g. Iraq, Palestine). Given the overestimation of exposure levels resulting from the reliance on a deterministic assessment, and the limitation in the estimation of actual honey intakes in the region, it is highly advised that investments be made to develop representative consumption data from the region and to conduct the relevant probabilistic exposure assessment. Overall, Arab countries, particularly those where higher levels of lead in honey were reported, are advised to conduct their own risk assessment and to develop corresponding exposure reduction scenarios for their respective populations.
Authorship contribution
Jérémie Théolier: Writing – original draft, Investigation, Formal analysis, Validation, Conceptualization. Silvia Dominguez: Writing – original draft, Data curation, Formal analysis, Validation, Visualization. Samuel Godefroy: Writing – review & editing, Project administration, Funding acquisition, Conceptualization, Resources.
Supplemental Material
Download MS Excel (145.1 KB)Disclosure statement
Samuel Godefroy’s research activities are funded by the Ministry of Agriculture, Fisheries, and Food, Government of Quebec, Canada; the Ministry of Science, Technology, and Innovation, Government of Quebec; Canada’s Innovation Foundation; the U.S. Department of Agriculture Foreign Agriculture Service; R-Biopharm GmbH; and R-Biopharm Canada Inc. Samuel Godefroy acts as an expert advisor for members of the food and beverage industry, international organizations (the Food and Agriculture Organization of the United Nations, the United Nations Industrial Development Organization, and the World Bank), and international food regulators such as the China National Centre for Food Safety Risk Assessment and consumer organizations such as Food Allergy Canada. Samuel Godefroy is the Board President of the Global Food Regulatory Science Society (GFoRSS). The other authors declare that they have no conflicts of interest.
Correction Statement
This article has been corrected with minor changes. These changes do not impact the academic content of the article.
Additional information
Funding
References
- Abdelghani JI, Abu-Nameh ES, Zaitoun ST, Abu-Zir AI. 2019. Preliminary study of the influence of mineral content on quality parameters of Jordanian-origin honey collected from different geographical regions. J Food Sci Technol. 56(11):4817–4825. doi: 10.1007/s13197-019-03942-z.
- Abd-Elkader RE, Bellail AA, Attia AI, Mousa MM, Hamied IA. 2016. Mineral content and antioxidant activity of different sample of Libyan bees honey. J Nucl Technol Appl Sci. 4(3):123–135.
- Abu-Almaaly RA. 2021. Effect of local honey production areas on its content of some heavy metals. Iraqi J Mark Res Consum Prot. 13(2):116–124. doi: 10.28936/jmracpc13.2.2021.(10).
- Ahmed MBM, Taha AA, Mehaya FMS. 2023. Method validation and risk assessment for sulfonamides and tetracyclines in bees’ honey from Egypt, Libya and Saudi Arabia. Environ Geochem Health. 45(3):997–1011. doi: 10.1007/s10653-022-01258-0.
- Ahmida MHS, Elwerfali S, Agha A, Elagori M, Ahmida NHS. 2013. Physicochemical, heavy metals and phenolic compounds analysis of Libyan honey samples collected from Benghazi during 2009–2010. FNS. 04(01):33–40. doi: 10.4236/fns.2013.41006.
- Ahmida NHS, Towier NH, Shaboun S, Rahil S, Ahmida A, Randa E, Elgazali A. 2021. The contents of some macro and trace elements in uniflora and multiflora honey samples collected from three regions in east Libya. Adv J Chem B. 3(4):361–374. doi: 10.22034/ajcb.2021.316305.1099.
- Al Tufail MA, Al Araidh IA. 2006. Comparative study of 11 honey samples sold in Riyadh Saudi Arabia. Qatar Univ Sci J. 26:123–133.
- Al-Fattah MA, Tharwat EE, Ewies MA, Farag RM. 2007. The major honeys as indicators of metals in the Egyptian environment. J Plant Prot Pathol. 32(6):4853–4860. doi: 10.21608/jppp.2007.219644.
- Al-Ghamdi A, Nuru A. 2013. Beekeeping in the kingdom of Saudi Arabia opportunities and challenges. Bee World. 90(3):54–57. doi: 10.1080/0005772X.2013.11417543.
- Al-Ghamdi AA, Ansari MJ. 2021. Biological and therapeutic roles of Saudi Arabian honey: a comparative review. J King Saud Univ Sci. 33(2):101329. doi: 10.1016/j.jksus.2020.101329.
- Al-Hindi RR, Shehata A. 2014. Evaluation of antioxidant and antibacterial activities and essential elements content of locally produced honey in Saudi Arabia. Life Sci J. 11(5):175–185.
- Alma AM, de Groot GS, Buteler M. 2023. Microplastics incorporated by honeybees from food are transferred to honey, wax and larvae. Environ Pollut. 320:121078. doi: 10.1016/j.envpol.2023.121078.
- Alqarni AS, Owayss AA, Mahmoud AA, Hannan MA. 2014. Mineral content and physical properties of local and imported honeys in Saudi Arabia. J Saudi Chem Soc. 18(5):618–625. doi: 10.1016/j.jscs.2012.11.009.
- Arida H, Hassan R, El-Naggar A. 2012. Quality assessment of honey using modern analytical tools. Anal Lett. 45(11):1526–1536. doi: 10.1080/00032719.2012.675492.
- Ashraf MW, Akram S. 2008. Physicochemical characteristics and heavy metal contents of Saudi Arabian floral honeys. Fresenius Environ Bull. 17(7b):877–881.
- Ashraf SA, Mahmood D, Elkhalifa AEO, Siddiqui AJ, Khan MI, Ashfaq F, Patel M, Snoussi M, Kieliszek M, Adnan M. 2023. Exposure to pesticide residues in honey and its potential cancer risk assessment. Food Chem Toxicol. 180:114014. doi: 10.1016/j.fct.2023.114014.
- Atrouse OM, Oran SA, Al‐Abbadi SY. 2004. Chemical analysis and identification of pollen grains from different jordanian honey samples. Int J of Food Sci Tech. 39(4):413–417. doi: 10.1111/j.1365-2621.2004.00798.x.
- Badran GF, Atta MB, Badr MR. 2023. Physicochemical characteristics of citrus and clover honey collected from different Egyptian regions. J Sustain Agric Sci. 2(1):99–114. doi: 10.21608/jsaes.2023.192613.1031.
- Bakour M, Laaroussi H, Ferreira-Santos P, Genisheva Z, Ousaaid D, Teixeira JA, Lyoussi B. 2022. Exploring the palynological, chemical, and bioactive properties of non-studied bee pollen and honey from Morocco. Molecules. 27(18):5777. doi: 10.3390/molecules27185777.
- Balduzzi S, Rücker G, Schwarzer G. 2019. How to perform a meta-analysis with R: a practical tutorial. Evid Based Ment Health. 22(4):153–160. doi: 10.1136/ebmental-2019-300117.31563865.
- Bazeyad AY, Al-Sarar AS, Rushdi AI, Hassanin AS, Abobakr Y. 2019. Levels of heavy metals in a multifloral Saudi honey. Environ Sci Pollut Res Int. 26(4):3946–3953. doi: 10.1007/s11356-018-3909-7.
- Belouali H, Bouaka M, Hakkou A. 2008. Determination of some major and minor elements in the east of Morocco honeys through inductively coupled plasma optical emission spectrometry. Apiacta. 43:17–24.
- Bereksi-Reguig D, Allali H, Bouchentouf S, Adamczuk A, Kowalska G, Kowalski R. 2020. Analysis of trace-elements and toxic heavy metals in honeys from Tlemcen Province, north-western Algeria. Agric Conspec Sci. 85(4):367–374.
- Bereksi-Reguig D, Bouchentouf S, Allali H, Adamczuk A, Kowalska G, Kowalski R. 2022. Trace elements and heavy metal contents in west Algerian natural honey. J Anal Methods Chem. 2022:e7890856. doi: 10.1155/2022/7890856.
- Bommuraj V, Chen Y, Klein H, Sperling R, Barel S, Shimshoni JA. 2019. Pesticide and trace element residues in honey and beeswax combs from Israel in association with human risk assessment and honey adulteration. Food Chem. 299:125123. doi: 10.1016/j.foodchem.2019.125123.
- Borenstein M, Hedges LV, Higgins JPT, Rothstein HR. 2010. A basic introduction to fixed-effect and random-effects models for meta-analysis. Res Synth Methods. 1(2):97–111. doi: 10.1002/jrsm.12.
- Bosancic B, Zabic M, Mihajlovic D, Samardzic J, Mirjanic G. 2020. Comparative study of toxic heavy metal residues and other properties of honey from different environmental production systems. Environ Sci Pollut Res Int. 27(30):38200–38211. doi: 10.1007/s11356-020-09882-y.
- Bouhlali E, Dine T, Bammou M, Sellam K, El Midaoui A, Bourkhis B, Ennassir J, Alem C, Filali-Zegzouti Y. 2019. Physicochemical properties of eleven monofloral honey samples produced in Morocco. Arab J Basic Appl Sci. 26(1):476–487. doi: 10.1080/25765299.2019.1687119.
- Boussaid A, Chouaibi M, Rezig L, Hellal R, Donsì F, Ferrari G, Hamdi S. 2018. Physicochemical and bioactive properties of six honey samples from various floral origins from Tunisia. Arab J Chem. 11(2):265–274. doi: 10.1016/j.arabjc.2014.08.011.
- [CAC] Codex Alimentarius Commission 2022. Report of the 15th session of the codex committee on contaminants in food. REP22/CF15. https://www.fao.org/fao-who-codexalimentarius/committees/committee/related-meetings/pt/?committee=CCCF.
- [CAC] Codex Alimentarius Commission. 2023. Codex Alimentarius Commission – 45th session. REP22/CAC. https://www.fao.org/fao-who-codexalimentarius/committees/cac/meetings/pt/
- Carrington C, Devleesschauwer B, Gibb HJ, Bolger PM. 2019. Global burden of intellectual disability resulting from dietary exposure to lead, 2015. Environ Res. 172:420–429. doi: 10.1016/j.envres.2019.02.023.
- Chakir A, Romane A, Barbagianni N, Bartoli D. 2011. Major and trace elements in different types of Moroccan honeys. Aust J Basic Appl Sci. 5(4):223–231.
- Codex Alimentarius. 1995. General standard for contaminants and toxins in food and feed. CXS 193-1995. https://www.fao.org/fao-who-codexalimentarius/sh-proxy/en/?lnk=1&url=https%253A%252F%252Fworkspace.fao.org%252Fsites%252Fcodex%252FStandards%252FCXS%2B193-1995%252FCXS_193e.pdf.
- de Oliveira Resende Ribeiro R, Mársico ET, da Silva Carneiro C, Simoes JS, da Silva Ferreira M, de Jesus EFO, Almeida E, Junior CAC. 2015. Seasonal variation in trace and minor elements in Brazilian honey by total reflection X-ray fluorescence. Environ Monit Assess. 187(3):96. doi: 10.1007/s10661-015-4284-1.
- Dhahir S, Hemed AH. 2015. Determination of heavy metals and trace element levels in honey samples from different regions of Iraq and compared with other kind. Am J Appl Chem. 3(3):83. doi: 10.11648/j.ajac.20150303.11.
- Di Bella G, Licata P, Potortì AG, Crupi R, Nava V, Qada B, Rando R, Bartolomeo G, Dugo G, Turco VL. 2022. Mineral content and physico-chemical parameters of honey from north regions of Algeria. Nat Prod Res. 36(2):636–643. doi: 10.1080/14786419.2020.1791110.
- Di Bella G, Potortì AG, Beltifa A, Ben Mansour H, Nava V, Lo Turco V. 2021. Discrimination of Tunisian honey by mineral and trace element chemometrics profiling. Foods. 10(4):724. doi: 10.3390/foods10040724.
- [EFSA] European Food Safety Authority 2023. Margin of exposure. https://www.efsa.europa.eu/en/topics/topic/margin-exposure.
- EFSA Panel on Contaminants in the Food Chain (CONTAM). 2010. Scientific opinion on lead in food. EFSA J. 8(4):1570. doi: 10.2903/j.efsa.2010.1570.
- El Hajj R, Nemer N, Skaff W, Estephan N. 2023. Multivariate approach to analyzing survey data: a case study of beekeeping in Lebanon. J Apic Res. 62(3):459–467. doi: 10.1080/00218839.2021.1987739.
- Elbagerma M, Mayouf J, Twaish T, Edwards H. 2019. Analysis of trace and essential elements, phenolic and flavonoid compounds in Libyan honey samples collected from Misurata markets. To Chem J. 2:37–46.
- Elhakam AHA, Moselhy WA, Abdel-Gawad DRI, Abdou KAH. 2021. Honey as a bio indicator of the environmental pollution and its risk assessment in El-Minya province. Turk Online J Qual Inq. 12(9):1685–1701.
- El-Kazafy AT, Ali MAM. 2012. Determination of heavy metals content in cotton honey in Kafr El-Shiekh province, Egypt. J Plant Prot Pathol. 3(11):1211–1219. doi: 10.21608/jppp.2012.84409.
- El-Sofany A, Al Naggar Y, Naiem E, Seif A. 2018. Characterization of Apis mellifera honey of different botanical and geographical origins in Egypt. Egypt J Exp Biol (Zoo.). 14(1):75. doi: 10.5455/egysebz.20180523104927.
- European Union. 2023. Commission Regulation (EU) 2023/915 of 25 April 2023 on maximum levels for certain contaminants in food and repealing Regulation (EC) No 1881/2006. https://eur-lex.europa.eu/legal-content/EN/TXT/?uri=CELEX%3A02023R0915-20230810&qid=1696273658953.
- Fakhri Y, Abtahi M, Atamaleki A, Raoofi A, Atabati H, Asadi A, Miri A, Shamloo E, Alinejad A, Keramati H, et al. 2019. The concentration of potentially toxic elements (PTEs) in honey: a global systematic review and meta-analysis and risk assessment. Trends Food Sci Technol. 91:498–506. doi: 10.1016/j.tifs.2019.07.011.
- Falagas ME, Kouranos VD, Arencibia-Jorge R, Karageorgopoulos DE. 2008. Comparison of SCImago journal rank indicator with journal impact factor. FASEB J. 22(8):2623–2628. doi: 10.1096/fj.08-107938.
- [FAO/WHO] FAO/WHO IEDI Calculation Template 17-Cluster Diet. 2022. https://cdn.who.int/media/docs/default-source/food-safety/gems-food/iedi-calculation-vs04-17clusters.xlsx.
- Feleafel MN, Mirdad ZM. 2013. Hazard and effects of pollution by lead on vegetable crops. J Agric Environ Ethics. 26(3):547–567. doi: 10.1007/s10806-012-9403-1.
- Flannery BM, Middleton KB. 2022. Updated interim reference levels for dietary lead to support FDA’s closer to zero action plan. Regul Toxicol Pharmacol. 133:105202. doi: 10.1016/j.yrtph.2022.105202.
- Friede T, Röver C, Wandel S, Neuenschwander B. 2017. Meta-analysis of two studies in the presence of heterogeneity with applications in rare diseases. Biom J. 59(4):658–671. doi: 10.1002/bimj.201500236.
- Galiciolli MEA, Lima LS, da Costa N de S, de Andrade DP, Irioda AC, Oliveira CS. 2022. IQ alteration induced by lead in developed and underdeveloped/developing countries: a systematic review and a meta-analysis. Environ Pollut. 292(Pt A):118316. doi: 10.1016/j.envpol.2021.118316.
- GEMS/Food-EURO 1995. Second workshop on reliable evaluation of low-level contamination of food. EUR/ICP/EHAZ.94.12/WS04. https://www.google.com/url?sa=t&rct=j&q=&esrc=s&source=web&cd=&ved=2ahUKEwjfx-6jidiBAxUDGFkFHdWgAigQFnoECBcQAQ&url=http%3A//toolbox.foodcomp.info/References/LOD/GEMS-Food-EURO%2520%2520-%2520%2520Reliable%2520Evaluation%2520of%2520Low-Level%2520Contamination%2520of%2520Food.pdf&usg=AOvVaw2klmWuyw_B_rND4dahheBR&opi=89978449
- Ghorab A, Rodríguez-Flores MS, Nakib R, Escuredo O, Haderbache L, Bekdouche F, Seijo MC. 2021. Sensorial, melissopalynological and physico-chemical characteristics of honey from Babors Kabylia’s region (Algeria). Foods. 10(2):225. doi: 10.3390/foods10020225.
- Habib HM, Al Meqbali FT, Kamal H, Souka UD, Ibrahim WH. 2014. Physicochemical and biochemical properties of honeys from arid regions. Food Chem. 153:35–43. doi: 10.1016/j.foodchem.2013.12.048.
- Haderbache L, Mouna B, Arezki M. 2013. Ziziphus Lotus and Euphorbia bupleuroides Algerian honeys. World Appl Sci J. 24(11):1536–1543. doi: 10.5829/idosi.wasj.2013.24.11.7525.
- Hamad GH, Hafez EE, Abdelmotilib NM, Abdel-Hmeed KM, Ali SH, Darwish AMG. 2020. Quality assessment, functional potentials, and safety evaluation of stored Egyptian honey as an environmental pollution bioindicator. Environ Toxicol Chem. 39(10):1894–1907. doi: 10.1002/etc.4811.
- Harrer M, Cuijpers P, Furukawa T, Ebert DD. 2019. dmetar: Companion R package for the guide 'Doing meta-analysis in R'. R package version 0.1.0. URL http://dmetar.protectlab.org/.
- Harrer M, Cuijpers P, Furukawa T, Ebert DD. 2021. Doing meta-analysis with R: a hands-on guide. Boca Raton (FL); London: Chapman & Hall/CRC Press.
- Hassan A, Ghandour MAA, Ali AMM, Mahran HA. 2010. Evaluation of lead, cadmium and copper concentrations in bee honey and edible molasses. Am J Appl Sci. 7(3):315–322. doi: 10.3844/ajassp.2010.315.322.
- Hassan ASM, Abd El Rahman TA, Eissa AA. 2015. Evaluation and comparison of some trace elements in bee honey from eleven countries. Egypt Sci J Pest. 1(2):39–44.
- Hussein MH. 2000. A review of beekeeping in Arab countries. Bee World. 81(2):56–71. doi: 10.1080/0005772X.2000.11099473.
- Imtara H, Elamine Y, Lyoussi B. 2018. Physicochemical characterization and antioxidant activity of Palestinian honey samples. Food Sci Nutr. 6(8):2056–2065. doi: 10.1002/fsn3.754.
- [JECFA] Joint FAO/WHO Expert Committee on Food Additives. 2011. Safety evaluation of certain food additives and contaminants. WHO Food Additives Series. 64:381–497. https://www.who.int/publications/i/item/9789241660648.
- Karabagias IK, Louppis AP, Karabournioti S, Kontakos S, Papastephanou C, Kontominas MG. 2017. Characterization and classification of commercial thyme honeys produced in specific Mediterranean countries according to geographical origin, using physicochemical parameter values and mineral content in combination with chemometrics. Eur Food Res Technol. 243(5):889–900. doi: 10.1007/s00217-016-2803-0.
- Karabagias IK, Louppis AP, Kontakos S, Drouza C, Papastephanou C. 2018. Characterization and botanical differentiation of monofloral and multifloral honeys produced in Cyprus, Greece, and Egypt using physicochemical parameter analysis and mineral content in conjunction with supervised statistical techniques. J Anal Methods Chem. 2018:e7698251. doi: 10.1155/2018/7698251.
- Khalifa MH, Aly GF, Abdelhameed KMA. 2020. Heavy metal accumulation and the possible correlation with acetylcholinesterase levels in honey bees from polluted areas of Alexandria, Egypt. Afr Entomol. 28(2):385–393. doi: 10.4001/003.028.0385.
- Khuder A, Ahmad M, Hasan R, Saour G. 2010. Improvement of X-ray fluorescence sensitivity by dry ashing method for elemental analysis of bee honey. Microchem J. 95(2):152–157. doi: 10.1016/j.microc.2009.11.001.
- Kim J, Lee Y, Yang M. 2014. Environmental exposure to lead (Pb) and variations in its susceptibility. J Environ Sci Health C Environ Carcinog Ecotoxicol Rev. 32(2):159–185. doi: 10.1080/10590501.2014.907461.
- Lambert O, Piroux M, Puyo S, Thorin C, Larhantec M, Delbac F, Pouliquen H. 2012. Bees, honey and pollen as sentinels for lead environmental contamination. Environ Pollut. 170:254–259. doi: 10.1016/j.envpol.2012.07.012.22842054.
- Laredj H, Waffa R, Sara M. 2017. Physico-chemical analysis and determining of toxic elements in honey produced in the region of Tiaret. Adv Environ Biol. 11(5):110–115.
- Lee J-W, Choi H, Hwang U-K, Kang J-C, Kang YJ, Kim KI, Kim J-H. 2019. Toxic effects of lead exposure on bioaccumulation, oxidative stress, neurotoxicity, and immune responses in fish: a review. Environ Toxicol Pharmacol. 68:101–108. doi: 10.1016/j.etap.2019.03.010.
- Loutfy N, Mentler A, Shoeab M, Ahmed MT, Füerhacker M. 2012. Analysis and exposure assessment of some heavy metals in foodstuffs from Ismailia city, Egypt. Toxicol Environ Chem. 94(1):78–90. doi: 10.1080/02772248.2011.638445.
- Malavolti M, Fairweather-Tait SJ, Malagoli C, Vescovi L, Vinceti M, Filippini T. 2020. Lead exposure in an Italian population: food content, dietary intake and risk assessment. Food Res Int. 137:109370. doi: 10.1016/j.foodres.2020.109370.
- Malhat F, Kasiotis KM, Hassanin AS, Shokr SA. 2019. An MIP-AES study of heavy metals in Egyptian honey: toxicity assessment and potential health hazards to consumers. J Elem. 24(2/2019):473–488. doi: 10.5601/jelem.2018.23.4.1685.
- Massous A, Ouchbani T, Lo Turco V, Litrenta F, Nava V, Albergamo A, Potortì AG, Di Bella G. 2023. Monitoring Moroccan honeys: physicochemical properties and contamination pattern. Foods. 12(5):969. doi: 10.3390/foods12050969.
- Mehdi R, Zrira S, Vadalà R, Nava V, Condurso C, Cicero N, Costa R. 2023. A preliminary investigation of special types of honey marketed in Morocco. JETA. 1(1):1–20. doi: 10.3390/jeta1010001.
- Mehdi Y, Mutlaq A, Al-Balas Q, Azzi E, Bouadjela L, Taïbi N, Dakiche H, Touati L, Boudriche L, Bachari K. 2018. Physicochemical characterization and determination of chloramphenicol residues and heavy metals in Algerian honeys. Environ Sci Pollut Res Int. 25(33):33322–33333. doi: 10.1007/s11356-018-3241-2.
- Mohammed F, Abdulwali N, Guillaume D, Bchitou R. 2018. Element content of Yemeni honeys as a long-time marker to ascertain honey botanical origin and quality. LWT. 88:43–46. doi: 10.1016/j.lwt.2017.09.040.
- Moujanni A, Partida L, Essamadi AK, Hernanz D, Heredia FJ, Terrab A. 2018. Physicochemical characterization of unique unifloral honey: Euphorbia resinifera. CYTA J Food. 16(1):27–35. doi: 10.1080/19476337.2017.1333529.
- Moujanni A, Terrab A, Eddoha R, Nasser B, Benbachir M, Tannaoui M, Zouaoui A, Essamadi AK. 2017. Quantification of heavy metals and pesticides residues in labeled Moroccan Euphorbia resinifera honey from Tadla-Azilal. J Mat Environ Sci. 8(5):1826–1836.
- Nageh N, Salman AM, Abu-Zaid AK. 2020. The bee honey as an indicator to environmental pollutions by heavy metals in south Egypt. J Sohag Agrisci. 5(1):80–95. doi: 10.21608/jsasj.2020.229246.
- Obeng-Gyasi E. 2019. Sources of lead exposure in various countries. Rev Environ Health. 34(1):25–34. doi: 10.1515/reveh-2018-0037.
- Omran NS, Omar MOM, Hussein MH, Mm A-A. 2019. Heavy metals concentrations in bee products collected from contaminated and non-contaminated areas from upper Egypt governorates. Int J Res Stud Biosci. 7(2):24–31. doi: 10.20431/2349-0365.0702002.
- Osman KA, Al-Doghairi MA, Al-Otaibi ND. 2021. Spatial distribution of environmental pollutants in natural honeys collected from some regions of Saudi Arabia. J Apic Res. 60(1):188–197. doi: 10.1080/00218839.2020.1727658.
- Osman KA, Al-Doghairi MA, Al-Rehiayani S, Helal MID. 2007. Mineral contents and physicochemical properties of natural honey produced in Al-Qassim region, Saudi Arabia. J Food Agric Environ. 5:142–146. doi: 10.4197/met.18-2.1.
- Othman ZAA. 2010. Lead contamination in selected foods from Riyadh city market and estimation of the daily intake. Molecules. 15(10):7482–7497. doi: 10.3390/molecules15107482.
- Ragab MAA, El-Yazbi AF, El-Hawiet A. 2020. Fast economic electrochemical assay for vitamins and heavy mineral components in honey samples of different botanical origin. Microchem J. 155:104770. doi: 10.1016/j.microc.2020.104770.
- Rahmani J, Alipour S, Miri A, Fakhri Y, Riahi S-M, Keramati H, Moradi M, Amanidaz N, Pouya RH, Bahmani Z, et al. 2018. The prevalence of aflatoxin M1 in milk of Middle East region: a systematic review, meta-analysis and probabilistic health risk assessment. Food Chem Toxicol. 118:653–666. doi: 10.1016/j.fct.2018.06.016.
- Rashed MN, El-Haty MTA, Mohamed SM. 2009. Bee honey as environmental indicator for pollution with heavy metals. Toxicol Environ Chem. 91(3):389–403. doi: 10.1080/02772240802294870.
- RStudio Team 2020. RStudio: Integrated development for R. RStudio, PBC, Boston, MA. http://www.rstudio.com/
- Ru Q-M, Feng Q, He J-Z. 2013. Risk assessment of heavy metals in honey consumed in Zhejiang province, southeastern China. Food Chem Toxicol. 53:256–262. doi: 10.1016/j.fct.2012.12.015.
- Sahinler N, Gül A, Akyol E, Öksuz A. 2009. Heavy metals, trace elements and biochemical composition of different honey produce in Turkey. Asian J Chem. 21(3):1887–1896.
- Salama AS, Etorki AM, Awad MH. 2019. Determination of physicochemical properties and toxic heavy metals levels in honey samples from west of Libya. JACS. 5(1):618–620. doi: 10.30799/jacs.207.19050104.
- Šedík P, Pocol CB, Horská E, Fiore M. 2019. Honey: food or medicine? A comparative study between Slovakia and Romania. BFJ. 121(6):1281–1297. doi: 10.1108/BFJ-12-2018-0813.
- Sherif ASF, Ramadan H, Mohanned Taksira D, Gomaa MBM. 2019. Estimated of heavy metals pollution by honey bee as bio-indicator. Egypt J Plant Prot Res Inst. 2(4):770–779.
- Skalny AV, Aschner M, Bobrovnitsky IP, Chen P, Tsatsakis A, Paoliello MMB, Buha Djordevic A, Tinkov AA. 2021. Environmental and health hazards of military metal pollution. Environ Res. 201:111568. doi: 10.1016/j.envres.2021.111568.
- Smith KE, Weis D, Scott SR, Berg CJ, Segal Y, Claeys P. 2021. Regional and global perspectives of honey as a record of lead in the environment. Environ Res. 195:110800. doi: 10.1016/j.envres.2021.110800.
- Sy MM, Feinberg M, Verger P, Barré T, Clémençon S, Crépet A. 2013. New approach for the assessment of cluster diets. Food Chem Toxicol. 52:180–187. doi: 10.1016/j.fct.2012.11.005.
- Tahboub YR, Al-Ghzawi AA-MA, Al-Zayafdneh SS, AlGhotani MS. 2022. Levels of trace elements and rare earth elements in honey from Jordan. Environ Sci Pollut Res Int. 29(8):11469–11480. doi: 10.1007/s11356-021-16460-3.
- Tomczyk M, Zaguła G, Kaczmarski M, Puchalski C, Dżugan M. 2023. The negligible effect of toxic metal accumulation in the flowers of melliferous plants on the mineral composition of monofloral honeys. Agric. 13(2):273. doi: 10.3390/agriculture13020273.
- [WHO] World Health Organization. 2003. GEMS/Food regional diets - regional per capita consumption of raw and semi-processed agricultural commodities. Geneva, Switzerland: Food Safety Department, WHO Health Organization.
- [WHO] World Health Organization. 2017. Guidelines for drinking-water quality, 4th edition, incorporating the 1st addendum. Geneva, Switzerland: Food Safety Department, WHO Health Organization.
- [WHO] World Health Organization. 2023. Preventing disease through healthy environments - Exposure to lead: a major public health concern. 2nd ed. Geneva, Switzerland: Food Safety Department, WHO Health Organization.
- Yaiche Achour H, Khali M. 2014. Composition physicochimique des miels algériens. Détermination des éléments traces et des éléments potentiellement toxiques. Afr Sci Rev Int Sci Technol. 10(2):127–136. doi: 10.4314/afsci.v10i2.
- Zergui A, Boudalia S, Joseph ML. 2023. Heavy metals in honey and poultry eggs as indicators of environmental pollution and potential risks to human health. J Food Compos Anal. 119:105255. doi: 10.1016/j.jfca.2023.105255.