
 ?Mathematical formulae have been encoded as MathML and are displayed in this HTML version using MathJax in order to improve their display. Uncheck the box to turn MathJax off. This feature requires Javascript. Click on a formula to zoom.
ABSTRACT
The key objectives of this research study are to construct a valid and reliable household-based Human Development Index (HDI) and to estimate human development disparities in 36 districts of Punjab (Pakistan) by analysing Multiple Indicator Cluster Survey microdata. The household-level HDI, a composite index, is constructed by applying the arithmetic mean of the household-level health, asset, and education indices. The district of Lahore, among all the 36 districts of Punjab, has the highest HDI score of 0.743, followed by districts Rawalpindi, Jhelum, and Gujrat. Four neighbouring districts from South Punjab: Rajanpur, Dera Ghazi Khan, Muzzaffar Gar, and Rahim Yaar Khan, have the lowest HDI scores of 0.492, 0508, 0.531, and 0.566, respectively. This paper has used the Palma-ratio and Gini-coefficient to estimate human development disparities in Punjab. The highest human development disparities are observed in the Rajanpur district with a Gini-coefficient of 0.38 and a Palma Ratio of 1.55. Both the Gini and Palma Ratio methods produce similar district rank orderings of inequality. This research recommends that additional efforts be made to uplift the districts with the lowest human development in Southern Punjab through local government restructuring and devolution of relevant powers, including the formation of a separate province.
Introduction
Reducing inequality in Pakistan is important to combat violence, hunger, and extreme poverty. Education, health, and income disparities are at the heart of the post-2015 sustainable development agenda. Using the Sustainable Development Goals (SDGs), the international community has committed to “leaving no one behind”. Explicitly, Goal 10 is devoted to reducing inequalities within and among countries.
Disparities are an old research topic. Rousseau’s dissertation on the background of disparities (Lovejoy Citation1923), Marx’s (Citation1867) review of capitalism, George’s (Citation1879) discussion of “rents”, Naoroji’s (Citation1901) investigations into colonialism and wealth drain, Weber’s (Citation1922) investigation of status, class, and party, Pareto’s (Citation1892) theory of elites and Keynes’s (Citation1937) general theory of employment, are prime examples. The foremost new theories of disparity, such as those sketched in Deaton’s (Citation2013) The Great Escape and the work of Piketty and colleagues (2013), have revived discussions about the causes and persistence of inequalities. Economic disparity has received considerable consideration by researchers, but less attention has been paid to other forms of disparities, such as health, education, and environmental and human development inequalities.
Pakistan’s human development achievement is lower than the average achievements of South-Asian countries, and it is close to the bottom rank for medium-level human development (second last country in the list of medium-level rank ordering) (UNDP Citation2018). The average HDI score of South-Asian countries is 0.638, whereas Pakistan is ranked 150 out of 189 countries with an HDI score of 0.562 (Asghar, Naveed, and Saleem Citation2017; Naveed et al. Citation2022). Punjab’s performance is better than other provinces of Pakistan (Government of Pakistan, Ministry of Finance Citation2017). Among the four provinces of Pakistan, the Punjab is considered an example of good governance (Naveed and Khan Citation2018, 1). However, financial and administrative powers have not been effectively devolved from the federal to provincial and district governments despite the passing of the 18th amendment to the Constitution in 2010, which, in theory, granted self-governing, legislative, and financial autonomy to the provinces. The control and allocation of resources remain highly centralised within either federal or provincial capitals. Resources have not been allocated to districts according to their need.
Punjab consists of nine divisions and 36 districts. There is substantial variance between urban and rural poverty in the Punjab-Pakistan. About 8% of the urban and 40% of the rural population live below Punjab's poverty line (Sajjad et al. Citation2022; Zulfiqar Citation2022). Most districts in southern Punjab fall into the poorest quintile of districts in PakistanFootnote1 (UNDP Citation2003). Punjab’s poorest districts host the largest, most deprived population in Pakistan. For example, 11 of the most deprived districts of Punjab are home to one-quarter of the poorest population of Pakistan. This high deprivation remains concentrated in the southern part of Punjab, while the rest of the districts in the north and centre have experienced continued develo (Naveed and Khan Citation2018).
The main objective of this research study is to draw on measurement theory and the reflective measurement model to produce a valid and reliable household-based Human Development Index in 36 districts of the Province of Punjab (Pakistan) using Multiple Indicators Cluster Survey (MICS) micro-data. The HDI is composed of household-based asset, education, and health indices. This research adopted a modified version of the analytical framework approved by the European Union for the construction of deprivation indices (Guio, Gordon, and Marlier Citation2012), and followed a step-by-step procedure for estimating household-based valid and reliable asset index provided by Naveed et al. (Citation2021). Further, this research has adopted a revised version of the analytical framework ratified by the United Nations Development Program (UNDP) for annual global HDI estimates and employed by Naveed, Gordon, and Ullah (Citation2018) for estimating household-based education index. This study used the World Health Organisation (WHO) (Citation2017) and Office for National Statistics (ONS) (Citation2018) frameworks for estimating a valid health index (Naveed Citation2020). The Human Development disparities are estimated using the Gini-coefficient and Palma ratio.
Gross Domestic Product (GDP) has long been used to gauge a country's economic performance. The Bretton Woods Conference reinforced the import of GDP as a measure of welfare (Costanza et al. Citation2009). GDP has long been criticised for its excessive emphasis on the economic aspect of life rather than the quality of social or environmental well-being (Costanza et al. Citation2007). In 1990,Footnote2 the United Nations Development Program (UNDP) launched an aggregated index that simultaneously captures social and economic aspects of well-being.
The inaugural HDR report defined human development as “the process of enlarging people’s choices and enhancing their capabilities” (Bhanojirao Citation1991, 1452). The process involves the creation of a facilitating environment in which people can develop their full potential, as per their interests, needs, and values (Gasper, Portocarrero, and Clair Citation2013). This aggregated index gauges the average attainment of a nation in three basic dimensions of human development – living standards, education, and health status (UNDP Citation2016). Since its introduction, HDI has become one of the most extensively used indicators for country-level welfare comparisons.
However, the HDI measure has been criticised for various shortcomings. For example, it ignores some important dimensions (Anand and Sen Citation1994; Gaye and Jha Citation2010; Hopkins Citation1991; Mishra Citation2008; Ranis, Stewart, and Samman Citation2006) and its perfect substitution of sub-dimensions (Gaye and Jha Citation2010; Kelley and review Citation1991; Ravallion Citation1997; Srinivasan Citation1994) and the index’s failure to consider variation in human development across differen social, economic and geographical groups within the country (Grimm et al. Citation2008; Harttgen and Klasen Citation2009, Citation2012; Sagar and Najam Citation1998).Footnote3
Nevertheless, since 1992, more than 800 regional and national human development reports have been published (De Neve, Harttgen, and Verguet Citation2020; Yumashev et al. Citation2020). Various regional and national human development reports have built upon the original human development measures by introducing new indices and/or incorporating additional variables and dimensions into the existing indices. In 2010, the United Nations Development Report Office (UNDRO) replaced literacy and gross enrolment with the mean years of schooling and the expected years of schooling in the HDI (UNDP Citation2010). The “mean years of schooling” is a better indicator to capture educational attainment because it takes into account a higher level of educational achievements. To avoid perfect substitutability among education, health, and income indices, UNDRO introduced a geometric mean instead of an arithmetic mean because a geometric mean does not permit perfect substitutability. Rather, it penalises those nations across the components with unequal achievements (Harttgen and Klasen Citation2012).
The most severe criticism of HDI is its inability to incorporate the distribution of human development within the country. Although numerous attempt have been made to capture inequality in HDI at an aggregate level or separate inequality indices have been introduced, few attempts have been made to measure HDI for sub-groups of the population. Gini-corrected HDI is suggested by Anand and Sen (Citation2000). In this approach, each dimension of HDI is discounted by one minus Gini-coefficient before taking the arithmetic mean of all dimensions (Hicks Citation1997). Alkire and Foster (Citation2010) have also suggested methods for calculating inequality-adjusted HDIs.
The Government of Pakistan wants to improve the human development of the population. Given the limited resources available, ensuring that financial resources are targeted effectively and efficiently toward those with the greatest needs is crucial. Macro measurement of HDI at national or provincial levels does not identify the characteristics of households with the lowest human development nor where these households live. Measuring human development at the household level, using valid and reliable methods, will provide policymakers with the high-quality information they need to develop more effective development policies targeted at households with the greatest needs.
This paper also makes important contributions to improving the methodology of HDI measurement: (1) it adopts a formal framework for assessing the validity (i.e. the amount of systematic error) and the reliability (i.e. the amount of random error) of the household-based HDI. The construction of the index requires the selection of suitable items and the assignment of appropriate weights to each item. This research has used a range of methods to identify the optimum sub-set of available variables to produce a household-level HDI measure with a low amount of measurement error. (2) The results show the human development disparities in 36 districts using both the Gini coefficient (which gives weight to the middle of the distribution) and the Palma Ratio (which gives weight to the top and bottom of the distribution). It shows that both, these important inequality measures produce effectively identical results when applied to a valid and reliable household HDI measure for the Districts of Punjab.
The paper's structure is as follows: Section 2 presents a methodological review of the construction of HDI at the household level. Section 3 defines data sources and methodology for constructing indices and methods for estimating human development disparities. Section 4 discusses the results, and Section 5 concludes the paper.
Literature Review
Measurement of Human Development Index: A Methodological Review
A wide range of literature on HDI measurement has been developed during the previous three decades. This section briefly discusses the literature about proposed methodological modifications in HDI measurement.
The UNDP released its first HDI in 1990 by reopening the dialogue on the measurement of development. Numerous national and regional human development reports have been published since the index's inception. The primary role of this series of reports is to shape the concept of human development in a more purified form through intellectual discourse and empirical investigations (Sagar and Najam 1997). One of the critical reasons for the high acceptability of HDI is researchers’ and policymakers’ increasing interest in multi-dimensional well-being measures (Berenger and Chouchane 2007). Immediately after launching the first report, an energetic debate on improving human development measurement demonstrated researchers’ interest and concern (e.g. CitationHopkins1991; McGillivray 1991; Desai 1991; Annand and Sen 1992; Lind 1992). The HDI was criticised for its limitations, e.g. firstly, it ignores some essential dimensions of human development like political freedom, degree of people’s self-respect, and environmental sustainability. Secondly, the HDI's additive structure (substitutability of health, education, and income) is problematic. Thirdly, the choice of goalposts (minimum and maximum values for each dimensional index) is questionable. Fourthly, the theoretical justification for the HDI measurement formula is weak. Fifthly, it fails to gauge variation in human development across the country's different social, economic, and geographic groups (Nayak 2013). However, the UNDP positively participated in debates and encouraged criticism to refine the concept of human development, which is why many of the apposite critiques were incorporated in subsequent HDI reports.
The question remains: How do we incorporate distributional inequalities of all three dimensions of human development into its measurement framework? Hicks (Citation1997) estimated Gini for all three indices and constructed an inequality-adjusted human development index (IAHDI). However, the IAHDI faced criticism about the reliability of inequality indicators and the validity of the final index (Nayak 2013). Sagar and Najam (Citation1998) have criticised HDI for its additive structure and suggested the multiplication of sub-indices to treat the substitution of components by controlling the trade-off between them. Noorbakhsh (1998) has proposed modifications in measuring income in the index, holding that income beyond the poverty line has no impact on HDI. He introduced Atkinson’s utility welfare formulation and divided (above poverty line) income into selected intervals and assumed different values for the parameter of deviation (epsilon). He introduced a modified HDI formula. Palazzi and Lauri (1998) critically viewed HDI for substitutability and equal weighting for all three sub-indices. They introduced the concept of balanced and sustainable human development in which all three dimensions are obligatory and mutually self-reinforcing. They presented this proposed approach graphically, classifying the countries into balanced and sustainable, unbalanced and unsustainable groups. They suggested penalties for unbalanced and unsustainable countries instead of perfect substitutability and equal weighting. Mahlberg and Obersteirner (2001) indicated that weights for each component of HDI should be derived from the data directly. Panigrahi and Sivramkrishna (Citation2002) showed that any change in the goalposts of the dimensions not only changed the value of the HDI but also changed the ranking of different countries, so they suggested an adjusted HDI. Baliamoune-Lutz (Citation2004) suggested using the fuzzy-set theory following Sen’s capability approach to measuring HDI. Instead of three dimensions, their research used seven indicators for HDI measurement and proposed a different ranking of countries than the UNDP’s HDI ranking. Ray (Citation2008) introduced the social development index (SDI) by incorporating physical indicators of the states. Grimm et al. (Citation2008) shed light on the distributional aspect of HDI within countries. They generated a separate HDI for various sections of the income distribution.
Human Development Index Measurement at the Household Level
Permanyer (Citation2013) used three rounds of Mexican Census data to calculate an HDI at the municipality level and developed a methodology that allowed the decomposition of overall human development inequality according to the contribution of its subcomponents. The study showed that, over time, municipal-based HDI improved, and disparities between municipalities decreased.
Harttgen and Klasen (2010) have highlighted that the HDI does not consider human development distribution within sub-groups. They used Demographic and Health Survey (DHS) data from 15 developing countries to calculate an HDI at the household level. High inequality in HDI achievement was found in poorer countries, driven mainly by very high inequality in the education and income components of the HDI. High inequalities were found in different subgroups of the population, with varying groups of income, education levels, and locations.
Emphasising methodological issues, Harttgen and Klasen (Citation2009) applied a systematic framework for the calculation of the HDI for internal migrants and non-migrants separately across the countries and localities. Their analysis included 16 developing countries and showed that migrants have a slightly higher level of HDI compared with non-migrants, mainly driven by income differences rather than the non-income components of HDI. Disaggregated analysis by locality found that urban migrants achieved more human development than urban non-migrants, and rural migrants had higher HDI scores than rural non-migrants.
Grimm and colleagues (2008) introduced a methodology to compute HDI for quintile groups of the income distribution. This allows comparisons of the human development of poor and non-poor within a country and between countries. They found that inequality in income is generally higher than disparities in health and education.
Lopez-Calva and Ortiz-Juarez (Citation2012) used survey and Census data to calculate a household-based distribution-sensitive human development index (HB-IAHDI) for Mexico, Nicaragua, and Peru. The income and education sub-indices were calculated from the survey data, and the health index was based on the child survival rate of the municipality in which the households resided – so this was, in effect, a quasi-household level HDI measure. They found that the losses in human development due to inequality reached 22%, 29%, and 57% in Mexico, Peru and Nicaragua, respectively. However, these results are sensitive to the indicators used in their method.
Overall, the literature suggests that, from its inception, the HDI has faced severe criticism due to its limitations. The UNDP has responded by incorporating some of the recommendations from research studies into their HDI measure, e.g. applying geometric mean instead of arithmetic mean and using Expected Years of Schooling (EYS) and Mean Years of Schooling (MYS) instead of literacy and gross enrolment rates. So, what is the best way to incorporate distributional inequalities of all three dimensions of human development into its measurement framework? The literature on measuring human development disparities at the district level within a country is scant. There is not a single study that has measured HDI at the household level in Pakistan. The contribution of this research to the existing literature is the estimation of the HDI at the household level for Punjab Province (Pakistan). It also makes a methodological contribution by constructing valid and reliable sub-indices of HDI at the household level. Further, this research calculates human development disparities at the household level in Punjab-Pakistan.
Materials and Methods
Data Source and Sampling
This research paper has used the Punjab (Pakistan) MICS Round 5 survey microdata collected by the Pakistan Bureau of Statistics (PBS) in collaboration with UNICEF.Footnote4 The MICS survey collected data from a representative sample of the population in nine divisions (administrative units) and 36 districts of Punjab, Pakistan. The achieved sampleFootnote5 size was 38,405 households with a 98% response rate.
The Construction of Household-Based Sub-Indices of HDI
Asset Index
Asset ownership can be considered to be a measure of permanent income (Freidman 1957), as assets often accumulate over a period of time and reflect a multidimensional aspect of household living standards (Howe et al. 2008). A modified version of the analytical framework, which the European Union approved for the measurement of deprivation indices, has been adopted by this research for the construction of an asset index at the household level (Guio, Gordon, and Marlier Citation2012; Guio et al. Citation2016; Guio et al. Citation2017; Guio et al. Citation2018).
The asset index has been used as a proxy variable for an income index. Naveed et al. (Citation2021) provide step-by-step details for the construction of an asset index at the household level. To elucidate the dimensional structure of the assets, this study has applied EFA (Exploratory-Factor-Analysis) and Tet-PCA (Tetrachoric Principal-Component-Analysis). The CTT (Classical-Test-Theory) and IRT (Item-Response-Theory) models are used to select the optimum sub-set of assets, which minimised the systematic (i.e. validity) and random (i.e. reliability) measurement error of the asset index.
A household income index was calculated as a validator for the asset index. The income of every individual household member (above ten years of age with declared earnings) is recorded in the Punjab MICS survey data. Total household income is calculated by summation of the regular income and additional income of each household member. Equivalised income is computed using the OECD square root equivalisation scale approach to allow for household economies of scale (OECD 2008, 2011). The equivalised household income (income adjusted for household size) is used as a construct validity measure based upon the a priori assumption that higher asset possession should be correlated with higher equivalised household income.
The reliability analysis suggests that, out of 30 assets, only 22 items can be summed to form a highly reliable scale. The assets included in the asset index were a TV, iron, motorcycle, pump, mobile phone, and landline phone. watch fan, electricity, gas, bank account, refrigerator, washing machine, sewing machine, air conditioner, car, computer, water filter, cooking range, finished flooring, walls, and roofing of the dwelling. The eight items excluded from the asset index were boat, bus, land, farm animals, animal-drawn cart, tractor, radio, and bicycle—including any of these eight items increased the amount of random error of the asset index.
All suitable assets have equal weights in the asset index. The formal equation for the asset index is as follows:
(1)
(1) Here, Ai refers to the household-specific asset index, and ŷ refers to particular weights for each asset owned by the household where
refers to the respective asset of ith household recorded as a dichotomous variable in Punjab MICS05 data sets.
In the second step, the household-specific asset index is normalised by using the following formula:
(2)
(2) where
is the normalised asset index, and
is the household-specific asset index under study.
Education Index
Since 2010, UNDP has used two indicators to estimate the education index: (1) mean years of schooling (MYS) for adults aged 25 years and above and (2) expected years of schooling (EYS) for children of school age. We followed the method of Naveed and colleagues (2019) to compute an aggregated education index composed of four indicators; EYS (expected years of schooling below 25 years of age), MYS (mean years of schooling for 25 and above), reading-ability, and writing-ability (the last two indicators incorporate indicators of education quality into the aggregated index).
Years of education (attainment) are meaningless if people cannot read or write, so the quality of education is imperative for measuring the education index. The OECDFootnote6 countries measure education quality using the PISAFootnote7 survey. However, similar data on education quality is not available for most developing countries. However, in the MICS survey in Punjab, enumerators asked male and female respondents to read some simple sentences on a show card (question WB7). Similarly, questions HL10A and HL10C were asked of all members aged 10 years and above to record additional information about their ability to read and write. The indicators reading-ability and writing-ability are normalisedFootnote8 by using a minimum value of 0 and a maximum value of 100.
The household-based education index is computed using Equation 3. Where is household-specific education index,
is the household-specific adult mean years of schooling,
is expected years of schooling,
is reading ability and
is writing ability.
(3)
(3) where
(4)
(4) and
(5)
(5) and
(6)
(6) and
(7)
(7)
Health Index
This research used a comprehensive health index that took child health and adult health into consideration (Naveed Citation2020). For children’s health at the household level, two indicators were used: (a) immunisation rate (fully vaccinated children under three years of age) and (b) Composite Index Anthropometric Failure (CIAF) (Nandy and colleagues Citation2005). For adults, the prevalence of cough, tuberculosis, and hepatitis were used. For detailed methodological discussion on the construction of the asset, education, and health indices and step-by-step application of the methodology, see Naveed and colleagues (2019) and Naveed (Citation2020).
This research has adopted a modified version of the theoretical framework recommended by the World Health Organisation (2015) and the UK Office for National Statistics (Citation2018) for the construction of health indices. A comprehensive health index needs to cover fundamental domains concerning the measurement of health status, e.g. physiological risk factors, protective measures, and physical health conditions (Sørensen et al. 2013; WHO 2017). The Composite Index of Anthropometric Failure (CIAF) is a single-value index of undernutrition that aggregates information from all three dimensions of undernutrition (stunting, wasting, and underweight). Svedberg introduced the CIAF in 2002, and Nandy and his colleagues improved it in 2005. The CIAF is used to gauge physiological risk factors. The percentage of children who have received their recommended vaccinations is used as an indicator of preventative measures (Al-lela et al. 2014). Communicable diseases, e.g. TB, hepatitis, and cough, are used to cover physical health conditions. The following sub-indices are calculated for the construction of the final health index at the household level.
Immunization Rate
The immunisation rate measures the percentage of children in each household who have received all vaccines prescribed by EPI for specific ages and duration (fully immunised).
(8)
(8)
Anthropometric Achievement Index
It measures the proportion of children under five with no anthropometric failure.
(9)
(9)
Index for Communicable Diseases
It measures the proportionate of family members (of all ages) with no prevalence of infectious diseases (like cough, TB, and hepatitis)
(10)
(10)
Health Index
The health index measures the proportion of households with health achievements in child immunisation, anthropometric failure avoidance, and success in combating infectious diseases. A High value on the health index indicates a household with healthy members.
(11)
(11)
Construction of Household-based Human Development Index (UNDP Approach)
The HDI is based on three components: health index (Hi), education index (Ei), and asset index (Yi). The HDI was calculated using the arithmetic mean of the three components in the annual human development reports from 1990 to 2009, e.g.
(12)
(12) From 2010 onwards, the HDI has been calculated by using the geometric mean of the health, education and income indices, e.g.
(13)
(13) Both of these approaches have their own merits and demerits. HDI measured using the geometric mean does not permit perfect substitutability of income, health, and education, and it penalises those nations/municipalities/households with unequal achievements across the components (i.e. the geometric mean is based on the product of the three sub-indices, unlike the arithmetic mean which is based on the sum of these three components). Thus, the geometric mean method rewards nations/municipalities/households with balanced achievements across the three components. A geometric mean is better than the arithmetic mean as long as none of the HDI components are zero. If one component is zero, irrespective of the values of the other two, this zero will drag the whole HDI to zero. The probability of a zero value for the education index is high when the unit of analysis is small, particularly at household/municipality level, where there is a probability that adults may have not been to school and their children may not be enrolled in school (Harttgen and Klasen 2011).
The calculation of an additive HDI permits perfect substitutability between its subcomponents. Thus, a decline in one sub-index can be stabilised by a rise in another sub-index. Consequently, a household HDI would be insensitive to the level of balance of achievements across the three components. This research is concerned with calculating HDI at the household level. An additive approach for HDI is more suitable given the likelihood that some households will score zero on some sub-indices.
Methods for Measurement of Human Development Disparities
Social scientists use over a hundred methods for the measurement and analysis of disparities (De Maio Citation2007). The Gini-coefficient index is a widely used method for inequality measurement. The Gini-coefficient ranges between 0 (perfect equality) and 1 (perfect inequality). The simplest and most intuitive interpretation of the Gini Coefficient is:
Suppose we randomly choose two people from the income distribution and express the difference between their incomes as a proportion of the average income. In that case, this difference turns out to be (on average) twice the Gini Coefficient: a coefficient of 0.3 means that the expected difference between two randomly chosen people is 60 percent (2×0.3) of the average income. If the Gini Coefficient is 0.5, then the expected difference would be the average income itself. (Raskall and Matheson Citation1992)
The Palma Ratio is calculated by dividing the HDI share of the top 10% by the bottom 40% of the population. The middle 50% is excluded from the Palma analysis. Empirical studies show that the middle class is highly stable across time and countries, and significant variation is observed in the Palma components, i.e. bottom 40% and top 10% income shares (Cobham and Sumner Citation2013a, Citation2013b).
The Palma ratio is one of the many Kuznets ratios that is used to measure inequality. The Palma Ratio is recognised for its simplicity and intuitiveness, which makes its results easy for the public and policymakers to understand. For example, if the value of the Gini-coefficient is 0.5, that indicates a severe problem of inequality but, for the non-technical audience, its meaning is not intuitive. On the other hand, if the Palma Ratio is 5.0, that can be translated into the intuitive statement that the top 10% (richest 10%) have five times as much as the bottom 40% (poorest 40%). The Gini-coefficient is considered a good measure because it is Lorenz-consistent, which means that it satisfies the four basic axioms of the measurement of inequality: symmetry, replication invariance, scale invariance, and transfer. The Palma Ratio can violate the transfer axiom (whenever there is a transfer within the poorest 40%, the richest 10%, or the 50% in the middle). Thus, although the Palma Ratio is more intuitive, that does not mean it is superior to the Gini measure of inequality.
A reason to apply the Gini-coefficient method to measure human development disparities is its wide acceptance among researchers as a good measure. The Palma Ratio's pragmatic reason is its simplicity and straightforward interpretation. The Palma index has been adopted by the UN to monitor inequality for the Sustainable Development Goals, mainly Goal 10.1, which is: “By 2030, progressively achieve and sustain income growth of the bottom 40 percent of the population at a rate higher than the national average” (Osborn, Cutter and Ullah 2015). Moreover, Palma is widely applied by the UNDP and other United Nations agencies. This research used the Palma Ratio and Gini-coefficient to measure human development disparities in Punjab (Pakistan).
Results and Discussion
Descriptive Analysis
shows descriptive statistics of all three sub-indices of the HDI. The average HDI for Punjab is 0.64, which represents a medium level of human development. Among the sub-indices of the HDI, the worst performance is in education achievements (i.e. the average education index is 0.49) and a moderate level of achievement in the income index (i.e. 0.64 asset index), and a relatively high level of performance in the health index (i.e. 0.83).
Table 1. Descriptive statistics.
District-Level Disaggregated Analysis of Human Development in Punjab
shows a district-level disaggregated analysis of the asset, education, health, and human development indices. In Punjab, districts with high human development levels are Lahore, Rawalpindi, Jhelum, Gujrat, Chakwal, and Sialkot, while the remaining 30 districts have medium and low human development levels. Among the 36 districts of Punjab, Lahore has the highest HDI of 0.743, surpassing Rawalpindi with an HDI of 0.741, followed by Jhelum and Gujrat with an HDI of value 0.737. Overall, in Punjab, four neighbouring districts, Rajanpur, DG Khan, Muzaffar Gar, and RY Khan, are the least developed, with HDI values of 0.492, 0508, 0.531, and 0.566, respectively.
Table 2. District level ranking of human development index (Asset, Education and Health indices).
shows the relationship between the health index and asset index in one curve, and the education index and asset index in another. The relationship between the health index and the asset index is slightly concave in shape, indicating that the marginal rise in health achievements diminishes as wealth accumulation (asset index) rises. This indicates that the initial rise in asset ownership leads to ample advances in health attainments but that the rate of health index advances starts to slow down at greater levels of wealth accumulation. This is because additional wealth has a limit to further improving health outcomes. The theoretical framework of diminishing marginal utility theory supports the concavity of the relationship between health and asset indices. Currie and Stabile (Citation2003) and Case and Deaton (Citation2015) provide empirical support to the concave relationship between health and wealth accumulation. The similar concave pattern is found in the seminal work of Preston (Citation1975), who plotted the relationship between per capita income and life expectancy (known as the “Preston Curve”).
Figure 1. Distribution of Health index and Education Index as a function of Asset index (Punjab). (Author’s Tabulations).
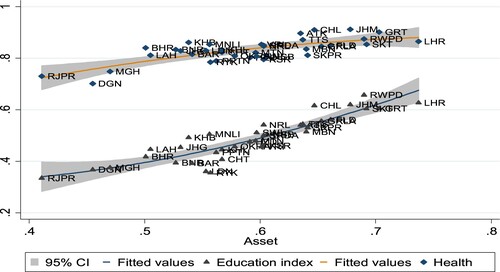
The relationship between the education index and the asset index is convex in shape. The positive association between asset and education indices indicates that wealth accumulation provides households with opportunities and resources to pursue higher-quality education and personal development. The left side of the curve illustrates that at lower levels of asset ownership; the curve is relatively flat, showing slower achievements in the education index. It becomes steeper as the asset index increases. The convexity of the curve indicates that households with greater levels of assets invest in education and on average achieve significant in educational attainment compared with households at lower levels of asset accumulation. The investment model and human capital theory provide the hypothetical framework for the relationship between education and asset indices. The empirical studies e.g. Attanasio and Kaufmann (Citation2009) and Chetty et al. (Citation2014) provide robust support for the convex relationship between the asset and education indices.
Human Development Disparities in Punjab
This section describes the human development disparities among the 36 districts of Punjab-Pakistan using the Gini-coefficient and Palma Ratio.
Gini-Coefficients and Palma Ratio
Division Rawalpindi consists of districts Rawalpindi, Chakwal, and Jhelum. These districts are the closest districts to the capital of the country and are well connected to the centre. Gujranwala division (consisting of the districts Gujranwala, Gujrat, and Sailkot) is recognised as an industrial hub with improved living standards, better employability, and broader education opportunities. By contrast, Bahawalpur and Dera Ghazi Khan are parts of southern Punjab with unsafe drinking water, worse employment opportunities, and substandard educational facilities.
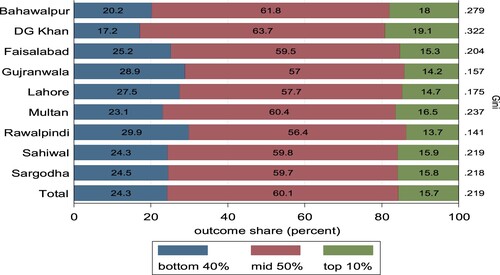
presents the Gini-coefficient and human development share of each Punjab division (the division is an administered unit of a province, and Punjab consists of nine divisions). The highest human development disparities are found in division Dera Ghazi Khan (DG Khan), where the bottom 40%, on average, get 17.2% (lowest among the nine divisions of Punjab) of the total HDI share, and the top 10% receives 19.1% (highest among the nine divisions of Punjab). Here, the value of the Gini-coefficient is 0.322, and the Palma Ratio is 1.11. At the same time, Rawalpindi, Gujranwala, and Lahore divisions are seen with the least unequal human development distribution by scoring 0.14, 0.157, and 0.175 on the Gini, respectively.
Figure 2. Divisions wise Palma components and Gini. (Author’s Tabulations).
shows district-wise Palma components and the Gini-coefficient of human development index. The results show that the middle 50% (Palma middle class) is relatively stable across all districts, e.g. the middle 50% of HDI (5th to 9th decile) share among the 36 districts of Punjab only ranges between 54% and 60%. The human development distribution in the district of Rajanpur is highly unequal, with a Palma index of 0.74 and a Gini index of 0.26. The least human development inequality is in Chakwal district, where the bottom 40% receive 33% (highest in Punjab) of the total HDI share, and the top 10% have 12% of the HDI (lowest in Punjab), with a Palma Ratio of 0.37 and a Gini-coefficient of 0.09.
Table 3. District level Human Development disparities in Punjab: Palma components, Palma ratio and Gini-coefficient.
In conclusion, among the 36 districts of Punjab, Lahore has the highest HDI of 0.743, surpassing Rawalpindi's HDI of 0.741. Jhelum and Gujrat have HDIs of 0.737. The mapping of human development indices across the Punjab districts is presented in . Out of 36 districts, all the high human development districts are located in the north of Punjab Province, e.g. Lahore, Gujranwala, Rawalpindi, and all the lowest human development districts are geographically concentrated in southern divisions of Punjab, e.g. Bahawalpur and DG Khan.
Figure 3. Maps of Asset, Education, Health, and Human Development Indices for districts of Punjab Province.
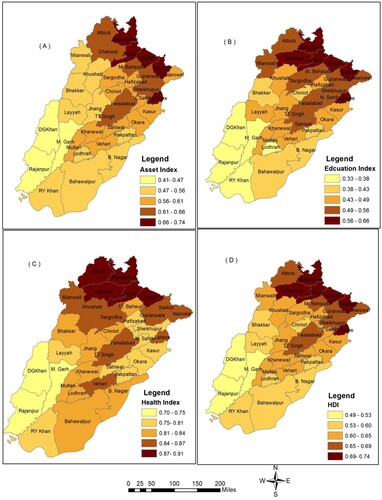
The results show that the districts in the south are of low-HDI. All the districts with lowest HDI are home to the Seraiki culture and the majority of the population speak the Seraiki language. Seraiki is one of the representative languages of the Indus Valley civilisation, and it is spoken by over 25 million people, according to the 2017 Census.Footnote9 The majority of population of south Punjab live in rural areas which are known for cotton production (Ali et al. Citation2022). However, the needs of the Seraiki speaking population have been subsumed by the larger Punjabi-speaking population, and they have less political say at the provincial and national levels (Mughal Citation2020). The results also show the districts of south Punjab have very poor child health Indicators. Every second child is malnourished, and 51% of children are not adequately immunised. High malnourishment and low vaccination rates were recorded in the areas with relatively lower asset index and lower education index. The findings also suggest that Southern Punjab areas are more affected by asset, education, and health disparities than Central or Northern Punjab regions.
Conclusion
This paper attempts to devise a methodological discourse on constructing a valid and reliable household-based human development index for the 36 districts of Punjab province (Pakistan). Considering intrinsically essential dimensions of human development, namely health, asset ownership, and education, the research paper proposes an assessment of the standard of living and human well-being at the household level. Further, this study explicitly investigates the disparities in human development by using the Gini-coefficient and the Palma ratio.
The results show that the Punjab province can be classified as a medium human development province based on the estimated HDI values, keeping the same cut-off points as those used in the 2023 Human Development Report. However, there remain substantial disparity across fundamental dimensions of human development within the Punjab province. Remarkably, the province is categorised as having very high well-being on the health index, which indicates significant achievements in terms of improved nutrition, immunisation, access to healthcare services, and overall health status. The asset index results indicate a medium level of standard of living, signifying inequalities in income distribution, livelihood opportunities and economic well-being. However, the education index suggests a low level of human development, reflecting challenges associated with adults’ educational achievement and access to quality education for children.
District-level disaggregated analysis of human development reveals that Lahore district has the highest HD score of 0.743, showing, on average, that households are enjoying better living standards, higher access to quality education and improved health facilities in comparison with households in other districts. By contrast, the Rajanpur district has the lowest HD score of 0.49, indicating relatively lower performance on all dimensions of human development. This considerable variation in HD scores across the districts highlights inequality in the provision of healthcare facilities, access to educational opportunities, and socioeconomic conditions of households. The district-wise rankings, based on HDI, provide valuable information for policymakers, indicating regions and districts where stakeholders/government interventions may be required to address inequalities and improve specific dimensions of HD.
On all dimensions of the HDI, the districts geographically located in the Southern region of Punjab are the most deprived, while districts of North and Central Punjab are ranked higher on HD. Notably, the majority of people from southern districts practice Seraiki culture and speak Seraiki language, while people from north Punjab practice Punjabi culture and speak Punjabi language. Thie Seraiki Speaking districts are the most deprived of HD and face the highest disparities. Therefore this research recommends serious efforts to uplift the most deprived districts of Southern Punjab possibly by developing a separate administrative set-up in which the Seraiki-speaking people would find opportunities to participate in provincial decision-making, more job opportunities, and infrastructural development.
Further, the conclusions of this research suggest that policymakers should adopt a multidimensional approach by focusing on district-specific factors to reduce inequality in income distribution, education, health facilities, child nutrition, and immunisation. The years of schooling, child nutrition and immunisation determine the quality of future human resources. The failure to achieve high EYS and better child nutrition implies that households may remain trapped in a vicious cycle of poverty (De Schutter et al. Citation2023). This also implies that these districts are facing high early school dropout rates. Therefore, the Province may lag in achieving universal education goals and allied SDGs. The provincial government should set district-level education plans to bring back out-of-school children and improve the quality of education to achieve the SDG targets. Particularly in districts where access to healthcare is still disproportionately concentrated among the wealthy, policy initiatives can focus on expanding the availability of health services and raising public awareness. Multidimensional child poverty measurement-specific data and monitoring and child rights-related legislation should be priority areas for policymakers to uplift human development in all regions of Punjab.
Acknowledgements
We acknowledge the financial support of a Higher Education Commission of Pakistan International Research Support Initiative Programme (IRSIP) grant and a University of Bristol Next Generation visiting fellowship award. We would like to thank the Associate Editor and two anonymous referees for their insightful and knowledgeable comments which have helped us improve this paper. The authors report they have no competing interests to declare.
Disclosure statement
No potential conflict of interest was reported by the author(s).
Additional information
Notes on contributors
Tanveer Ahmed Naveed
Tanveer Ahmed Naveed is a Director of Poverty Research Centre at the University of Gujrat. He has a PhD in Economics and has 15 years of teaching experience. Dr Naveed is a Senior Research Fellow at School of Policy Studies, University of Bristol. He also won the Bristol Next Generation Research Fellow award and Benjamin Meaker Follow-On Fund for his work on child poverty, assets inequalities and human development. His research interests and contributions are the measurement of valid and reliable education, assets, health and human development indices and the development of scientifically rigorous measures for multidimensional poverty and child poverty applicable in low- and middle-income countries.
David Gordon
David Gordon FBA, FRSA, is Professor of Social Justice and the Director of the Bristol Poverty Institute and the Townsend Centre for International Poverty Research at the University of Bristol, UK. He has written and edited over two hundred books, papers and reports on poverty, health inequalities, exclusion, social justice and social policy. In 2018, he had the honour of being elected as a Fellow of the British Academy for his work on poverty research.
Notes
1 The most deprived districts of Punjab are Rajanpur, D.G. Khan and Muzaffargarh with poverty headcount counts of 63%, 56% and 49%, respectively. While the least poor districts include Chakwal, Rawalpindi and Jhelum with poverty headcount of 6%, 6% and 7%, respectively (Naveed et al. 2016).
2 Pakistani economist Mehbub ul Haq and Indian Nobel Laureate Amartya Sen jointly introduced conceptual and methodological measurements of HDI.
3 It should be noted that Srinivasan (Citation1994, 241) argued that the “HDI is conceptually weak and empirically unsound, involving serious problems of noncomparability over time and space, measurement errors, and biases.”
4 Author acknowledges UNICEF for providing access for MICS05 data-sets.
5 For details on sampling, see https://mics-surveys-prod.s3.amazonaws.com/MICS5/South%20Asia/Pakistan%20%28Punjab%29/2014/Final/Pakistan%20%28Punjab%29%202014%20MICS_English.pdf
6 OECD (2016), “Executive summary”, in PISA 2015 Results (Volume I): Excellence and Equity in Education, OECD Publishing, Paris. DOI: https://doi.org/10.1787/9789264266490-2-en
7 The Programme for International Student Assessment (PISA), OECD initiative, is an international survey program which assesses the skills of 15-year-old students. The survey has been implemented to more than 28 million people 15-years old, from 72 countries OECD
8
References
- Ahmad, I., and M. U. Haq. 2021. “Local Governments and Sustainable Urban Development; A Case Study of Punjab.” Journal of Evaluation 13 (2): 234–258.
- Ali, M. A., M. Hassan, M. Mehmood, D. H. Kazmi, F. A. Chishtie, and I. Shahid. 2022. “The Potential Impact of Climate Extremes on Cotton and Wheat Crops in Southern Punjab, Pakistan.” Sustainability 14 (3): 1609. https://doi.org/10.3390/su14031609.
- Alkire, S., and J. E. Foster. 2010. “Designing the Inequality-Adjusted Human Development Index.” OPHI Working Paper No 37. Oxford.
- Anand, S., and A. Sen. 1994. Human Development Index: Methodology and Measurement (No. HDOCPA-1994-02). Human Development Report Office (HDRO), United Nations Development Programme (UNDP).
- Anand, S., and A. Sen. 2000. “The Income Component of the Human Development Index.” Journal of Human Development 1 (1): 83–106. https://doi.org/10.1080/14649880050008782.
- Asghar, N., T. A. Naveed, and S. Saleem. 2017. “Impact of Social, Political and Economic Globalization on Gender Inequality Index in Pakistan: A Time Series Analysis.” Journal of South Asian Studies 32 (2).
- Aslam, A. Q., S. R. Ahmad, I. Ahmad, Y. Hussain, and M. S. Hussain. 2017. “Vulnerability and Impact Assessment of Extreme Climatic Event: A Case Study of Southern Punjab, Pakistan.” Science of the Total Environment 580: 468–481. https://doi.org/10.1016/j.scitotenv.2016.11.155.
- Attanasio, O., and K. Kaufmann. 2009. Educational Choices, Subjective Expectations, and Credit Constraints.
- Baliamoune-Lutz, M. N. 2004. “Does FDI Contribute to Economic Growth? Knowledge About the Effects of FDI Improves Negotiating Positions and Reduces Risk for Firms Investing in Developing Countries.” Business Economics 39 (2): 49–57.
- Bellù, L. G., and P. Liberati. 2006. “Inequality Analysis: The Gini Index.” FAO, EASYPol Module 40.
- Bhanojirao, V. V. 1991. “Human Development Report 1990: Review and Assessment.” World Development 19 (10): 1451–1460. https://doi.org/10.1016/0305-750X(91)90087-X.
- Case, A., and A. Deaton. 2015. “Rising Morbidity and Mortality in Midlife among White Non-Hispanic Americans in the 21st Century.” Proceedings of the National Academy of Sciences 112 (49): 15078–15083. https://doi.org/10.1073/pnas.1518393112.
- Cheema, A., L. Khalid, and M. Patnam. 2008. “The Geography of Poverty: Evidence from the Punjab.” The Lahore Journal of Economics 13 (1): 163–188. https://doi.org/10.35536/lje.2008.v13.isp.a10.
- Chen, S., and M. Ravallion. 2004. “How Have the World's Poorest Fared Since the Early 1980s?” The World Bank Research Observer 19 (2): 141–169. https://doi.org/10.1093/wbro/lkh020.
- Chetty, R., N. Hendren, P. Kline, and E. Saez. 2014. “Where is the Land of Opportunity? The Geography of Intergenerational Mobility in the United States.” The Quarterly Journal of Economics 129 (4): 1553–1623. https://doi.org/10.1093/qje/qju022.
- Cobham, A., and A. Sumner. 2013a. Is it all about the tails? The Palma measure of income inequality. Center for Global Development working paper, (343).
- Cobham, A., and A. Sumner. 2013b. Putting the Gini Back in the Bottle? The Palma as a Policy-Relevant Measure of Inequality. 1–30. London: King's College.
- Costanza, R., B. Fisher, S. Ali, C. Beer, L. Bond, R. Boumans, N. L. Danigelis, et al. 2007. “Quality of Life: An Approach Integrating Opportunities, Human Needs, and Subjective Well-Being.” Ecological Economics 61 (2–3): 267–276. https://doi.org/10.1016/j.ecolecon.2006.02.023.
- Costanza, R., M. Hart, J. Talberth, and S. Posner. 2009. Beyond GDP: The Need for New Measures of Progress. The Pardee Papers. No. 4, Boston.
- Currie, J., and M. Stabile. 2003. “Socioeconomic Status and Child Health: Why is the Relationship Stronger for Older Children?” American Economic Review 93 (5): 1813–1823. https://doi.org/10.1257/000282803322655563.
- Deaton, A. 2013. “The Great Escape.” In The Great Escape. Princeton University Press.
- De Maio, F. G. 2007. “Income Inequality Measures.” Journal of Epidemiology & Community Health 61 (10): 849–852. https://doi.org/10.1136/jech.2006.052969.
- De Neve, J.-W., K. Harttgen, and S. Verguet. 2020. “Nationally and Regionally Representative Analysis of 1.65 Million Children Aged Under 5 Years Using a Child-Based Human Development Index: A Multi-Country Cross-Sectional Study.” PLoS Medicine 17 (3): e1003054. https://doi.org/10.1371/journal.pmed.1003054.
- De Schutter, O., H. Frazer, A. C. Guio, and E. Marlier. 2023. The Escape from Poverty: Breaking the Vicious Cycles Perpetuating Disadvantage. Bristol: Policy Press.
- Friedman, M. 1957. A Theory of the Consumption Function. Princeton: Princeton University Press.
- Gasper, D., A. V. Portocarrero, and A. L. S. Clair. 2013. “The Framing of Climate Change and Development: A Comparative Analysis of the Human Development Report 2007/8 and the World Development Report 2010.” Global Environmental Change 23 (1): 28–39. https://doi.org/10.1016/j.gloenvcha.2012.10.014.
- Gaye, A., and S. Jha. 2010. “A Review of Conceptual and Measurement Innovations in National and Regional Human Development Reports, 1998–2009.” Human Development Research Paper 21.
- George, H. 1879. Progress and Poverty: An Inquiry Into the Cause of Industrial Depressions, and of Increase of Want with Increase of Wealth. The Remedy. New York: D. Appleton and Company.
- Government of Pakistan, Ministry of Finance. 2017. Economic Survey of Pakistan 2017. Ministry of Finance. http://www.finance.gov.pk/survey_1617.html.
- Grimm, M., K. Harttgen, S. Klasen, and M. Misselhorn. 2008. “A Human Development Index by Income Groups.” World Development 36 (12): 2527–2546. https://doi.org/10.1016/j.worlddev.2007.12.001.
- Grimm, M., K. Harttgen, S. Klasen, M. Misselhorn, T. Munzi, and T. Smeeding. 2010. “Inequality in Human Development: An Empirical Assessment of 32 Countries.” Social Indicators Research 97 (2): 191–211. https://doi.org/10.1007/s11205-009-9497-7.
- Guio, A.-C., D. Gordon, H. N. Catalan, and M. Pomati. 2017. Revising the EU Material Deprivation Variables. Luxembourg: Publications Office of the European Union.
- Guio, A.-C., D. Gordon, and E. Marlier. 2012. Measuring Material Deprivation in the EU Indicators for the Whole Population and Child-Specific Indicators. Luxembourg: Publications Office of the European Union.
- Guio, A. C., D. Gordon, E. Marlier, H. N. Catalan, and M. Pomati. 2018. “Towards an EU Measure of Child Deprivation.” Child Indicators Research 11 (3): 835–860. https://doi.org/10.1007/s12187-017-9491-6.
- Guio, A.-C., D. Gordon, E. Marlier, E. Fahmy, S. Nandy, and M. Pomati. 2016. “Improving the Measurement of Material Deprivation at EU Level.” Journal of European Social Policy 26 (3): 219–333. https://doi.org/10.1177/0958928716642947.
- Harttgen, K., and S. Klasen. 2009. The well-being of migrant children and migrant youth in Europe.
- Harttgen, K., and S. Klasen. 2012. “A Household-Based Human Development Index.” World Development 40 (5): 878–899. https://doi.org/10.1016/j.worlddev.2011.09.011.
- Hicks, D. A. 1997. “The Inequality-Adjusted Human Development Index: A Constructive Proposal.” World Development 25 (8): 1283–1298. https://doi.org/10.1016/S0305-750X(97)00034-X.
- Hopkins, M. 1991. “Human Development Revisited: A new UNDP Report.” World Development 19 (10): 1469–1473. https://doi.org/10.1016/0305-750X(91)90089-Z.
- Kahneman, D., and A. B. Krueger. 2006. “Developments in the Measurement of Subjective Well-Being.” Journal of Economic Perspectives 20 (1): 3–24. https://doi.org/10.1257/089533006776526030.
- Kelley, A. C. 1991. “The Human Development Index:” Handle with Care”.” Population and Development Review, 315–324. https://doi.org/10.2307/1973733.
- Keynes, J. M. 1937. “The General Theory of Employment.” The Quarterly Journal of Economics 51 (2): 209–223. https://doi.org/10.2307/1882087.
- Lopez-Calva, L. F., and E. A. Ortiz-Juarez. 2012. “Household-Based Distribution-Sensitive Human Development Index: An Empirical Application to Mexico, Nicaragua and Peru.” Social Indicators Research 109 (3): 395–411. https://doi.org/10.1007/s11205-011-9908-4.
- Lovejoy, A. O. 1923. “The Supposed Primitivism of Rousseau's” Discourse on Inequality”.” Modern Philology 21 (2): 165–186. https://doi.org/10.1086/387491.
- Marx, K. 1867. Capital: A Critique of Political Economy. Vol. 1, The Process of Capitalist Production. Trans. S. Moore and E. Averling. F. Engles (ed.). NY: International Publishers. First published.
- Mishra, S. 2008. On A Class of Human Development Index Measures - Srijit Mishra and Hippu Salk Kristle Nathan, Indira Gandhi Institute of Development Research. India. https://policycommons.net/artifacts/2209744/on-a-class-of-human-development-index-measures/2966106/ on 14 Jul 2023. CID: 20.500.12592/90xfrp.
- Mughal, M. A. 2020. “Ethnicity, Marginalization, and Politics: Saraiki Identity and the Quest for a New Southern Punjab Province in Pakistan.” Asian Journal of Political Science 28 (3): 294–311. https://doi.org/10.1080/02185377.2020.1814360.
- Najam, A., and F. Bari. 2017. Pakistan National Human Development Report 2017. United Nations Development Programme, Islamabad, Pakistan, United Nations Development Programme, Pakistan.
- Najera, H., and D. Gordon. 2019. “The Importance of Reliability and Construct Validity in Multidimensional Poverty Measurement: An Illustration Using the Multidimensional Poverty Index for Latin America (MPI-LA).” Journal of Development Studies 56 (9): 1763–1783. https://doi.org/10.1080/00220388.2019.1663176.
- Nandy, S., M. Irving, D. Gordon, S. V. Subramanian, and D. Davey Smith. 2005. “Poverty, Child Undernutrition and Morbidity: New Evidence from India.” Bulletin of the World Health Organisation 83 (3): 210–216.
- Naoroji, D. 1901. Poverty and Un-British Rule in India. London: Swan Sonnenschein & Co.
- Naveed, T. A. 2020. Measurement and Determinants of Human Development Disparities at Household Level in Punjab (Pakistan): An Evidence from Survey Data. (PhD), University of Gujrat, http://prr.hec.gov.pk/jspui/handle/123456789/15553(20682).
- Naveed, T. A., D. Gordon, and S. Ullah. 2018. “Measurement of Educational Disparities in Punjab (Pakistan): An Analysis from MICS’s Micro-Data.” Pakistan Journal of Social Issues 7 (1): 26–49.
- Naveed, T. A., D. Gordon, S. Ullah, and M. Zhang. 2021. “The Construction of an Asset Index at the Household Level and Measurement of Economic Disparities in Punjab (Pakistan) by Using MICS-Micro Data.” Social Indicators Research 155 (1): 73–95. https://doi.org/10.1007/s11205-020-02594-3.
- Naveed, A., and S. A. Khan. 2018. Widening Disparities: Public Sector Spending and Poverty Across Districts in Punjab. Islamabad.: Pakistan Poverty Alleviation Fund.
- Naveed, T. A., K. Sarwar, M. S. e Ali, M. S. Irshad, and M. Taqi. 2022. “Globalization and Gender Disparities: A Social, Economic and Political Perspective for South Asian Countries.” Journal of Contemporary Issues in Business and Government 28 (3).
- Nawab, T., S. Raza, M. S. Shabbir, G. Yahya Khan, and S. Bashir. 2023. “Multidimensional Poverty Index Across Districts in Punjab, Pakistan: Estimation and Rationale to Consolidate with SDGs.” Environment, Development and Sustainability 25 (2): 1301–1325. https://doi.org/10.1007/s10668-021-02095-4.
- Office for National Statistics. 2018. Annual Report of the Chief Medical Officer, 2018: Health 2040 - Better Health Within Reach. Office for National Statistics.
- Palma, J. G. 2011. “Homogeneous Middles vs. Heterogeneous Tails, and the end of the ‘Inverted-U’: It's All About the Share of the Rich.” Development and Change 42 (1): 87–153. https://doi.org/10.1111/j.1467-7660.2011.01694.x.
- Panigrahi, R., and S. Sivramkrishna. 2002. “An Adjusted Human Development Index: Robust Country Rankings with Respect to the Choice of Fixed Maximum and Minimum Indicator Values.” Journal of Human Development 3 (2): 301–311. https://doi.org/10.1080/14649880220147365.
- Pareto, V. 1892. “State Expenditures in Italy as Compared with the National Wealth.” The Economic Journal 2 (7): 561–564. https://doi.org/10.2307/2955991.
- Permanyer, I. 2013. “Using Census Data to Explore the Spatial Distribution of Human Development.” World Development 46: 1–13. https://doi.org/10.1016/j.worlddev.2012.11.015.
- Piketty, T., A. Béja, and M. O. Padis. 2013. “The Return of Capital and the Growth of Inequality.” Esprit 11 (11): 85–95. https://doi.org/10.3917/espri.1311.0085.
- Preston, S. H. 1975. “The Changing Relation Between Mortality and Level of Economic Development.” Population Studies 29 (2): 231–248. https://doi.org/10.1080/00324728.1975.10410201.
- Ranis, G., F. Stewart, and E. Samman. 2006. “Human Development: Beyond the Human Development Index.” Journal of Human Development 7 (3): 323–358. https://doi.org/10.1080/14649880600815917.
- Raskall, P., and G. Matheson. 1992. “Understanding Gini Coefficient.” SPRC Newsletter 46.
- Ravallion, M. 1997. “Good and bad Growth: The Human Development Reports.” World Development 25 (5): 631–638. https://doi.org/10.1016/S0305-750X(96)00141-6.
- Ray, A. K. 2008. “Measurement of Social Development: An International Comparison.” Social Indicators Research 86 (1): 1–46. https://doi.org/10.1007/s11205-007-9097-3.
- Sagar, A. D., and A. Najam. 1998. “The Human Development Index: A Critical Review.” Ecological Economics 25 (3): 249–264. https://doi.org/10.1016/S0921-8009(97)00168-7.
- Sajjad, M., H. Munir, S. Kanwal, and S. A. A. Naqvi. 2022. “Spatial Inequalities in Education Status and Its Determinants in Pakistan: A District-Level Modeling in the Context of Sustainable Development Goal-4.” Applied Geography 140: 102665. https://doi.org/10.1016/j.apgeog.2022.102665.
- Srinivasan, T. N. 1994. “Human Development: A new Paradigm or Reinvention of the Wheel?” The American Economic Review 84 (2): 238–243.
- UNDP. 2003. Human Development Report 2003: Millennium Development Goals: A Compact Among Nations to End Human Poverty. New York: UNDP.
- UNDP. 2010. Human Development Report 2010: The Real Wealth of Nations: Pathways to Human Development. New York: UNDP.
- UNDP. 2014. Human Development Report 2014: Sustaining Human Progress: Reducing vulnerabilities and building resilience. http://hdr.undp.org/sites/default/files/hdr14-report-en-1.pdf.
- UNDP. 2016. Human Development Report 2016, Human Development for Everyone: Briefing Note for Countries on the 2016 Human Development Report (9789211264135).
- UNDP. 2018. National Human Development Report 2018. New York: UNDP.
- Weber, M. 1922. Wirtschaft und Gesellschaft: Grundriss der verstehenden Soziologie [Economy and Society: Outline of Understanding Sociology] Tübingen. JCB Mohr.
- World Health Organization. 2017. National health inequality monitoring: A step-by-step manual. WHO. https://apps.who.int/iris/handle/10665/255652.
- Yumashev, A., B. Ślusarczyk, S. Kondrashev, and A. Mikhaylov. 2020. “Global Indicators of Sustainable Development: Evaluation of the Influence of the Human Development Index on Consumption and Quality of Energy.” Energies 13 (11): 2768. https://doi.org/10.3390/en13112768.
- Zulfiqar, G. M. 2022. “Inequality Regimes, Patriarchal Connectivity, and the Elusive Right to Own Land for Women in Pakistan.” Journal of Business Ethics 177 (1): 1–13. https://doi.org/10.1007/s10551-020-04725-9.