Abstract
Fractal structure of a system suggests the optimal way in which parts are arranged or put together to form a whole. The ideas from fractals have a potential application to the researches on urban sustainable development. To characterise fractal cities, we need the measure of fractional dimension. However, if the fractal organisation is concealed in the complex spatial distributions of geographical phenomena, the common methods of evaluating fractal parameter will be disabled. In this article, a new model is proposed to describe urban density and estimate fractal dimension of urban form. If urban density takes on quasi-fractal pattern or the self-similar pattern is hidden in the negative exponential distribution, the generalised gamma function may be used to model the urban landscape and estimate its latent fractal dimension. As a case study, the method is applied to the city of Hangzhou, China. The results show that urban form evolves from simple to complex structure with time.
1. Introduction
Fractal indicates the optimum structure in nature and a fractal body can fill space in the most efficient way (Rigon et al. Citation1998, Chen Citation2008a). The concepts from fractal can be used to optimise the spatial structure of cities in future city planning. In this sense, fractal theory is helpful for us to study urban sustainable development. Cities have been demonstrated empirically to be of self-similarity (Batty and Longley Citation1994, Frankhauser Citation1994, Batty Citation2005, Chen Citation2008a). For the fractal bodies, the conventional measures such as length, area, size and density are always disabled. In this case, fractal dimension is a valid parameter to characterise urban growth and form. In many cases, we can approximately calculate fractal parameters by using the common methods including the grid method and radial method (Frankhauser Citation1998). However, if the fractal structure of city agglomerations is concealed by random noise interference or complex spatial distributions of geographical phenomena, the conventional methods will be helpless and we need other approaches such as spectral analysis to estimate fractal dimension indirectly (Chen Citation2008b).
To research fractal structure of city systems, we have to build mathematical models. For human geographical phenomena, the models are not one and only. We have more than one equation to model the size distribution of cities, and we have many a function to formulate urban population density (Zielinski Citation1979, Carroll Citation1982, Batty and Longley Citation1994, Cadwallader Citation1997, Gabaix and Ioannides Citation2004). Moreover, the parameter values of the model are not real constants. The diversity of models and the variability of model parameters suggest the complexity of human geographical systems. Fractal geometry is a powerful tool for us to explore spatial complexity of cities. Fractal dimension is the basic and important parameter to characterise urban fractal structure. The precondition of estimating the fractal dimension of a city is that it follows a power law indicative of some scaling relation between the conventional measures (e.g. length, area, density).
One of the foundations of urban structure studies is to model urban form. Population and land-use densities are two central measures for urban form modelling. The land-use patterns generally follow the power law and take on clear fractal properties (Batty and Longley Citation1994, Frankhauser Citation1994, Benguigui et al. Citation2000, De Keersmaecker et al. Citation2003, Thomas et al. Citation2007, Thomas et al. Citation2008). However, urban population distribution seems to be more complicated. Modelling urban population density is an old question. There are varied opinions on model selection of urban density (Batty and Kim Citation1992, Cadwallader Citation1997). Following the negative exponential model on urban density distribution (Clark Citation1951), a number of mathematical models as revisions or variants to Clark's law are proposed. The noticeable models include the Gaussian formulation (Sherratt Citation1960, Tanner Citation1961), the inverse power function (Smeed Citation1961, Citation1963) and the quadratic exponential equation (Newling Citation1969, Latham and Yeates Citation1970). The more general expression may be the gamma model, which is used to reconcile the debates between the negative exponential and inverse power-law distributions (Tanner Citation1961, Batty and Longley Citation1994).
An interesting discovery is that the gamma model can be expanded and then used to estimate the latent fractal dimension of urban form indirectly. In this article, a possible model is proposed to characterise the urban density, settling the arguments between several urban population density models. The study starts with the negative exponential function. The Clark's model is generalised to a negative exponential model with power by combining it with the Sherratt's model. Then, through taking the Batty–Longley's model on fractal urban form as a weight function, the exponential-power model is further developed to a new model, which can be used to estimate the fractal dimension of urban form and predict the spatial complication of urban evolvement. As an empirical analysis, the new model is applied to the city of Hangzhou in China. The results can bring us a better understanding of the basic principles on urban population density as well as the urban development patterns.
2. Mathematical models
2.1. Generalisation of the negative exponential model
Among all the models characterising the functional relationship between population density and distance, the Clark's law bears both elegant form and theoretical foundations. The negative exponential function can be derived either from the theories of strict utility-maximising associated with urban economic theory (Beckmann Citation1969, Muth Citation1969, Mills Citation1972) or from the operational urban model based on entropy-maximising (Bussiere and Snickars Citation1970, Chen Citation2008b). These derivations might constitute the foundation of the clear demonstration that disaggregate models of individual resource allocation in space based on utility-maximising were consistent with the macro-models of spatial interaction based on ideas from entropy-maximising (Batty Citation2000).
However, despite these achievements, new sharp questions were posed, such as reconciling the Clark model with the law of allometric growth on the relationships between area and population of urban systems, especially when cities take on fractal patterns. Now that the density of urban land use can be defined by an inverse power function, a contradiction will emerge immediately between the Clark model and the power law of urban area–population allometry. Batty and Kim (1992) argued that many previous estimates of population density functions should be reworked with power functions. This is an interesting and developmental viewpoint. Besides this, perhaps we should try to find other approaches to solving the problems.
As a theoretical study, for simplicity, this work is only focussed on the monocentric cities. The polycentric cities will be studied in a special paper. Assuming that population density ρ(r) at distance r from the centre of the city (where r = 0) declines monotonically according to certain relative rate of change, Clark (Citation1951) proposed an empirical expression on urban density as follows:(1)
where ρ0 is a constant of proportionality, which is expected to equal the central density of a city, i.e. ρ0 = ρ(0), and the rate parameter b denotes the density gradient, indicating a rate at which the effect of distance attenuates. If we define a characteristic radius as r0 = 1/b, then the Clark model can be rewritten in the following form:(2)
which can be derived by an entropy-maximising method (Chen Citation2008b). It is easy to prove that the negative exponential function is equivalent to a spatial autocorrelation function, and the scale parameter r0 can be associated with the spatial correlation length (Chen and Zhou Citation2008).
Many negative exponential models can be derived from the entropy-maximising hypothesis. From the view of cities, the distance variable can be defined between 0 and ∞ (0 ≤ r < ∞). Thus, the Clark's model can be derived by an entropy-maximising method. However, from the view of regions, the distance measure can be defined between negative infinity and positive infinity (−∞ < r < ∞). In this instance, we can derive Sherratt's model by using the principle of entropy maximisation. The Sherratt model is in fact a Gaussian function (Sherratt Citation1960, Tanner Citation1961):(3)
in which the constants ρ0 and r0 fulfil the same roles as in Equation (2). Apparently, the Clark's model and the Sherratt's model share a similar mathematical expression.
If we regard entropy maximisation as a cause or a process rather than a real state or a final result, we had better attach a constraint parameter to the variable of Equation (2). The parameter value varies from 1 to 2 in theory. Consequently, both the Clark's model and the Sherratt's model are extended to more general form. Actually, because of fractality of urban form, the scale parameter in Equation (2) is not real constant, but a variable depending on the urban radius we determined. In other words, there is indirect scaling relation between b and r. The relation can be revealed as(4)
where k and v are two parameters. Substituting Equation (4) in Equation (1) yields (Chen Citation1999)(5)
where σ = 1 − v is the constraint parameter and r0 = (σk)−1/σ is the rescaled characteristic radius (a new scale parameter). Of course, the coefficient ρ0 is still the density at the origin because the parameter σ is greater than 0, i.e. σ > 0. Equation (5) can be called the exponential-power model, which shows that the population density of a city is given by the exponential decay function of distance to the power σ. Apparently, if σ = 1, Equation (5) will reduce to Clark's model, and if σ = 2 as given, then Equation (5) will become Sherratt's model. It is expected that σ comes empirically between 0 and 2. Clark's model can be applied to many cities in the real world, whereas the Sherratt model has the advantage of a simpler expression for mathematical analysis (Dacey Citation1970).
2.2. A new model for urban fractal dimension estimation
Urban population depends on urban land for existence and vice versa. There is an interaction between human beings and land use of cities. Taking real urban form into consideration, we should introduce Batty–Longley's models of urban land-use patterns into the urban density model. The area–radius scaling relation of fractal cities can be written as follows (Longley et al. Citation1991, Batty and Longley Citation1994, Frankhauser Citation1998):(6)
in which r refers to radius, N(r) to the actual land-use area within the circle of radius r, the area can be represented by the number of pixels in a digital map, K denotes a proportionality coefficient and Df the parameter of fractal dimension which scales land-use area with distance. Generally speaking, the fractal dimension is less than 2 but greater than 1, namely, 1 < Df < 2. However, as a radial dimension (Frankhauser Citation1994), the fractal parameter can exceed the upper limit 2 in some special cases (White and Engelen Citation1994). According to Equation (6), the land-use density ρL can be given by the derivative of N(r) with respect to area unit (dr)d, and we have(7)
where ρL(r) is the land-use density at distance r from the centre of the city (r = 0) and d = 2 denotes the Euclidian dimension of the embedding space of urban form. However, there is no definition for the central density of a city in the inverse power function. The central density should be defined separately.
Suppose that urban population is distributed on the fractal land-use patterns. The form of land use is determined by population distribution and in turn reacts on it. Thus population density function can be used as the weight of land-use density distribution, and land-use density function can also be used as the weight of population density distribution. That is, there exists a relationship of “mutual weight” between urban population and land-use density. Combining Equation (7) with Equation (5) yields a weighted exponential-power model(8)
where C is the proportionality coefficient, other parameters play the same parts as in Equation (5). This model can be regarded as generalised gamma function (GGF) that is general enough to encompass the various arguments about one functional form or the other except Newling's model. The parameter Df is in fact fractal dimension hidden behind quasi-exponential distribution, so it can be termed as latent dimension of urban form.
The GGF differs from the standard gamma function because of the constraint parameter σ, but the basic characters of the gamma function remain (). If σ = 1, Equation (8) will be reduced to the common gamma function, which is actually a special spatial correlation function. The new model fails to define the point where r = 0, or we should define ρ(0) = ρ0 as a complement. If the fractal dimension of urban land use reaches the Euclidean dimension, i.e. Df → d = 2, the model will collapse to Equation (5); but if the characteristic radius of urban population distribution approaches infinity, namely, r0 → ∞, then the model will evolve into Smeed's (1963) formulation such as(9)
Figure 1. The patterns of the generalised gamma model with different parameter values (ρ0 = 50,000 persons/km2, r0 = 5 km). Note: The scale parameter is taken as r0 = 5 for all the lines but the fourth one with r0 = 500,000. The fractal dimension Df is based on the area–radius scaling. It is different from the box dimension in value. The value of the radial dimension can be greater than 2 if the measuring centre is not the centroid of urban area.
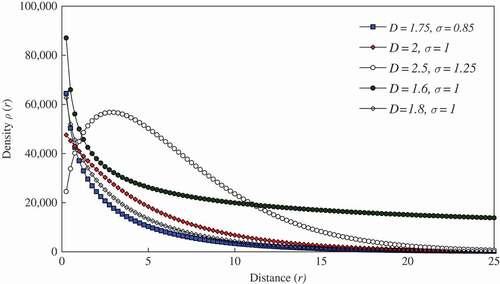
where C is the proportionality coefficient and the parameter α = d − Df refers to the scaling exponent. GGF can contain at least four urban density models with which geographers are familiar (). The variety of the urban population density model and the variability of the model parameters suggest asymmetry of human geographical systems, and the asymmetry or symmetry breaking indicates spatial complexity and complication (Chen Citation2008a).
Table 1. Urban density models encompassed by the new model (GGF)
The new model can be used to reconcile the debates between the negative exponential distribution and the inverse power distribution of urban density. Although a great majority of cities in the real world seem to be in favour of Clark's model, there once appeared other opinions. Parr (Citation1985) argued that the population density in the urban area itself prefers to confirm the negative exponential function while that of urban fringe and hinterland tends to obey the inverse power law. Another interesting viewpoint was proposed by Longley and Mesev (Citation2000), who claimed that the density function has two parts: for small r, ρ(r) decreases as Smeed's model without time dependence, whereas for larger r, ρ(r) decreases more swiftly (Benguigui et al. Citation2001).
The author's viewpoint is that the negative exponential model and the inverse power model represent different spatial modes and states. In fact, a spatial process may not be stationary, though stable (Haining Citation1990); city fractals are evolving phenomena through self-organising process (Benguigui et al. Citation2000). If the characteristic radius r0 in Equation (8) gets larger and larger, the spatial distribution of urban population has a tendency of evolving into a self-similar state. It has been demonstrated that the density gradients of cities become smaller and smaller (Berry et al. Citation1963, Banks Citation1994). This implies that, as expected, the characteristic radii do become longer and longer until the generalised gamma distribution turns to the inverse power-law distribution.
A significant use of GGF is that it can be used to estimate indirectly the fractal dimension of urban form. The new model can play its part in evaluating fractal dimension in three cases. First, there are density data of urban population, but there is an absence of land-use data. In this instance, if urban population density follows the negative exponential distribution approximately, we can use GGF to estimate the fractal dimension of land-use form. Second, the fractal pattern of urban form (say, land-use density) is concealed by negative exponential phenomena (say, population density). In this case, we had to use generalised gamma model (GGM) to estimate fractal dimension. Third, urban structure takes on self-affinity, which can be associated with exponential distribution or quasi-exponential distribution. For the purpose of verifying the above conjecture, GGF will be applied to Hangzhou, the capital of Zhejiang Province, China.
3. Empirical analyses
3.1. Study area and methods of data processing
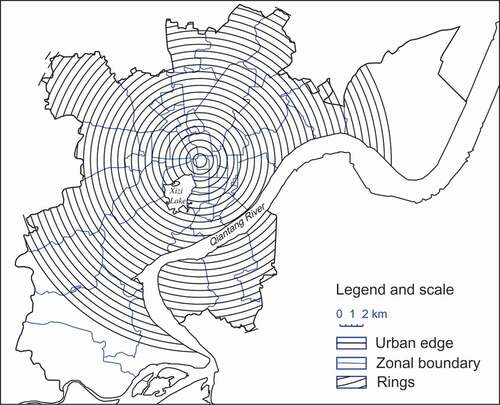
The city of Hangzhou is chosen for our empirical analyses because its population density data have already been fitted to the Clark's model (Feng Citation2002). Four sets of census data of the city in 1964, 1982, 1990 and 2000 are available. The census enumeration data are based on jie-dao, or sub-district (Wang and Zhou Citation1999), which bears an analogy with urban zones in Western literature (Batty and Longley Citation1994). In fact, a zone or sub-district (jie-dao) is an administrative unit comprising several city blocks defined by streets and other physical features. The study area is confined in the combination of city proper and its outskirts, and this scope comes approximately between the urbanised area and the metropolitan area of Hangzhou. The zone with maximum population density, which is very close to the urban functional core, is defined as the centre of the city, and the data are processed by means of spatial weighed average. The method of data processing is illuminated in detail by Feng (Citation2002). The length of sample path is 26, and the maximum urban radius is 15.3 km. The basic set of zones for population data is shown in , which displays aggregation of census data.
Figure 2. The choropleth census map of the Hangzhou metropolis. Reprinted from J. Feng, Modeling the spatial distribution of urban population density and its evolution in Hangzhou, Geographical Research 21(5) (2002), pp. 635–646.
For simplicity, we can number the rings as i (i=0,1,2,...,25), where i = 0 implies the centre of circles, and number the zones as j (j=1,2,...,47). Given(10)
where Ri refers to the ith ring, and Zj to the jth zone measured with area, it follows that Sij represents the intersection of Ri and Zj. For the ith ring, defining a weight as(11)
we have(12)
whererepresents the population density of the jth zone and
denotes the weighted average density of the ith ring. The computations form four urban population density samples (see Appendix 1).
3.2. Computations and analysis
We have two approaches for fitting the urban density data to the models, including the negative exponential and the exponential-power model. One approach is the curvilinear regression based on the least-square method, and the other is non-linear curve fit based on iteration technique. For a great majority of cases, the two approaches are not equivalent, thus the results are different. The choice of the specific method is based on study objective. Generally speaking, the former approach is for theoretical explanation, whereas the latter one is for practical prediction. The ordinary least square method will be used to estimate the values of the model parameters for the purpose of theoretical research.
First, we should decide which model is more appropriate to the population density of Hangzhou city. As experimentation, various functions possible for modelling urban density, including logarithmic function, power function, normal function and lognormal function, are tested one by one by regression analysis. On the whole, the modelling results are not satisfactory, or the physical meaning of the parameter values cannot be explained. However, when the data are fitted to the Clark model, the results are acceptable (Feng Citation2002). The evaluation of the coefficients ρ0 and r0 of the negative exponential model is relatively simple. Turning the model into the linear form by means of log transformation, we can perform the linear regression using any software for mathematical or statistical analysis. As for the parameters of exponential-power model and the new model, it is not very convenient. Let k = 1/(σrσ0), then the characteristic radius r0 in Equations (5) and (8) can be given by r0=(σk)−1/σ.
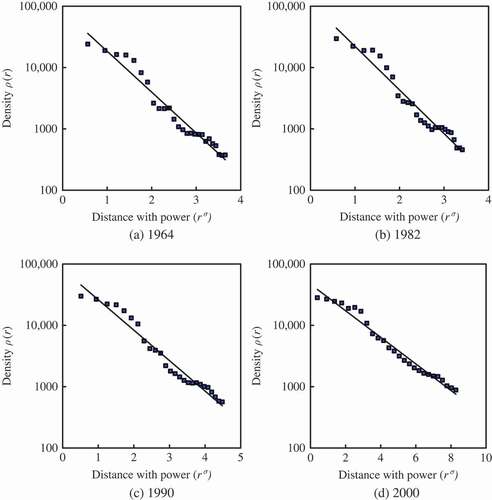
Fitting the urban density data to Equations (2) and (5), respectively, by the least-square calculation yields the estimated values of the parameters in the models (). For visual examination, the data points can be displayed on two kinds of plots: arithmetic plot and semi-logarithmic plot. In the semi-logarithmic plot, the negative exponential function seems not to be the best selection for the urban density of Hangzhou (Appendix 1), but the goodness of fit goes up as a whole from 1964 to 2000 (). If we use the exponential-power model, i.e. Equation (5), to replace the negative exponential model, Equation (2), we can get better effect of fit, which is shown in (Appendix 2). However, the criterions for model selection cannot be confined to statistics such as goodness of fit, standard error and so on. As Samuel Karlin (1983) pointed out: ‘The purpose of models is not to fit the data, but to sharpen the questions’ (quoted from Buchanan Citation2000, p. 85).
Table 2. Estimated values of model parameters for urban density of Hangzhou city in four years
Figure 3. The semi-logarithmic plots based on the exponential-power model of urban population density for Hangzhou in four years.
To calculate the fractal dimension of urban land-use structure through the weighed exponential-power model, GGF, we need at least two statistical criteria: one is the global statistic – determination coefficient, R2, which must pass the statistical test; the other is the local statistic – P-values of the regression coefficients indicative of significance, which must be less than 0.05. The criterions can be summed up as ‘Maximise R2 subject to P-value < 0.05’, according to which we determine the values of the constraint parameter σ. Taking natural logarithms on both sides of Equation (8) gives a two-variable quasi-linear regression equation(13)
by which the latent fractal dimension of urban form, Df, can be estimated. As for Hangzhou, a least-squares computation gives the following results, which are listed in . The trend lines on the semi-logarithmic plots are not straight because of non-linear relationships (). The results suggest that the urban land use has been spreading (the fractal dimension Df becomes larger and larger), whereas the population has been concentrating (the characteristic radius r0 becomes smaller) despite some evidence for suburbanisation round about 2000 (Feng Citation2002, Feng and Zhou Citation2005).
Figure 4. The semi-logarithmic plots based on GGF of urban density for Hangzhou in four years.
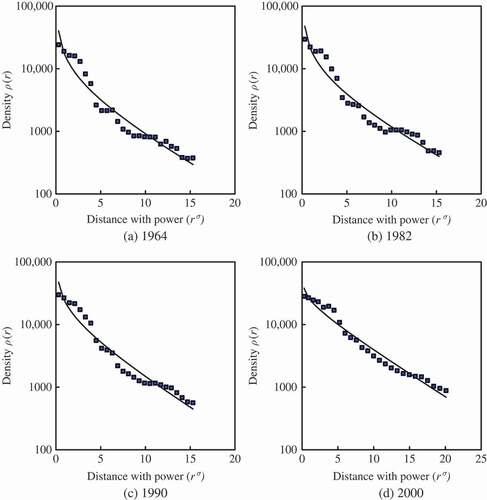
Table 3. Estimated values of fractal dimension and related parameters of the new model of Hangzhou's urban form
To analyse the spatiotemporal evolution of Hangzhou's urban form, we can collect the estimated results of the principal parameters and have tabulated them as follows (). Furthermore, we can calculate the information entropy of Hangzhou's population distribution by using the following formula:(14)
Table 4. Characteristic radius, latent fractal dimension and information entropy of Hangzhou, 1964–2000
where H denotes information entropy, i = 0, 1, …, n (the number of rings is n + 1 = 26) and the “probability” pi is defined by(15)
in which the symbolfulfils the same roles as in Equation (12). The results are also displayed in for comparison with fractal dimension.
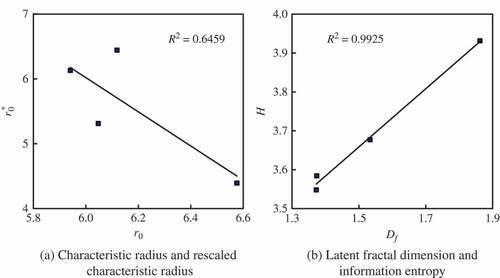
There seems to be some contradiction between the results based on the negative exponential model and those based on GGF. According to the negative exponential model, the characteristic radius became larger as a whole from 1964 to 2000 (). However, according to the GGM, the rescaled characteristic radius became smaller from 1982 to 2000 (). Generally speaking, the conclusion drawn from the negative exponential model should correspond to that from the new model. In fact, the population in Hangzhou region kept concentrating at large scale from 1975 to 2000 (Chen and Jiang Citation2009). In this sense, the result indicates that the characteristic radius becomes smaller for the time being, which may be more consistent with the reality. On the contrary, the latent dimension went up from 1964 to 2000. The increase trend of the fractal dimension value is linearly correlated with that of the information entropy (). This lends further empirical support to the theoretical relation between information entropy and fractal dimension (Ryabko Citation1986). Fractal dimension increased and went towards d = 2, meanwhile the rescaled characteristic radius descended. All this seems to suggest the trend of Hangzhou's population density evolved from the non-standard negative exponential distribution into the standard negative exponential distribution within this period. Meanwhile, the information entropy increased, suggesting a process of spatial entropy maximisation.
Figure 5. Typical parameter relationships of Hangzhou, 1964–2000.
4. Questions and discussion
4.1. Entropy maximisation, spatial optimisation and 3R cities
The essence of fractals is the scaling symmetry (Mandelbrot and Blumen Citation1989). Symmetry is a significant concept for us to understand cities as systems and systems of cities (Chen Citation2008a). One of the basic properties of urban evolution is to follow the scaling laws indicative of contraction or dilation symmetry. Symmetry depends on the conservation law, whereas the universality of natural laws depends on symmetry. Without symmetry there would be no universality of natural laws. Symmetry and symmetry breaking are always related with complexity and complication (Mainzer Citation2005, Chen Citation2008a). Human geographical systems are of no translational symmetry in both space and time. The translational symmetry seems to be replaced by the scaling symmetry suggesting fractals. Mathematical models of cities are different under different spatial and temporal conditions. Even under the same spatiotemporal condition, an urban phenomenon can be described with different models. The complexity of cities is marked by two aspects: the diversity of mathematical models and the variability of parameter values of a model. Therefore, it is hard to say which model is better for urban population density. Different models have different uses and can be used to characterise different states of the urban phenomenon.
Exponential models indicate the translational symmetry of urban form, and power law relations suggest the dilation/scaling symmetry of urban evolvement (Chen Citation2008a). Based on the hierarchical structure of cities, a power law can be decomposed into two exponential laws (Chen and Zhou Citation2008). In this sense, translational symmetry lays the foundation of scaling symmetry. A negative exponential model can be derived by an entropy-maximising method (e.g. Curry Citation1964, Bussiere and Snickers Citation1970, Wilson Citation1970, Chen Citation2008b). Accordingly, a power law can also be derived from the principle of entropy maximisation (Chen Citation2009). The spatial optimisation of fractal cities can be comprehended from the angle of view of entropy maximisation. Note that the entropy of human systems differs from that of physical systems, and entropy maximisation of urban systems is dissimilar to the entropy increase in thermodynamics of physical systems (Wilson Citation1970, Wilson Citation2000). Thermodynamic entropy implies disorder, whereas human entropy always indicates structure. Let us take the negative exponential model based on Hangzhou city as an example to illustrate this concept.
Suppose that the total population in the urban field of a monocentric city is Pt and the urban growth is considered to be a continuous spatiotemporal process. An urban field is defined as a bounding circle with a radius of R from the city centre. In the digital map, we can string n + 1 pixels indicating cells (Chen Citation2008b). Further suppose that the population in the ith cell along a radius is ρi (i = 0, 1, 2, …, n), and the whole population on the radius is P. Then the state entropy of population distribution profile, He, can be given by(16)
where W is number of states of the population distributed in all the cells along the radius. Based on Equation (16), a non-linear programming model can be constructed as follows:(17)
This denotes that the urban entropy approaches maximisation, subjected to certain total population of the city and the constant average population in every direction. One of the dual forms of the non-linear programming is(18)
This suggests that the total population within the urban field approaches minimisation, conditioned by certain urban entropy and the determinate population in each direction.
Entropy maximisation is the underlying rationale of the Clark's model. Starting either from Equation (17) or from Equation (18), we can derive Equations (1) or (2) (Chen Citation2008b). Where mathematical modelling is concerned, Equation (17) is equivalent to Equation (18). However, as far as physical meaning is concerned, Equation (17) is different from Equation (18). Derivation of Clark's model from Equation (17) suggests that city systems seek equity for individuals (elements). When population size is given, a city tries to maximise its information entropy. Entropy is a measure of conditional uniformity. Entropy maximisation indicates the most probable state of urban population distribution. The people living in the central part of a city can enjoy better social service but have to suffer worse ecological environments. In contrast, the people living in suburbs can enjoy a better natural environment but have to suffer a worse social service. On the contrary, derivation of the exponential distribution from Equation (18) suggests that city systems seek efficiency for the whole. When information entropy is certain, a city tries to minimise its population size, and thus waste less land and resources. This accounts for the fact that a great majority of cities in the world are small urban places rather than metropolises. (It is hard to make clear all these questions in a few lines of words, and the discussion will be expanded in a companion paper.)
All in all, the principle of entropy maximisation is the underlying rationale of city fractals. An exponential model is based on one process of entropy maximisation, whereas a power-law model indicative of fractals is based on two correlative processes of entropy maximisation. The state entropy of a city system (He) defined by Equation (16) is proportional to its information entropy (H) defined by Equation (14), and the information entropy is in proportion to its fractal dimension (). Fractal dimension implies space-filling extent and spatial order. Entropy maximisation of cities suggests that a city should possess the minimum population size subject to certain spatial order, or the maximum spatial order subject to certain population size. In the light of the essential entropy maximisation of urban evolvement, fractal structure of cities implies the best balance relation between the equity of individuals and the efficiency of all of city systems. How to appease the conflict between the equity and the efficiency is a difficult problem in economics, which has needed to be solved for a long time. Cultivating fractal structure through self-organised process may be one of the best ways out.
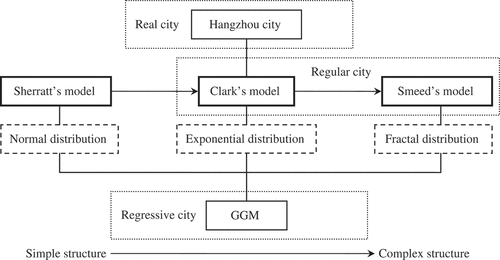
In terms of the above studies, cities can be divided into three categories: real city, regular city and regressive city. (1) Real city: the city in reality. It indicates what a city really is at present. A real city may possess well-developed structure or underdeveloped structure. The Newling's model, or the lognormal model, or one of the models displayed in can be used to characterise the population density of a real city (). (2) Regular city: the well-ordered city with symmetrical structure. It denotes what a city is expected to be according to some theory or model. A regular city bears two characters: first, it can be described by the mathematical models indicating optimised structure, and second, the model parameters such as fractal dimension fall into the proper range. The Clark's model or Smeed's model can be used to describe the population density of monocentric regular cities. Clark's model is of translational symmetry whereas Smeed's model is of scaling symmetry. Both these models are based on entropy maximisation, suggesting the good relationship between equity and efficiency of urban development. (3) Regressive city: a city in transitory state. A real city should evolve around the regular city, or we should urge the real city to evolve towards the regular city. If national planning policies are proper, the real cities evolve close to the regular city. However, if national planning policies are not proper or even wrong, the real cities evolve away from the regular city.
Table 5. Three categories of cities and the corresponding models
If we plan a real city with the idea from the model of regular city, the real city may come into the state of regressive city. The GGM is suitable for describing the regressive cities coming between the negative exponential distribution and inverse power-law distribution (). For the regressive cities, the model reflecting spatial structure is not very clear. It is often on the line or cuts both ways. In this instance, the fractal structure is usually hidden and the fractal dimension cannot be estimated with the power-law relation.
4.2. GGM indicates state of urban evolvement
The results of modelling Hangzhou's urban form and the change trend of parameters remind us of spatial complexity and complication. The concepts of “complexity” and “complication” come from John von Neumann, who is often considered to be one of the well-known scientists having made the greatest contribution to the topic of complexity in modern science. In von Neumann's work, the terms “complexity” and “complication” are used in the same context and it is difficult to determine whether he uses them as synonyms or as two different situations (Israel Citation2005). Today we often relate or equate complexity to/with complication: “complex” indicates something consisting of many different and related parts, whereas “complicate” denotes making things more difficult or confusing to understand by making them more complex. However, in recent years, “complication” has been endowed with new meaning so that it differs from “complexity” to some extent. Today, the notion of complication suggests the transfer from complex structure to much more complex structure in the evolution of complex systems (Sonis Citation2002).
Reconciling the Gaussian function, exponential function and power function, the new model can be utilised to predict the spatial complication of urban evolution. When the latent dimension Df → d = 2, the population distribution approaches a Euclidean plane, and the model evolves into the exponential-power model. Then, if the constraint parameter σ → 2, the exponential distribution will evolve into the normal distribution. This is a process of degeneration indicating unsustainable urban growth. On the contrary, if the characteristic radius r0 → ∞, and the fractal dimension comes between 1 and 2, the exponential distribution will evolve into the power-law distribution indicative of fractal landscape. This is a process of advancement and complication indicative of sustainable urban development. In fact, the emergence of fractal structure suggests spatial complexity. Complexity is a relative conception. Compared with the normal distribution, the exponential distribution suggests complexity (Goldenfeld and Kadanoff Citation1999); but compared with exponential distribution, the power-law distribution implies complexity (Barabási Citation2002, Barábasi and Bonabeau Citation2003). Moreover, fractal dimension is a complexity measure, which can be related mathematically to the degree of complexity (Ryabko 1986). The urban density of Hangzhou seems to come between simple state and complex state at present (). In the future, it may evolve into complex state through self-organising processes.
Figure 6. A sketch map of urban evolution of population density from simple to complex structure.
4.3. Fractal, complexity and sustainable cities
In many countries, especially developing countries, urban man–land relations became more and more strained in large cities because of population explosion. For example, fast urbanisation resulted in deficiency of usable land and freshwater in numerous cities of China; urban population suffered exponential growth while available land and water resources were limited. How to make reasonable use of urban land and freshwater is of vital importance to urban sustainability. The ideas from fractals provide a possible or potential way out. First, fractal bodies can occupy space in the optimum mode. If a city is designed or planned by means of fractal concepts, it will possibly fill up the geographical space in the best way so that urban land is economised for future development (Chen Citation2008a). Second, both cities and rivers enjoy similar fractal scaling relations. Fractal theory can be used to harmonise the cities with natural environments including rivers (Chen Citation2009). Thus, the freshwater resources can be distributed and utilised within reason in urban and rural regions. Third, as indicated above, fractal organisation can be employed to reconcile the equity of individuals with efficiency of the whole city.
Central place systems and rank-size distribution of cities are demonstrated to be fractals (Arlinghaus Citation1985, Frankhauser Citation1990, Batty and Longley Citation1994). Potentially, the central place fractal and Zipf's law can be used to optimise intercity relations in a region, i.e. hierarchy and network of cities. The Smeed's model is associated with self-similar fractal form, whereas the Clark's model indicates some self-affine fractals. Both these models can potentially be used to optimise intra-urban structure. Fractal methods can be applied to both monocentric cities and polycentric cities. The fractal form of polycentric cities can be measured with the grid method, whereas the fractal growth and form of monocentric cities can be researched with radial method or grid method (Frankhauser Citation1998). The Clark's model and Smeed's model are based on radial method. So this article is only involved with monocentric cities.
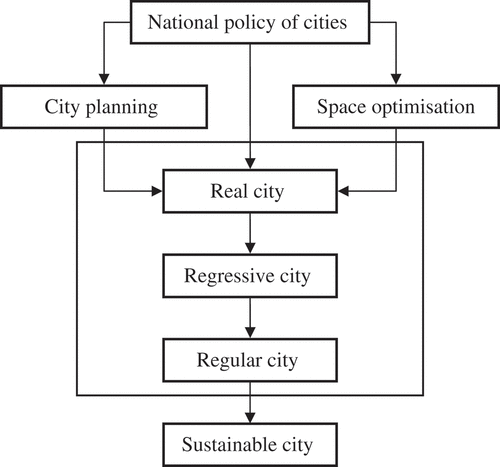
For the developed countries with lower population density, the Clark's model or Smeed's model can be used to optimise the urban population distribution. In contrast, for the developing countries with higher population density, we should use Smeed's model to optimise urban form in a more complex way. The Clark's model of urban density often suggests some kinds of hidden fractal structure (Chen Citation2008b). Compared with the negative exponential distribution, the inverse power-law distribution of population takes on clear fractal pattern and thus can make the best of geographical space. Batty and Kim (Citation1992) presented a significant idea, ‘form follows function’. They argued that urban population density should be modelled with inverse power law rather than negative exponential law. My argument is that real cities may follow the power law or exponential law, but the power law can be used to design future regular cities for populous regions (). In theory, we can make the use of city planning and self-organised processes to urge urban form to evolve into the inverse power-law distribution.
Figure 7. National policy, city planning and urban sustainable development.
Fractal optimisation of urban form and structure is based on two keys: one is the self-similar distribution and the other is appropriate fractional dimension. If the urban form satisfies the fractal distribution, the value of the fractal dimension will play an important role in urban function and efficiency. Suppose that a city suffers no influence from physical phenomena such as mountain and sea. If the fractal dimension of the city is too low, say, Df < 1.5, the urban space will be underfilled and urban land use will be wasteful. On the contrary, if the fractal dimension is too high, say, Df > 1.9, the urban space will be overfilled and urban land will be deficient. To characterise urban spatial structure, we must evaluate the fractal dimension of urban form. The main purpose of the new gamma model is to estimate the latent dimension and predict the natural evolutive direction (from simple structure to complex structure or from complex structure to simple structure). As space is limited, the related questions will be discussed in future studies.
5. Conclusions
Modelling urban density is not a new issue, but many questions in this field are still pending further discussion. In fact, few human geographical problems have generated more research than the urban population density problem. However, a great deal of research is no guarantee of essential progress. This article represents a new attempt at modelling urban population density using the ideas from fractal theory. The GGM has at least four uses: the first is to reconcile the debates between the negative exponential model, inverse power law and normal model of urban density; the second is to characterise urban man-land relations; the third is to estimate the latent fractal dimension and the fourth is to predict spatial complication of urban evolvement. The main points of this research can be summarised as follows.
First, it is not necessary for us to find the best model for urban density. Complex systems such as cities can be modelled with multiple mathematical equations. The diversity of models and variability of model parameters suggest complexity of city systems. Different models reflect different state of urban development and have different purposes in urban studies. The new model can be used to predict the spatial complication of urban evolution from simple to complex and then to more complex structure. The Gaussian distribution suggests a simple structure, the exponential distribution suggests a complex structure and the power distribution suggests an even more complex structure. As to the GGM, when the constraint parameter (σ) varies from 2 to 1, the weighted Gaussian distribution will change into the negative exponential distribution; when the scale parameter (r0) approaches ∞, the negative exponential distribution will evolve into the power-law distribution. The power law of cities is always associated with fractals and spatial complexity.
Second, we can use GGF to estimate the hidden fractal dimension of urban form. If the power-law distribution is concealed by quasi-exponential distribution, we can estimate the fractal parameter value by using the GGM. The fractal dimension is termed “latent dimension” in this context. Fractals suggest the optimised structure of city systems, and the fractal dimension is an indication of spatial optimisation. If the fractal dimension of urban form is too high, the urban space will be overfilled and many urban problems such as traffic congestion and smog will become severe; in contrast, if the fractal dimension is too low, the urban space will be underfilled and the urban land use will be wasteful. The proper fractal dimension is one of the preconditions for spatial optimisation of cities.
Third, fractals and spatial complexity can play the basic role in the studies of urban sustainability. Cities as systems and systems of cities are complex spatial systems (Allen Citation1997, Wilson 2000, Chen 2008a). Without the theory of spatial complexity, we could not comprehend urban systems, and thus could not solve many essential problems for sustainable development. On the contrary, the emergence of fractal patterns from urban form is a process of spatial complication. Fractal dimension is a measure of complexity, and fractal theory is a powerful tool for exploring spatial complexity. Especially, the theory of fractal cities has a potential application to urban optimisation. The idea from fractals can be used to design better urban structure, improve urban man-land relations, reconcile the equity of individuals with efficiency of the whole of cities and so on. Therefore, the studies of city fractals can lay a theoretical foundation for the studies of urban sustainable development.
Acknowledgements
This research was sponsored by the Natural Science Foundation of Beijing (Grant No. 8093033) and the National Natural Science Foundation of China (Grant No. 40771061). The support is gratefully acknowledged. The author thanks Dr. Jian Feng at the Peking University for providing essential material on the urban density of Hangzhou. Many thanks to two anonymous referees whose comments have been very helpful in preparing the final version of this article.
Additional information
Notes on contributors
Yanguang Chen
Yanguang Chen is an associate professor at the College of Urban and Environmental Sciences, Peking University, China. He received his BA degree from Huazhong Normal University, his master's degree in Northeast Normal University and his Ph.D from Peking University. He is currently the teacher of “Mathematical Methods in Geography”, “Quantitative Geography” and “Systems Engineering of Urban Planning” of PKU.
Related Research Data
References
- Allen, P.M., 1997. Cities and regions as self-organizing systems: models of complexity. Amsterdam: Gordon and Breach Science Pub; 1997.
- Angel, S., and Hyman, G.M., 1976. Urban fields: a geometry of movement for regional science. London: Pion Press; 1976.
- Arlinghaus, S., 1985. Fractals take a central place, Geografiska annaler B 67 (2) (1985), pp. 83–88.
- Banks, R.B., 1994. Growth and diffusion phenomena: mathematical frameworks and applications. Berlin, Heidelberg: Springer-Verlag; 1994.
- Barabási, A.-L., 2002. Linked: the new science of network. Cambridge, MA: Perseus Publishing; 2002.
- Barabási, A.-L., and Bonabeau, E., 2003. Scale-free networks, Scientific american 288 (5) (2003), pp. 50–59.
- Batty, M., 2000. Less is more, more is different: complexity, morphology, cities, and emergence (Editorial), Environment and planning B: planning and design 27 (2000), pp. 167–168.
- Batty, M., 2005. Cities and complexity: understanding cities with cellular automata. Cambridge, MA: MIT Press; 2005.
- Batty, M., and Kim, K.S., 1992. Form follows function: reformulating urban population density functions, Urban studies 29 (1992), pp. 1043–1070.
- Batty, M., and Longley, P.A., 1994. Fractal cities: a geometry of form and function. London: Academic Press; 1994.
- Beckmann, M.J., 1969. On the distribution of urban rent and residential density, Journal of economic theory 1 (1969), pp. 60–67.
- Benguigui, L., Czamanski, D., and Marinov, M., 2001. City growth as a leap-frogging process: an application the Tel-Aviv metropolis, Urban studies 38 (10) (2001), pp. 1819–1839.
- Benguigui, L., Czamanski, D., Marinov, M., and Portugali, J., 2000. When and where is a city fractal?, Environment and planning: planning and design 27 (2000), pp. 507–519.
- Berry, B.J.L., Simmons, J.W., and Tennant, R.J., 1963. Urban population densities: structure and change, Geographical review 53 (1963), pp. 389–405.
- Buchanan, M., 2000. Ubiquity: the science of history or why the world is simpler then we think. London: Weidenfeld & Nicolson; 2000.
- Bussiere, R., and Snickers, F., 1970. Derivation of the negative exponential model by an entropy maximizing method, Environment and planning A 2 (1970), pp. 295–301.
- Cadwallader, M.T., 1997. Urban geography: an analytical approach. Upper Saddle River, NJ: Prentice Hall; 1997.
- Carroll, C., 1982. National city-size distributions: What do we know after 67 years of research?, Progress in human geography 6 (1) (1982), pp. 1–43.
- Chen, Y.G., 1999. The fractal model of urban population density-decay and its related forms, Journal of Xinyang teachers college (natural science edition) 12 (1999), pp. 60–64, [In Chinese].
- Chen, Y.G., 2008a. Fractal urban systems: scaling, symmetry, and spatial complexity. Beijing: Scientific Press; 2008a, [In Chinese].
- Chen, Y.G., 2008b. A wave-spectrum analysis of urban population density: entropy, fractal, and spatial localization, Discrete dynamics in nature and society, 2008 (2008b), p. 22, article ID 728420.
- Chen, Y.G., 2009. Analogies between urban hierarchies and river networks: fractals, symmetry, and self-organized criticality, Chaos, soliton & fractals 40 (4) (2009), pp. 1766–1778.
- Chen, Y.G., and Jiang, S.G., 2009. An analytical process of the spatio-temporal evolution of urban systems based on allometric and fractal ideas, Chaos, soliton & fractals 39 (1) (2009), pp. 49–64.
- Chen, Y.G., and Zhou, Y.X., 2008. Scaling laws and indications of self-organized criticality in urban systems, Chaos, soliton & fractals 35 (1) (2008), pp. 85–98.
- Clark, C., 1951. Urban population densities, Journal of royal statistical society 114 (1951), pp. 490–496.
- Curry, L., 1964. The random spatial economy: an exploration in settlement theory, Annals of the association of American geographers 54 (1964), pp. 138–146.
- Dacey, M.F., 1970. Some comments on population density models, tractable and otherwise, Papers of the regional science association 27 (1970), pp. 119–133.
- De Keersmaecker, M.-L., Frankhauser, P., and Thomas, I., 2003. Using fractal dimensions for characterizing intra-urban diversity: the example of Brussels, Geographical analysis 35 (4) (2003), pp. 310–328.
- Feng, J., 2002. Modeling the spatial distribution of urban population density and its evolution in Hangzhou, Geographical research 21 (5) (2002), pp. 635–646, [In Chinese].
- Feng, J., and Zhou, Y.X., 2005. Suburbanization and the changes of urban internal spatial structure in Hangzhou, China, Urban geography 26 (2) (2005), pp. 107–136.
- Frankhauser, P., 1990. Aspects fractals des structures urbaines, L'Espace géographique 19 (1) (1990), pp. 45–69.
- Frankhauser, P., 1994. La fractalité des structures urbaines. Paris: Economica; 1994.
- Frankhauser, P., 1998. The fractal approach: a new tool for the spatial analysis of urban agglomerations, Population: an English selection 10 (1) (1998), pp. 205–240.
- Gabaix, X., and Ioannides, Y.M., 2004. "The evolution of city size distributions". In: Henderson, J.V., and Thisse, J.F., eds. Handbook of urban and regional economics. Vol. 4. Amsterdam: North-Holland Publishing Company; 2004. pp. 2341–2378, (Chap. 53).
- Goldenfeld, N., and Kadanoff, L.P., 1999. Simple lessons from complexity, Science 284 (2) (1999), pp. 87–89.
- Haining, R., 1990. Spatial data analysis in the social and environmental sciences. Cambridge: Cambridge University Press; 1990.
- Israel, G., 2005. The science of complexity: epistemological problems and perspectives, Science in context 18 (3) (2005), pp. 479–509.
- Latham, R.F., and Yeates, R.F., 1970. Population density growth in metropolitan Toronto, Geographical analysis 2 (1970), pp. 177–185.
- Longley, P.A., Batty, M., and Shepherd, J., 1991. The size, shape and dimension of urban settlements, Transactions of the institute of British geographers (new series) 16 (1) (1991), pp. 75–94.
- Longley, P.A., and Mesev, V., 2000. On the measurement and generalization of urban form, Environment and planning A 32 (2000), pp. 473–488.
- Mainzer, K., 2005. Symmetry and complexity: the spirit and beauty of nonlinear science. Singapore: World Scientific; 2005.
- Mandelbrot, B.B., and Blumen, A., 1989. Fractal geometry: What is it, and what does it do?, Proceedings of the royal society of London A: mathematical and physical sciences 423 (1864) (1989), pp. 3–16.
- March, L., 1971. Urban systems: a generalized distribution function, London papers in regional science 2 (1971), pp. 156–170.
- Mills, E.S., 1972. Studies in the structure of the urban economy. Baltimore, MD: Johns Hopkins University Press; 1972.
- Muth, R., 1969. Cities and housing: the spatial patterns of urban residential land use. Chicago, IL: University of Chicago Press; 1969.
- Newling, B.E., 1969. The spatial variation of urban population densities, Geographical review 59 (1969), pp. 242–252.
- Parr, J.B., 1985. A population-density approach to regional spatial structure, Urban studies 22 (1985), pp. 289–303.
- Rigon, R., Rodriguez-Iturbe, I., and Rinaldo, A., 1998. Feasible optimality implies Hack's law, Water resources research 34 (11) (1998), pp. 3181–3189.
- Ya, Ryabko, B., 1986. Noise-free coding of combinatorial sources, Hausdorff dimension and Kolmogorov complexity, Problemy peredachi informatsii 22 (3) (1986), pp. 16–26.
- Sherratt, G.G., 1960. "A model for general urban growth". In: Churchman, C.W., and Verhulst, M., eds. Management sciences, model and techniques: proceedings of the sixth international meeting of institute of management sciences, Vol. 2. Oxford: Pergamon Press; 1960. pp. 147–159.
- Smeed, R.J., 1961. The traffic problem in towns. Manchester statistical society papers. Manchester: Norbury Lockwood; 1961.
- Smeed, R.J., 1963. Road development in urban area, Journal of the institution of highway engineers 10 (1963), pp. 5–30.
- http://www.camtp.uni-mb.si/ Last accessed 02Feb2010. , Sonis, M., 2002. Complication of linear spatial socio-economies. Let's face chaos through nonlinear dynamics (Lectures in the 5th international summer school/conference) [online]. Slovenia: CAMTP, University of Maribor. Available from.
- Tanner, J.C., 1961. Factors affecting the amount travel. Road research technical paper no. 51. London: HMSO (Department of Scientific and Industrial Research); 1961.
- Thomas, I., Frankhauser, P., and Biernacki, C., 2008. The morphology of built-up landscapes in Wallonia (Belgium): a classification using fractal indices, Landscape and urban planning 84 (2008), pp. 99–115.
- Thomas, I., Frankhauser, P., and De Keersmaecker, M.L., 2007. Fractal dimension versus density of built-up surfaces in the periphery of Brussels, Papers in regional science 86 (2) (2007), pp. 287–308.
- Wang, F.H., and Zhou, Y.X., 1999. Modeling urban population densities in Beijing 1982–90: suburbanisation and its causes, Urban studies 36 (1999), pp. 271–287.
- White, R., and Engelen, G., 1994. Urban systems dynamics and cellular automata: fractal structures between order and chaos, Chaos, solitons & fractals 4 (4) (1994), pp. 563–583.
- Wilson, A.G., 1970. Entropy in urban and regional modelling. London: Pion Press; 1970.
- Wilson, A.G., 2000. Complex spatial systems: the modelling foundations of urban and regional analysis. Singapore: Pearson Education Asia Pte Ltd; 2000.
- Zielinski, K., 1979. Experimental analysis of eleven models of population density, Environment and planning A 11 (1979), pp. 629–641.
Appendix
Appendix 1. The urban population density data of Hangzhou and negative exponential decay patterns
The urban population density data of Hangzhou in four years are processed by Feng (Citation2002). These data are listed in . Fitting the four sets of data to the negative exponential model, the effect of point-line match is displayed in .
Figure A1. The semi-logarithmic plot of population density of Hangzhou in four years.
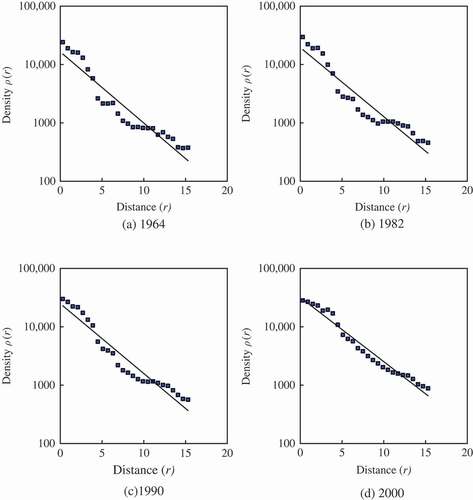
Table A1. Average population density and related variables of Hangzhou city in four years
Appendix 2. Which model is more suitable for the urban density of Hangzhou city?
The choice of model can be decided by comparing adjusted correlation coefficient square and the standard error of three models: the negative exponential model, the exponential-power model and the weighted exponential-power model (GGM). As far as the adjusted R2 and standard error are concerned, the exponential-power model is the best one, and the negative exponential model is not very good. GGM comes between the negative exponential model and the exponential-power model according to adjusted R2 and standard error (). Where prediction is concerned, the exponential-power model is more advisable; but where explanation is concerned, the weighted exponential-power model is the best one.
Table A2. The R2, adjusted R2 and standard error values of three urban density models in four years
Appendix 3. More empirical evidences for the GGM of urban density
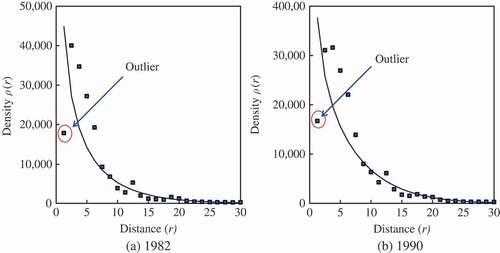
The GGMs and the related method of fractal dimension estimation for urban form can be applied to other cities, especially the concentric cities, in the world. For example, we can fit the population density data of Beijing city, China, in 1982 and 1990, to Equation (8). The fractal dimension of land-use patterns are estimated and tabulated as follows (). The results also suggest that the urban land use expanded as both the fractal dimension and the characteristic radius grew. It can be seen from the scatter plot that the data points are distributed along a trend line approximately, except for the first point indicative of the “central political district (CPD)” (). CPD bears an analogy with the central business district (CBD) in the Western cities, where the resident population is always smaller than what is expected (Clark Citation1951). Therefore, the first data point as an outlier is usually rejected (Clark Citation1951, Banks Citation1994). In fact, Beijing is not a typical concentric city, and the modelling result is not good enough to be taken as an example. This lends further support to the judgment that the general gamma model should be applied to the monocentric cities.
Figure A2. The arithmetic plots based on the generalised gamma model of population density for Beijing in 1982 and 1990. Note: Like the Clark's model, the “generalised gamma model” is made for the population density of monocentric cities. Beijing is a quasi-polycentric city with multiple nuclei, thus, the modelling effect is not satisfactory.