
Abstract
Urban metabolism as a framework has enabled understanding the interactions between humans, natural, and built environment. The concept is multidisciplinary and urban metabolism models have been used in identifying certain issues of urban planning. Apart from sociopolitical and economic aspects, metabolism also has spatial dimension. The spatial dimension is reflected in the metabolic processes which is inherent in the problems of uneven socioecological metabolisms that persist in the production of urban spaces. Urban planning developed as a discipline for balanced spatial development of urban metabolic processes. For sustainable development of the city, it is necessary for urban planning to follow metabolic processes but in reality this need not always be the case. It is possible for planning and urban metabolism to be spatially inconsistent. The results presented in this paper show the costs of such a divergence in the water supply system of Bengaluru city.
1. Introduction
Recent studies on sustainable cities have used urban metabolism as a useful framework for understanding the processes of urban systems and their impact on the hinterland (Kennedy et al. Citation2010; Pincetl et al. Citation2012; Chrysoulakis et al. Citation2013). Urban metabolism allows us to understand the interactions between human beings, the natural setting, and the built environment. The concept is multidisciplinary and is equally applicable to urban planning. Urban metabolism models have enabled the quantification of physical flow of resources and have provided alternative methods for urban planning (Kennedy et al. Citation2010; Chrysoulakis et al. Citation2013). The intricacies of urban water metabolism have been understood through urban metabolism framework and models (Gandy Citation2004; Swyngedouw Citation2006; Pincetl et al. Citation2012) which provide a comprehensive picture of coupled socioecological systems for urban planners (Mehta et al. Citation2013).
Apart from these aspects, there is yet another dimension to urban metabolism which is spatial in nature. The spatial dimension is reflected in the metabolic processes happening at local, regional, and global scales (Bai Citation2007). The spatial dimension is also inherent in the problems of uneven socioecological metabolisms that persist in the production of urban spaces (Heynen et al. Citation2006). Consequently, urban planning has emerged as a discipline for balanced spatial development of urban metabolic processes through policies (Gandy Citation2006). While it is necessary for the urban planning to follow the metabolic processes of the city for sustainable development, in reality this need not always be the case. It is possible for the planning and the urban metabolism to be spatially inconsistent. This paper seeks to explore the consequences of this inconsistency, particularly the costs of such a divergence.
In order to explore the inconsistency between the planning and urban metabolism, this paper takes the example of the spatial metabolism of the terrain of Bengaluru and its divergence from the urban policies in the specific case of water supply. The first section looks at the urban planning theories and the outcome of their application in different regions and the second section discusses the methodology to capture the divergence between the planning and spatial dimension of metabolism. The third section discusses the metabolism of Bengaluru through different phases of urbanisation and processes of planning. The fourth section looks at the metabolism of city’s water supply system from different sources. The fifth section focuses on the cost of divergence by analysing the energy consumed in the distribution of water to the whole city and the final section concludes by discussing the guidelines for sustainable development and the importance of this study to the literature of urban metabolism.
2. Metabolism and development of urban planning theories
Cities are produced by nature and are shaped by numerous socioecological processes which in turn transform the natural metabolism of the region (Heynen et al. Citation2006). The interactions between these numerous processes are analysed using the concept of urban metabolism (Dinares Citation2014).Thus, in urban ecology, the concept of metabolism considers cities as ecosystems to understand the pattern of resource consumption, waste production, interaction with the peripheries and its implications on environment, and sustainability of urban areas (Pincetl et al. Citation2012; Mukherjee Citation2015). Resource consumption in urban areas is spatially heterogenic signifying the socio-economic and political differences where metabolic processes convert natural resources into commodities (Gandy Citation2004; Dinares Citation2014).
These metabolic processes and transformation of nature become more evident on urban terrain (Heynen et al. Citation2006). The word terrain is defined as a ‘stretch of land especially with regards to its physical features’ (Online Oxford Dictionary). However, as a concept, a terrain is multidisciplinary and has a wider application in the field of geology, hydrology, the political, social, and cultural fields, and particularly in military studies. The concept of terrain is ‘something that encompasses both the physical aspects of the earth’s surface and the human interaction with them’ (Doyle & Bennett Citation2002). Physical terrain shapes the social, political, and the economic processes which as they develop gradually transform all the natural elements of terrain. Water is one such natural element which gets transformed into a commodity supplied through a networked infrastructure (Gandy Citation2004; Dinares Citation2014). Urban metabolic flow of water essentially throws light on the social power relations and urban politics (Bakker Citation2003) which is a measure to judge the sustainability of the city (Swyngedouw Citation2006; Rapoport Citation2011).
Urban planning materialised as a discipline in the late nineteenth century under the city beautification movement in order to reintroduce nature in the cities (Gandy Citation2006). Industrial revolution in Europe and America gave birth to extremely crowded cities which were breeding places for many diseases (Freestone Citation2000; Hall Citation2014). This gave impetus to the development of twentieth-century planning models to mitigate the unsanitary conditions and provide a healthy environment under the Public Health Act of 1875 (Hebbert Citation1999; Hall Citation2014). Subsequently, suburbanisation developed along the transportation systems, which maintained highly cultured social and excellent design standards following Ebenezer Howard’s Garden city model, as observed in cities like Chicago, New York, and London (Hall Citation2014).
In the early twentieth century, these models influenced the town planning of the European colonial cities (Das Citation1981; Dossal Citation1989; King Citation1989; Drakakis-Smith Citation2000). The concept of master plans which emerged as a method to plan and manage the land use of the city was strongly influenced by the western elitist culture of segregation (King Citation1989; Drakakis-Smith Citation2000). In India, which was one of the European colonies, urban planning started as a remedy to the life-threatening diseases, particularly plague, in the major colonial port cities such as Bombay and Calcutta during 1896 and 1898, respectively (Dossal Citation2005; Shivaramakrishnan Citation2014). City Improvement Trusts were established in Bombay and Calcutta for spatial restructuring and suburbanisation through civic plans, which were completely designed and conceptualised on European interests (Das Citation1981; Dossal Citation1989), which never matched the mixed land use pattern of Indian cities (Prakasa Rao & Tewari Citation1986).
After independence, it was only during the third Five-Year Plan (1960–70) that the urbanisation was given attention (Das Citation1981; Ramachandran Citation1989; Shaw Citation1996). Delhi was the first city to delineate master plan in 1962 followed by Bombay in 1965, Calcutta in 1966, and Madras in 1976 (Ramachandran Citation1989; Karmakar Citation2015) while the other cities such as Hyderabad and Bangalore delineated their master plans only in 1975 and 1984, respectively, (Ravindra Citation1995; Rao ). 74th constitutional amendment act of 1992, during the eighth Five-Year Plan enabled the local municipalities for city planning and service provision (Ramachandran Citation1989; Batra Citation2009).
Jawaharlal Nehru National Urban Renewal Mission (JnNURM), launched in 2005, was one such national-level funding policy where billions of dollars were provided to the central government by the World Bank, Asian Development Bank (ADB), and International Monetary Fund (Banerjee-Guha Citation2009), to help urban local bodies develop world class infrastructure. The municipal corporations were ordered to prepare City Development Plans (CDP) and a 25 year vision document explaining the direction of development to be entitled to get the funding under this mission (Banerjee-Guha Citation2009). Such large scale debt-funded reforms were invariably designed for urban elite and to attract foreign investments, by beautifying the cities with various luxurious infrastructural facilities (Doshi Citation2015). Bengaluru is one such city which endured all phases of urban transformations right from the colonial period up to the present IT urbanisation, with explicit spatial metabolism in each phase. But the master plans of the city envisioned the development to happen in concentric circles (BDA website). The consequences of such developments are explored in this study by analysing the metabolic and urban planning processes of Bengaluru city by taking the specific example of the water supply system in the city.
3. Methodology
In order to capture the divergence between the spatial dimension of urban metabolism and planning, there is a need to use multiple methods. To comprehend the nature of the urban metabolism in Bengaluru, it is essential to understand the different phases of urbanisation that shaped the spatial growth of the city. Consecutively, to identify the spatial growth of the city, satellite imageries are used which provide a synoptic view of the region and the recent technology like geographic information system (GIS) is used to map the growth. Satellite images of 1973 and 1992 were downloaded from United States Geological Survey (USGS) website and the one from 2012 was obtained from National Remote Sensing Centre (NRSC), India. These years correspond with the different phases of industrialisation in Bangalore. The satellite image of 1973 is a multispectral scanner (MSS) image having four bands out of which three are optical bands and one is a near-infrared band. The Landsat 5 Thematic Mapper (TM) image of 1992 has 7 bands. The image from 2012, acquired from Indian Remote Sensing (IRS) Resourcesat 2 satellite has three optical and one near-infrared band. Band combinations of 4, 3, and 2 (i.e. near infrared, red, and green, respectively) were used to delineate urban built up area from all the three images. The terrain was mapped using Shuttle Radar Topographic Mission Digital Elevation Model (SRTM DEM), downloaded from USGS website. The study area is the extent of built up area as seen in the satellite image of 2012. The Comprehensive Development Plans (CDPs) were then overlaid to identify if they are consistent with the built up area. Water metabolism of Bangalore was analysed by taking three factors into consideration namely direct distance, elevation, and pipeline distance.
To understand the relationship between the direct distance, pipeline distance, elevation, and energy consumption, necessary data were procured from Bangalore Water Supply and Sewage Board (BWSSB). To calculate the direct distance and pipeline distance, relevant maps were collected from BWSSB. The maps were georeferenced and pipelines were digitised using the Quantum Geographical Information System (QGIS) software. Pipeline and direct distances were measured from T.K. Halli, the first pumping station, up to the centre of the subdivisions assuming uniform water supply. Along with the distance, the height to which the water has to be pumped also influences the quantity of energy consumption. Therefore, apart from the height (350 m) to which the transmission lines have to lift the water, internal pumping is required to manage the undulations within the city. Therefore, the heights of each of the GLRs and pump houses which supplied water to different areas were obtained from the SRTM DEM. Their location details were collected from BWSSB and located on the subdivision map. The energy consumed by the pumps to pump the required quantity of water gets recorded in the electricity bills as number of units per month. These readings were collected from respective BWSSB service stations. The quantity of water pumped from each pump was also collected from the service stations. The total water consumption in each subdivision, in million litres per month, was collected from BWSSB. Energy consumption was calculated separately in each subdivision by following the route of the water supply to each subdivision with the help of the pipeline network map. The number of pumps involved was also noted along with the particular stage which supplied water. Depending on the number of the pumps required to distribute the water within a subdivision, total quantity of energy consumed was calculated as number of units (1 unit = 1 kWh) per month. Using the data on total water consumed in 1 month in each subdivision, number of units/L/month was calculated.
4. Metabolism in practice: urbanisation in Bengaluru
Bengaluru is a rapidly growing city located in the state of Karnataka, on the Deccan Plateau of peninsular India, with the central latitude 12°59ʹ34.56ʺ and longitude 77°37ʹ34.95ʺ. Spatial metabolism of the city was shaped by three waves of urbanisation that happened during three phases of industrialisation. The first wave was experienced during the 1940s and 1950s when the public sectors were established giving spatial dimension to the growth of the city which had already extended outside the old fort of the city as a residential area.
Economic measures undertaken by the Indian government after independence emphasised industrialisation as the necessary condition for strong economic development. Bengaluru was already an industrial city with adequate experience in the establishment of state public sector industries. The previous experience in industrialisation and availability of skilled labour gave impetus to large scale entrepreneurships (Hettne Citation1978). As a result four major public sector industries were setup on the eastern and northern part of the city. The political and economic metabolisms demanded separate townships away from the city so as not to strain existing resources, since these industries were expected to generate ample job opportunities (Nair Citation2005). These townships were very well planned with housing, recreational, educational, shopping, and hospital facilities.
4.1. Public sector industries
Hindustan Aircraft Private Limited was the first public sector industry to be established in 1940 to the east of city. The area under Hindustan Aeronautics Limited (HAL) sanitary board was 27.53 sq km and HAL Township, also known as Vimananagar, occupied an area of 1.22 sq km (Census of India Citation1971; Heitzman Citation2004). Indian Telephone Industries (ITI) was the first major public sector industry to be established after independence in the year 1948 and the second in the city. Durvaninagar, the township of ITI was built in 1956 and spread over an area of 1.68 sq km (Census of India Citation1971). The third industry was Bharat Electronics Limited (BEL) in 1954. The township with the factory was located to the north west of the city near Jalahalli village and occupied an area of 2.85 sq km (Census of India Citation1971). Hindustan Machine Tools (HMT) was established by the Central government of India in 1955 under the heavy industries department and in collaboration with Oerlikons of Switzerland. Oerlikons chose Bengaluru because of the salubrious climate which was suitable for making machine tools and wrist watches (Heitzman Citation2004). The HMT watch factory was established in 1972. It was spread over an area of 2.59 sq km next to BEL (Census of India Citation1971). These developments led to ‘leapfrogging’ urbanisation by transforming the surrounding villages (Nair Citation2005). The spatial metabolism of the city shaped the development by filling the gap between the industries and the city while townships also expanded by further adding to the density. The social metabolism was more favourable to the middle class and attracted middle class migration (Nair Citation2005).
4.2. Garment industries
The second wave of urbanisation happened during the 1960s and 1970s when the small- and medium-scale industries were encouraged. Public sectors and big factories did not show any further growth, and there were no new establishments (Heitzman Citation2004). Subcontracting the manufacturing of components to small-scale industries was found more profitable than establishing big factories (Pani & Nikky Citation2012). In 1966, the state government passed the Karnataka Industrial Areas Development Act, under which the Karnataka Industrial Areas Development Board (KIADB) was constituted. The objective of KIADB was to acquire land from private owners, which were notified as industrial land, and develop industrial parks with the necessary infrastructure to be leased to the industrial organisations (Heitzman Citation2004).
Small-scale industries played an important role in the global economy encouraging entrepreneurs both from rural and urban areas. Among them, the garment industries alone provided almost 40% of the jobs in India (Rao et al. Citation2012). Bengaluru was known for its long-established textile industries right from its inception in the sixteenth century. During the nineteenth century, among all other industrial sectors, the textile industries showed a tendency towards readymade products (HettneB1978). Consequently, there was availability of low-cost labour and infrastructure in the city to export low-priced readymade garments when the Multi-fibre Arrangement (MFA) came to India in 1974 (Pani & Nikky Citation2012). The MFA was an agreement in which a fixed quota of readymade garment export, produced as per the standards set by major brands in the United States and Europe, was assured for the developing countries such as India, China, and many other South Asian countries (Chaudhary Citation2011). Bengaluru was one among the many cities which captured this market and contributed to the economy of the Karnataka state (Tewari Citation2005). This industry provided a great opportunity for both unskilled and semi-skilled workers from rural and urban parts of Bengaluru (Roy Chowdhury Citation2007). Thus, this industry became a significant part of the globalisation process along with the IT industries that swept the world during 1990s (Roy Chowdhury Citation2007).
KIADB established two industrial parks in the city, one in White Field and the other in Peenya. The Peenya industrial estate is located on the north western part of the city, covering an area of 1,485 acres and was at one time the largest industrial park in Asia (Sudhira et al. Citation2007; EMPRI Citation2008). Eventually, they were also established in other industrial areas at Bommanahalli and Bommasandra, located in the south, Yeshwantpur and Rajajinagar, located to the west of the city. A high concentration of garment industries can be seen in the western and south-western part of the city providing the spatial metabolism for the development.
The social metabolism constituted female employees as the major workforce of these industries who were generally from economically weaker section. The economic conditions of these labourers forced them to look for housing within walking distance of the factory, often occupying group housing constructed for the poor people (Pani & Nikky Citation2012). Such settlements came up in the vicinity of the garment factories which were contradictory to the planned townships of the public sectors. These industries and housing developed as part of the city (Nair Citation2005). Many cities observed rapid growth during this period as a result of migration of people in large numbers. Bengaluru experienced a growth rate of 76.2% during 1971–1981 (Ravindra Citation1995).
In order to manage the uncontrolled growth, the need for urban planning was envisaged. The former City Improvement Trust Board was reconstituted as Bangalore Development Authority in 1976 for proper planning and development of the city under the Karnataka Town and Country Planning Act of 1961. The first CDP was prepared in 1984 (Ravindra Citation1995). The growth exceeded the 500 sq km area provided under the CDP, and therefore the Bangalore Metropolitan Area was formed covering an area of 1279 sq Km as per the revised CDP of 1995 (Ravindra Citation1995). This included a core area of 565 sq km and a green belt area of 714 sq km (Heitzman Citation2004). These master plans were developed in concentric circles when the city had extended considerably towards the eastern and south-eastern direction due to the development of the IT sector during the 1990s.
4.3. IT sector development
During the second half of twentieth century, the world saw a major change in the technology with the invention of computer technology. International Business Machines (IBM) during 1960s was the largest company selling both hardware and software in the world. In 1972, Intel invented microprocessors which led to the manufacturing of mini and microcomputers (Parthasarathy Citation2004). This enabled the usage of computer in every economic sector along with a demand for software. When high-quality hardware was being produced, the quality and productivity of software suffered a setback. To overcome this, a large number of skilled software professionals were required. They were also required to maintain the older software (Parthasarathy Citation2004). This situation created a substantial demand for the software and skilled labour during the 1990s especially in developed countries, where there was a lack of workforce with the specific skills necessary. With the pressure to minimise the project expenditure, the firms in developed countries surveyed other places where the best combination of low cost, skilled, and educated labour was available. Based on this survey, India was selected both for on-site and offshore software development leaving behind China, Singapore, Mexico, Ireland, Philippines, Hungary, and Israel (Parthasarathy Citation2004).
The economic crisis in the 1980s resulted in a liberalisation of policy to grab the opportunities provided by the software industries. Thus, the ‘New Computer Policy’ of 1984, removed the restriction in the number of computers manufactured (Heitzman Citation2004). In 1986, another policy was formed on The Computer Software Export, Development and Training. These policies reduced the import duties on software and resulted in increased software production and exports (Parthasarathy Citation2004). They also encouraged foreign investment which helped the gross domestic product (GDP) growth of India to increase from 1.3% in 1991–1992 to 7.8% in 1996–1997 (Ahluwalia Citation2002) and also attracted many transnational and multinational companies (TNC and MNC) (Madon Citation1997; Bhatnagar Citation2006). Many software companies were established in India, in locations where there was availability of a large number of educated, skilled, low-cost labour, and infrastructural facilities.
This marked the third phase of urbanisation for Bengaluru city. Bengaluru was seen as one of the many cities which had the prospects of developing into the ‘Silicon Valley’ of India (Heitzman Citation2004). Policy reforms undertaken by the Indian and the Karnataka state government helped in the promotion and development of information technology in Bengaluru (Narayana Citation2008). Economic metabolism was favoured when information technology became the important economic sector of the city. The gross district income (GDI) increased from Rs 36.58 billion in 1980–1981 to Rs 250.42 billion in 2004–2005. The share of the information and communications technology (ICT) sector alone increased from 75% in 2000–2001 to 85% in 2005–2005 (Narayana Citation2008). With many leading IT firms eager to establish their offices in Bengaluru, the city came to be known as the ‘Silicon Valley of India’.
The department of medium and large industries of Government of Karnataka had planned to encourage the electronics industry by setting up the Karnataka State Electronics Development Corporation (KEONICS) as early as in 1976. The corporation jointly handled projects with Indian and foreign industries and supported private enterprises in marketing along with training facilities (Basant Citation2006). The corporation took the responsibility of establishing a new industrial estate popularly known as ‘Electronics City’ in 1977 which is 18 Km to the south-east of Bengaluru. The spatial metabolism of the master plan changed when 136 hectares of land, which formed part of the green belt, along Hosur road was granted by KIADB for the establishment of firms in Electronic City (Heitzman Citation2004). Electronic City expanded to a second and third phase in 1998–1999, with 114 and 98 hectares of land, respectively, granted by KIADB. Another IT park, International Technology Park Limited (ITPL), was opened in joint collaboration with KIADB in 1998. It is located in the Whitefield industrial area and is about 18 Km away to the east of the city (ITPB website). These establishments show a high concentration of IT industries in the eastern and south-eastern part of the city.
Economic metabolism of IT industries created a large number of jobs and hence attracted enormous workforce from within and outside the city. The growth rate reached 39.87% in 1991–2001 and 46.68% in 2001–2011. Though, a majority of the IT companies were located in the IT parks created in the eastern and south-eastern part of the city, many small companies also operated from residential houses (Nair Citation2005). IT industries also changed the fortune of the real estate business by attracting large developers from Mumbai and Delhi to build multi-storied apartments thereby demolishing many heritage buildings (Benjamin Citation2000). This increased the land prices in the city centre which relocated the poor and middle-income group to the peripheries of the city. The Karnataka Urban Infrastructure Development and Finance Corporation (KUIDFC) was established in 1993 under the companies act by the state government to mobilise funds for urban infrastructure projects and as a government’s interface for external lending agencies (KUIDFC website). These initiatives were mainly taken up to make Bengaluru a ‘Global competitor’ through mega-projects like IT parks focusing on modernising the city by urban renewal and design (Benjamin Citation2000). As the city was allowed to develop on the peripheries in order to decongest the centre, ring roads, peripheral roads, flyover, and underpasses became a part of urban development and planning (Benjamin Citation2000).
Social metabolism in the periphery of the city, where revenue layouts were formed for the poor- and middle-income group during the 1980s, became the hot spots for non-resident Indian (NRI) layouts, gated communities, and apartment blocks by the 1990s (Benjamin Citation2000). The city, already cosmopolitan by nature, attracted migrants and immigrants from different places seeking jobs in the IT firms. Indian immigrants from the United States and European countries also returned to cities like Bengaluru and Hyderabad (Chacko Citation2007). These highly skilled workers demanded high wages and well planned residential layouts with good infrastructure (Saritha Citation2005). As a result, several gated communities spurred on the periphery of Bengaluru. They have created not only social boundaries but also spatial boundaries which increased the number of slums in Bengaluru (Benjamin Citation2000). The spatial metabolism of the city developed contiguously towards the east and south-east leading to peri-urbanisation.
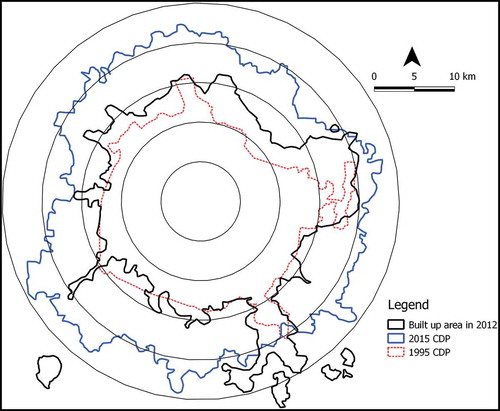
Peri-urbanisation transformed agricultural lands into residential, commercial, and industrial sites. But being outside the municipal boundaries, these areas lacked basic facilities such as piped water supply except for electricity connection (Shaw Citation2005). Conversely, such developments degraded the natural resources resulting in groundwater depletion, air and water pollution, and deforestation (Shaw Citation2005). The environmental problems due to increased resource consumption have resulted in Bengaluru becoming a member of the Urban Environment Forum along with other major cities of India under the Sustainable City Programme (Mahadevia Citation2004). Since these programmes were externally funded, development projects which assured profits were given more importance than providing the basic services to the poor in order to repay the debt (Mahadevia Citation2004). While these politico-economic metabolisms directed spatial metabolism in a certain direction of the city, the authorities prepared CDP’s in concentric circles following the Chicago School’s city growth concept (). The ‘uneven development’ (Smith Citation1984) towards the south was balanced by the state government by pushing growth towards north, though it was not sustainable. The following section discusses the consequences of such development by taking the example of the surface water supply system in Bengaluru.
Figure 1. Boundary of Comprehensive Development Plan compared with the built up area from 2012 satellite image.
5. Metabolism of water in Bengaluru
Bengaluru region is endowed with an undulating terrain formed by two major ridges running North–North East and South–South West. These ridges divide the region into four main valleys namely, Hebbal valley in the north, Vrishabhavathi valley in the west, and Koramangala and Chellaghatta valley in the east (). There are five minor valleys within these major valleys (BWSSB Citation2013). While the northern and the eastern valleys present gentle slopes, the southern and western valleys are very rugged in nature. The natural drainage in the north is from north west to south east and flows to join the South Pinakini River in the east. In the south, the eastern part of the ridge flows to the South Pinakini River and the western part to the Arkavati River which joins Cauvery River in the south. The natural drainage system of the terrain was used for the construction of lakes and tanks. Bunds were constructed along the slopes to impound rainwater and were connected when the water over flowed from a higher tank to the lower ones in a cascading form. These small reservoirs provided the water supply for drinking, agriculture, and other activities of the villages (D’Souza & Nagendra Citation2011). Thus, the barren undulating terrain attracted earlier settlements, which was appropriate for the construction of tanks and lakes. These tanks rejuvenated the groundwater table of the region. The city does not have any perennial river flowing in close proximity like most of the other cities (Mehta et al. Citation2013).
Figure 2. Terrain of Bengaluru with valley system.
This terrain played an important role in the development of the city all the way back in the sixteenth and the seventeenth century. The earliest phase of urbanisation happened when Kempegowda, the founder of the city, selected an elevated area of the terrain for locating his fortress town. Undulations of the terrain helped in the construction of four watch towers on further elevated points to get an early warning about rivals (Pani et al. Citation2010). The water supply to the city was predominantly by means of tanks and lakes. Thus, the terrain remained undisturbed until the second phase of urbanisation which happened when the British established cantonment in nineteenth century. The British settled in the east isolated from the old city. British introduced industries and as a result, mainly textile mills were established in the city. The small town developed as an industrial town and the labourers migrated to the city from different places in search of jobs (Heitzman Citation1999).
Unhealthy conditions of the city within the fort culminated in the outbreak of plague in 1898, pressurising the development of extensions outside the fort. Thus, the growth of the city demanded more water and the tanks were found unsuitable for drinking purposes. The metabolism of water transformed when the British felt the need to get a secured piped water supply by tapping water from a perennial water source (Nair Citation2005). The closest and the most viable ways were to get water supply from the River Arkavathi by constructing a reservoir (Chamarajendra reservoir) at Hesaraghatta in 1896. This reservoir was situated about 18 km away in the north-western direction and was 131 m below the city level. Water supply was drawn for the old city of Bengaluru as well as for the Civil and Military Station from this reservoir (Mysore Gazetteer Citation1930). After a few years, another reservoir was built at Tippagondanahalli (T.G. Halli) across the same river Arkavathi in 1926 to meet the increased demand for water. This reservoir was 35 km away to the west and 200 m below the city level. Pumping was done in two stages, once at T.G. Halli and again at Tavarekere. Both the reservoirs supplied water to the whole city. Most of the lakes by this period were either polluted or dried up which made way for residential or commercial layouts later (Jamwal Citation2012).
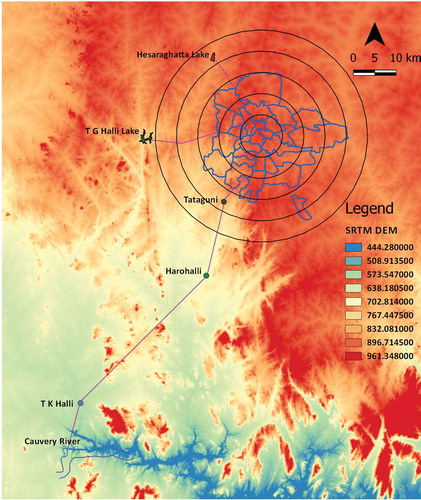
Public sector industries established during the 1950s had their own townships with all the facilities needed (Dittrich Citation2007) but water was supplied to these industries from the T.G. Halli reservoir (Narayana Swamy Citation1977). The HAL and ITI region on the east was supplied with 1030 ML of water and the BEL and HMT region in the north was supplied with 890 ML of water. The consumption was higher in the east. The ancillary industries that were established in the western part of the city during the 1970s and 80s caused additional pressure on the T.G. Halli water supply system. As the water supplied from both the reservoirs could not quench the thirst of city’s population, the authorities were pressurised to search for an alternative source that could provide a permanent solution for water scarcity. In due course, it was decided to tap River Cauvery which flows at a distance of 98 Km to the south of the city at a depth of 350 m (). In 1964, the BWSSB, a parastatal authority, came into existence to manage the Cauvery water supply and sewerage system which was under the control of Municipal Corporation until then.
Figure 3. Water sources shifting away from the city.
5.1. Surface water supply from River Cauvery
The metabolism of water supply took a turn since River Cauvery flows at a depth of 350 m below the city level, and it was required to pump the water at three stages from three major pumping stations located at Toraikadanahalli (T.K. Halli), Harohalli and Tataguni. presents the details of the pumps in the three pumping stations. BWSSB has divided its whole jurisdiction into 28 subdivisions at present (). The water is drawn in four stages and each stage is commissioned to augment the water supply to the city. Each stage has its own set of pumps and network of pipelines which supplies water to different parts of the city. After the initiation in 1969, stage 1 was commissioned in the year 1974 which supplied 135 MLD (million litres per day) of water to southern subdivisions. This supply was augmented by stage 2 in 1983, which distributed an additional 135 MLD of water to the same subdivisions that stage 1 supplied. Around this time, the water supply from Hesaraghatta and Tippagondanahalli had completely stopped due to rapid urbanisation in the Arkavathi river basin (Mohan Kumar et al. Citation2011; Lele et al. Citation2013). Therefore Stage 3 was commissioned in the year 1993 which supplies 270 MLD of water to the central part of the city.
Table 1. Details of water supply to each subdivision.
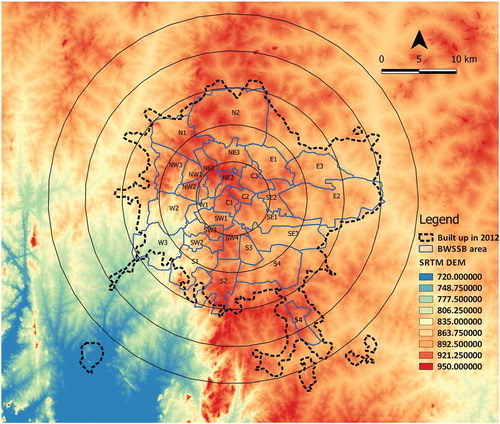
Figure 4. Subdivisions of BWSSB jurisdiction overlaid on SRTM DEM.
The 74th Constitutional Amendment act gave more power to Urban Local Bodies (ULB) to improve the water supply system (Hoque Citation2012). The India Infrastructure Report of 1996 introduced private public partnership (PPP) by privatising the public infrastructure projects (Gopakumar Citation2012). During the year 2000, the 10th Five-Year Plan regarded water supply as a profitable asset rather than a free commodity available to everyone (Hoque Citation2012). The 11th Five-Year Plan estimated a cost of Rs 54,000 crore to supply water to all urban cities in India. Many states including Karnataka opted for external funding particularly from agencies like World Bank, United States Agency for International Development (USAID) and ADB (Ranganathan et al. Citation2009). The ‘market-based’ reforms thus undertaken in the water sector, initiated Greater Bengaluru Water and Sanitation Project (GBWASP) in 1998, to supply Cauvery water to the peripheral areas. In 2003, the Indo-USAID’s Financial Institutions Reform and Expansion-Debt (FIRE-D) provided the financing structure for GBWASP (Ranganathan et al. Citation2009).
The spatial metabolism of the city on the peripheries expanded during the last decade (Benjamin Citation2000; Keivani & Mattingly Citation2007) following the IT boom and rapid real estate development. Consequently Bengaluru City Corporation extended its jurisdiction to form Greater Bengaluru or Bruhat Bengaluru Mahanagara Palike (BBMP). This boundary included seven municipal corporations, one town municipal council and 110 villages in 2007 (Sastry Citation2008). BWSSB was laying new pipe lines to provide water and sanitation to these peripheral areas under GBWASP (Ranganathan et al. Citation2009). To cater to most parts of the city under BBMP jurisdiction, BWSSB also reorganised its boundary to form 28 subdivisions (). To supply Cauvery water to these peripheral areas, Stage 4 was commissioned in two phases. Phase 1 supply started in 2002 with 270 MLD of water and was augmented by another 100 MLD in 2008. This phase currently supplies water to the north western and south-eastern subdivisions. In 2012, phase 2 was commissioned and around 500 MLD is supplied to northern and eastern subdivisions (BWSSB Citation2013).
Bengaluru city is witnessing major real estate developments and is the home for nearly 2000 IT and 200 Bio-tech companies (iDeck Citation2010). Earlier these companies were concentrated close to Whitefield and Electronic city areas of the city (iDeck Citation2010). However, at present, there are many new real estate proposals near the International airport in Devanahalli in the northern peripheries. Along with IT industries, the periphery was dotted with unauthorised revenue layouts, villages and slums. Highly diverse land use and disorganised development in the peripheral areas has hampered the GBWASP project to come through as it was envisaged (Ranganathan et al. Citation2009). The initial charge for the water supply was very high for the bulk of peripheral residents and was therefore later revised as per their plot sizes. Soon after, the charges were waived off for the poor by the Karnataka government. In spite of many such measures taken, the water supply was highly uneven due to huge demand by the IT companies and apartment buildings that have come up in these areas (Ranganathan et al. Citation2009). Urbanisation has increased water consumption due to the lifestyle of people and usage of commodities (Domene Citation2014) demanding augmented water supply. These developments in the periphery of the city are of great concern due to the shortage of groundwater availability which is currently tapped at 1000–1200 ft below the ground level (Nilekani Citation2014).
In spite of the Herculean task taken by the government to supply piped water supply to the whole city, the bulk of the areas are still dependent on groundwater supply. The groundwater conditions show over exploitation (CGWB Citation2013) which makes the city to depend entirely on surface water supply from River Cauvery. The inability to get water connections has made the poor people to depend completely on groundwater supplied by bore wells and tankers. The ‘water mafia’ has thus exerted greater pressure on groundwater (Ranganathan et al. Citation2009). It is estimated that nearly 30–40% of the population depends on groundwater (CGWB Citation2013). Some wealthier groups buy bottled water as a measure of safety. Thus, urban metabolism has converted natural material like water into a packaged commodity in the due course of its journey (Cronon Citation1992). Destruction of tanks has also added to groundwater depletion and impossibility of rejuvenation. Thus, the transformations in the political, social, and economic metabolisms have rendered the physical terrain to be a barrier for water supply. The earlier undulating terrain which was congenial for the creation of local water supply by means of tanks has become an impediment for pumping water from distant sources. Consequently, water supply now involves pipelines and pumping system using electrical energy to enable the water to travel longer routes.
5.2. The route of water supply and pumping
BWSSB distributes Cauvery water to the whole city using the total quantity of water from all the four stages. The water is supplied to all the 28 subdivisions by a network of ground-level reservoirs (GLR) and pumping stations. The major GLRs are located at an average height of 934 m from T.K. Halli and store the water pumped from Tataguni. In addition, there are 50 pump houses and 55 GLRs within the BWSSB jurisdiction which help in the distribution of water to all the areas. They are maintained by service stations. Though there is a controlled supply to these GLRs from specific Cauvery stages, they are also interconnected and water can be transferred from one GLR to another (Mohan Kumar et al. Citation2011). Water is then distributed by gravity to the low lying areas and is pumped to higher altitudes, due to undulations in the terrain. Details of the water supply from each stage to different subdivisions are given in .
The routes of every stage, in effect, are travelling farther and farther from the source. Thus, electrical energy has become very essential for the piped water supply, starting from the transmission of water from the source up to the distribution of water (Gleik Citation1994; Kahrl & Holst Citation2008). Studies have shown that a significant amount of energy is required to lift the water from the source and pump to long distances (Shrestha Citation2010). The energy consumption varies with the distance to which the water is supplied. Here it is necessary to consider two types of distances; one is the direct distance or the Euclidean distance (as the crow flies) and the other is pipeline distance. Pipeline distance depends on terrain conditions, and therefore may be longer than the direct distance. As a result, though some subdivisions are closer to the water source, they may have longer pipelines due to terrain conditions. Urbanisation has thus introduced three new elements in the water supply system, namely, direct distance from the source, elevation, and pipeline distance. The flow chart in gives the details of pumping.
Figure 5. The details of pumping to different subdivisions of BWSSB.
6. Analysis of the divergence
The quantity of energy consumed varied between subdivisions. To understand this variation pattern spatially, subdivision level energy consumption map was prepared using QGIS software (). The general pattern observed is that the central, north-eastern, and southern subdivisions consume less energy compared to the peripheral subdivisions. These subdivisions are supplied by stage 1, 2, and 3 pumps which are old and are not as efficient as the stage 4 pumps and yet the energy consumed is less. The peripheral subdivisions which are supplied by the stage 4 pumps seem to consume more energy. This variation in energy consumption can be explained by the way pipelines are provided and the elevation of different areas. Pipelines generally cover longer distances due to terrain conditions than the direct distance. The minimum difference between pipeline distance and direct distance ensures the efficiency of providing the pipeline. To verify, this routing was calculated which is the difference between pipeline distance and the direct distance (referred as distance from here onwards), and expressed as a proportion of distance in percentage. It is noticed here that the variation in energy consumption may be because of differences in routing, the distance and elevation between the subdivisions from the source. Each of these elements has a significant role in energy consumption.
Figure 6. The spatial pattern of energy consumption in BWSSB subdivisions.
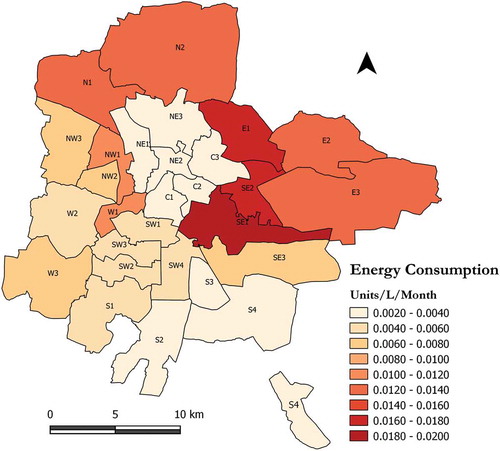
6.1. Distance
As mentioned earlier, the distance was measured from T.K. Halli to the centre of each of the subdivision. The southern subdivisions, namely S1, S2, S3, and S4, and W3 are located closest to the pumping station and the distance ranged from 65 to 70 Km. South western, western, and SE3 subdivisions are located at a range of 70–75 Km. North western, Central, SE1, SE2, and N2 subdivisions are 75–80 Km away from T.K. Halli. Farthest are the eastern and N1 subdivisions which are about 85 Km away from T.K. Halli.
If pumping for long distances alone was the reason for higher energy consumption, the pattern in the map should have displayed highest energy consumption in the northern and eastern subdivisions. Central subdivisions should have consumed lesser energy and the least should have been in the southern subdivisions. Since the pattern is different, it is perhaps the routing that is the more significant factor in the energy consumption.
6.2. Routing
The routing for the central and north-eastern subdivisions, which consume least energy, is just 10–12% more than the direct distance from the source. Routing for the south-western subdivisions is 10–17% more than the distance. These subdivisions get water supply from Cauvery stage 1, 2, and 3. The pumps are old and less efficient. For the southern subdivisions particularly S2, S3, and S4, the routing is 12–17% more than the distance. This percentage increases as we move towards the western, north western, and SE3 subdivisions to 15–20%. The routing for the northern and eastern subdivisions is 20– 30% more. SE1, SE2, and E1 subdivisions have routing which is nearly 35–40% more than the distance since they are supplied by stage 3 and stage 4. Though the central and north-eastern subdivisions are far away from the source, the efficiency of routing has reduced the energy consumption as in the south-western and southern subdivisions.
6.3. Elevation
The elevation of the GLRs, on the other hand, has perhaps minimised the energy consumption. This is evident in the central and north-eastern subdivisions where energy consumption is very low. The high grounds reservoir (HGR) located in C2 and Crown Jewel Filter (CJF) reservoir located in NE1 are at 937 m and 940 m from the mean sea level, respectively. They store the water from the stage 3 pumping and supply by gravity to a large part of the central and north-eastern subdivisions. Similarly, GLRs at Kothnurdinne and Jambusavaridinne in S2 stand at a height of 936 m and 941 m from the mean sea level, respectively. Even here, Kothnurdinne GLR supplies the water by gravity to S2, S3, and S4 subdivisions, whereas the water from the Jambusavaridinne GLR travels up to E3 subdivision by gravity. The energy consumption in these subdivisions is between 0.002 and 0.004 units/L/month.
Out of all the three elements, the routing appears to be the most significant factor in increasing energy consumption. To estimate the relationship between these three elements or independent variables namely, distance, routing, and elevation, and the dependent variable, energy consumption, regression analysis was carried out. Regression was fitted for totally 40 observations, since some of the subdivisions were supplied by two or three stages of water and the route for each stage was separate. From the regression results it was observed that the standardised coefficients for the variables namely the routing, distance, and the elevation are 0.619, 0.482, and −0.127, and the significance levels are 0.000, 0.001, and 0.326, respectively. The adjusted R2 is 0.555.
The p value for the routing is significant at 99% which also supports the earlier argument, as the prime factor in increasing the energy consumption. As a result SE1, SE2, and E1 subdivisions show highest energy consumption though not far from the source. The distance is significant at 95% which is the second factor in energy consumption. Thus, the subdivisions N1, N2, E2, and E3 consume relatively less energy than the south-eastern subdivisions. Conversely, the elevation is not significant in influencing the energy consumption as implied by its negative sign. This indicates that it may be energy efficient to pump the water to a higher level and supply by gravity as observed in the central, north eastern, and southern subdivisions. Here, the GLRs are located at highest elevation (). The terrain of the peri-urban areas is predominantly at lower elevations. These are manmade impediments since the routes have to travel long distances resulting in higher energy consumption.
6.4. Cost of divergence
Variations seen in the energy consumption strike a chord with the cost of water supply which is standardised currently. The cost of water supply in Bengaluru was always higher than the other cities (Fazlul Citation1970; Nilekani Citation2014). Presently, the minimum price per KL is Rs 7, whereas the actual cost of production and delivering water is around Rs 32 (BWSSB). This is probably higher than the other cities like Mumbai, Delhi, and Chennai where the minimum prices are Rs 4.50, Rs 2.42, and Rs 2.50 per KL of water, respectively. Currently, the quantity of water supplied is 125 L per capita per day (LPCD) but as per the national standards it should be 150 LPCD. As per this standard, BWSSB has to expend more money to supply water to the northern areas for a family of 5, whereas it will be cheaper to the areas located in the southern end. Though, there is enormous difference in the money spent for supplying water to the two extreme ends of the city, the public is charged with a highly subsidised rate of Rs 7/KL across all the subdivisions currently. Any hike in the cost is borne by one and all irrespective of their localities. As an alternative, subdivision wise pricing would probably allow the public to settle as per their choice. Such policies would perhaps help in the sustainable growth of the city and reduce the gap between urban metabolic processes and planning theories.
7. Conclusion
The spatial metabolism of the city was the outcome of socio-economic and political metabolisms which influenced the location of industries in all the three phases of the urbanisation. The public sector industries demanded isolated townships in order to have well planned towns of their own. In garment sector phase, the industries developed contiguously owing to the economic conditions of the workers. During the IT phase, the elite demanded their own enclosed space outside the clutter of the city with various services since the city was deprived of proper facilities. The spatial metabolism during this period was more dominating compared to the other two phases. The socio-economic and the political processes in each phase have steered the city in a particular direction while the planners still prepared the master plans envisaging the city to develop in concentric circles and as per land use zoning. These policies have made the cost of development very expensive which is explicit in the inefficient water supply system. The inconsistency between the planning policies and the metabolic processes has made both the water production and supply overpriced. This can probably be reduced by understanding the terrain of the region, availability of natural resources, and the direction of the growth of the city. Thus, the application of urban metabolism framework in urban planning may help in improved policy decisions which are crucial currently. Findings of this research enable us to understand the significance of the spatial dimension of urban metabolism which may be situated in the larger theoretical framework of urban metabolism where the interaction between the human beings, natural and the built environment, and the physical flows are inherent.
Disclosure statement
No potential conflict of interest was reported by the author.
Additional information
Notes on contributors
N.S. Nalini
N.S. Nalini is a researcher at National Institute of Advanced Studies, Bangalore, Karnataka, India. Her interests lie in understanding the relationship between terrain and urbanisation.
Related Research Data
References
- Ahluwalia MS. 2002. Economic reforms in India since 1991: has gradualism worked? J Econ Perspect. 16:67–88.
- Bai X. 2007. Integrating global environmental concerns into urban management: the scale and readiness arguments. J Ind Ecol. 11:15–29.
- Bakker KJ. 2003. A political ecology of water privatization. Stud Polit Econ. 70:35–58.
- BDA CDP. [cited 2015 Oct 8]. Available from: http://www.bdabangalore.org/brochure.pdf
- [BWSSB] Bangalore Water Supply and Sewage Board. 2013. Information on valley system and water from different stages; [cited 2014 Mar 10]. Available from: http://bwssb.org/sewerage-system/& http://bwssb.org/mission-history/
- Banerjee-Guha S. 2009. Neoliberalising the ‘Urban’: new geographies of power and injustice in Indian cities. EPW. 44:95–107.
- Batra L. 2009. A review of urbanisation and urban policy in post-independent India. Working Paper Series. New Delhi: Jawaharlal Nehru University; p. 5–30
- Basant R. 2006. Bangalore cluster: evolution, growth and challenges. IIMA Working Papers. Ahmedabad: Indian Institute of Management.
- Benjamin S. 2000. Governance, economic settings and poverty in Bangalore. Environ Urban. 12:35–56.
- Bhatnagar S. 2006. India’s software industry. In: Chandra V, editor. technology, adaptation, and exports: how some developing countries got it right. Washington (DC): World Bank; p. 95–124.
- [CGWB] Central Ground Water Board. 2013. Ground water booklet: Bangalore urban district: a report for Ministry of Water Resources. Bangalore: CGWB.
- Census of India. 1971. Primary census abstract- general population. New Delhi: Ministry of Home Affairs, Government of India.
- Chaudhary A. 2011. Changing structure of Indian textiles industry after MFA (multi fiber agreement) phase out: a global perspective. Far J Psychol Business. 2:22.
- Chacko E. 2007. From brain drain to brain gain: reverse migration to Bangalore and Hyderabad, India’s globalizing high tech cities. Geo J. 68:131–140.
- Chrysoulakis N, Lopes M, San José R, Grimmond CSB, Jones MB, Magliulo V, Klostermann JEM, Synnefa A, Mitraka Z, Castro EA, et al. 2013. Sustainable urban metabolism as a link between bio-physical sciences and urban planning: the BRIDGE project. Landsc Urban Plan. 112:100–117.
- Cronon W. 1992. Nature’s metropolis: Chicago and the great west. New York: WW Norton & Company.
- Das B. 1981. Urban planning in India. Soc Scientist. 9:53–67.
- Dinares M. 2014. Urban metabolism: a review of recent literature on the subject. Documents d’Analisi Geographica. 60:551–571.
- Dittrich C. 2007. Bangalore: globalisation and fragmentation in India’s high tech-capital. Asien. 103:45–58.
- Domene E. 2014. Changing patterns of water consumption in the suburban Barcelona: lifestiles and welfare as explanatory factors. Investigaciones Geographicas, enero junu de. 61:39–53.
- Doshi S. 2015. Rethinking gentrification in India: displacement, dispossession and the specter of development. In: Lees L, Shin HB, Lopez-Morales E, editors. Global gentrifications: uneven development and displacement. Bristol: Policy Press; p. 101–120.
- Dossal M. 1989. Limits of colonial urban planning: a study of mid‐nineteenth century Bombay. Int J Urban Reg Res. 13:19–31.
- Dossal M. 2005. A master plan for the city: looking at the past. EPW. 40:3897–3900.
- Doyle P, Bennett MR, editors. 2002. Terrain in military history: an introduction. In: Fields of battle: terrain in military history. Dordrecht: Springer Science and Business Media; p. 1–7.
- D’Souza R, Nagendra H. 2011. Changes in public commons as a consequence of urbanization: the Agara lake in Bangalore, India. Environ Manage. 47:840–850.
- Drakakis-Smith DW. 2000. Third world cities. London: Routledge.
- EMPRI. 2008. Environmental database for Peenya industrial area: complimentary project report. Bangalore: Environmental Management and Policy Research Institute.
- Freestone R. 2000. Urban planning in a changing world: the twentieth century experience. London: Taylor & Francis; p. 8.
- Gandy M. 2004. Rethinking urban metabolism. City. 8:363–379. Carfax publishing.
- Gandy M. 2006. Urban nature and the ecological imaginary. In: Heynen N, Kaika M, Swyngedouw E, editors. In the nature of cities: urban political ecology and the politics of urban metabolism. London: Routledge; p. 62–72.
- Gleik. PH. 1994. Water and energy. Annu Rev Energy Environ. 19:267–299.
- Gopakumar G, editor. 2012. Studying water reform in India. In: Transforming urban water supplies in India: the role of reform and partnerships in globalization. London: Routledge; p. 9–10.
- Fazlul HM. 1970. Bangalore through the Centuries, Vol. 11. Historical Publications; p. 124.
- Hall P. 2014. Cities of tomorrow: an intellectual history of urban planning and design since 1880. West Sussex: John Wiley & Sons; p. 151–201.
- Hebbert M. 1999. A city in good shape: town planning and public health. Town Plann Rev. 70:433.
- Heitzman J. 1999. corporate strategy and planning in the science city: Bangalore as’ silicon valley. EPW. 34:2–11.
- Heitzman J. 2004. Network city: planning the information society in Bangalore. New Delhi: Oxford University Press.
- Hettne B. 1978. The political economy of indirect rule: Mysore 1881-1947. New Delhi: Ambika publications. Part III, Industrialize or Perish: Growth of a development strategy; 312.
- Heynen N, Kaika M, Swyngedouw E. 2006. Urban political ecology: politicizing the production of urban natures. In: Heynen N, Kaika M, Swyngedouw E, editors. In the nature of cities: urban political ecology and the politics of urban metabolism. London: Routledge; p. 1–15.
- Hoque SF. 2012. Urban water sector reforms in india: financing infrastructure development through market–based financing and private–public partnerships. Lee Kuan Yew School of Public Policy Research Paper No. LKYSPP, 12-05, Singapore.
- iDeck. 2010 Jun. Study of development potential around Bangalore International Airport. Bangalore: Report submitted to Infrastructure Development Department.
- [ITPB] International Tech Park Bangalore. [cited 2016 Feb 14]. Available from: http://www.itpbangalore.com/about_history.html
- Jamwal N. 2012. Mumbai under floods: a natural disaster or manifestation of an underlying conflict in Mumbai City’s skewed urban planning. In: Prasad Eklavya KJ, Joy SP, Vispute S, editors. Agony of floods: flood induced water conflicts in India. Pune: Forum for Policy Dialogue on Water Conflicts in India; p. 90–100.
- Kahrl F, Holst DR. 2008. China’s water energy Nexus. Water Policy. 10:1–16.
- Karmakar J. 2015. Retrospect of post-colonial metropolitan planning in India: critical appraisal. JGRP. 8:166–173.
- Keivani R, Mattingly M. 2007. The interface of globalization and peripheral land in the cities of the south: implications for urban governance and local economic development. Int J Urban Reg Res. 31:459–474.
- Kennedy C, Pincetl S, Bunje P. 2010. The study of urban metabolism and its applications to urban planning and design, Environ Pollut. 30:1–9.
- King AD. 1989. Colonialism, urbanism and the capitalist world economy. Int J Urban Reg Res. 13:1–18.
- [KUIDFC] Karnataka Urban Infrastructure Development and Finance Corporation. [cited 2015 May 16]. Available from: http://www.uddkar.gov.in/KUIDFC
- Lele S, Srinivasan V, Jamwal P, Thomas BK, Eswar M, Zuhail TM. 2013. Water management in Arkavathy basin: a situation analysis. Environment and Development. Discussion Paper No.1. Bengaluru: Ashoka Trust for Research in Ecology and the Environment.
- Madon S. 1997. Information-based global economy and socioeconomic development: the case of Bangalore. Inf Society Int J. 13:227–244.
- Mahadevia D. 2004. Sustainable urban development in India: an inclusive perspective. In: Westendorff D, editor. Unsustainable to inclusive cities. Geneva: United Nations Research Institute for Social Development; p. 57–85.
- Mehta VK, Shekar M, Malghan D. 2013. Groundwater impacts of water consumption patterns in Bengaluru, India. JGWR. 2, Published by AGGS, India:143–154.
- Mohan Kumar MS, Manohar U, D’Souza CD, Jamwal P, Sekhar M. 2011. Urban water supply and management: a case study of Bangalore city, India. In: Das S, editor. Bengaluru-Water Problems of the Fastest Growing City of India. Bangalore: Geological Society of India; p. 50–76.
- Mukherjee J. 2015. Beyond the urban: rethinking urban ecology using Kolkata as a case study. IJUSD. 7:131–146.
- Nair J. 2005. The promise of the metropolis: Bangalore’s twentieth century. Delhi: Oxford University Press.
- Nilekani N, 2014 Blog. [cited 2015 Oct 22]. Available from: http://www.nandannilekani.in/en/blog/26-managing-the-water-crisis-in-bengaluru
- Narayana MR. 2008. Globalization and urban growth: evidence for Bangalore (India). CIRJE F-544, CIRJE. Tokyo: University of Tokyo.
- Narayana Swamy K. 1977. Water to Bangalore. Bangalore: Maruthi Prakashana publications; p. 6–7.
- Pani N, Radhakrishna S, Bhat GK. 2010. Bengaluru, Bangalore, Bengaluru: imaginations and their times. Bangalore: Sage Publications India Pvt. Ltd.
- Pani N, Nikky S. 2012. Women at the threshold of globalization. New Delhi: Routledge; ISBN: 978-0-415-52298-4, p. 1–15.
- Parthasarathy B. 2004. India’s silicon valley or silicon valley’s India? Socially embedding the computer software industry in Bangalore. Int J Urban Reg Res. 28:664–685.
- Pincetl S, Bunje P, Holmes T. 2012. An expanded urban metabolism method: toward a systems approach for assessing urban energy processes and causes. Landsc Urban Plan. 107:193–202.
- Prakasa Rao VLS, Tewari VK 1986. Ecological structure of Bangalore city. In: Tewari VK, Weinstein JA, Prakasa Rao VL S, editors. Indian cities ecological perspectives. New Delhi: Concept Publishing Company, New Delhi; p. 221–222.
- Saritha R. 2005. Dec 26. Indians find they can go home Aagain. The New York Times, Business Day.
- Ramachandran R. 1989. Urbanisation and urban systems in India. Oxford: University Press; p. 323–340.
- Ranganathan M, Kamath L, Baindur V. 2009. Piped water supply to greater Bangalore: putting the cart before the horse? EPW. 44:53–62.
- Rao C.H. editor. 1930. Mysore Gazetteer, Vol. 5. Bangalore: The Government Press; p. 114–130.
- Rao N. 2008. Cities in transition: growth, change and governance in six metropolitan areas. London: Routledge; p. 125.
- Rao V, Venkatachalm A, Joshi HG. 2012. Challenges faced by women entrepreneurs running micro, small and medium scale fashion and apparel business: a study on fashion and apparel enterprises in coastal Karnataka. International Conference on Trade, Tourism and Management (ICTTM’2012); Dec 21–22, Bangkok (Thailand).
- Rapoport E. 2011. Interdisciplinary perspective on urban metabolism: a review of the literature. UCL Environmental Institute working paper. London: Development Planning Unit, UCL.
- Ravindra A. 1995. Metropolitan Bangalore: a management perspective. Kolkata: Times Research Foundation.
- Roy Chowdhury S. 2007. Informality in globalised forms of production. TIJLE. 50:765–774.
- Sastry GS. 2008. emerging development issues of greater Bangalore. ISEC working paper.
- Shaw A. 1996. Urban policy in post-independent India: an appraisal. EPW. 31:224–228.
- Shaw A. 2005. Peri-urban interface of Indian cities: growth, governance and local initiatives. EPW. 40:129–136.
- Shivaramakrishnan KC. 2014. Governance of megacities: fractured thinking, fragmented setup. New Delhi: Oxford University Press.
- Shrestha E. 2010. Evaluating the energy and carbon footprint of water conveyance system and future water supply options for Las Vegas, Nevada [PhD thesis]. Las Vegas: University of Nevada
- Sudhira HS, Ramachandra TV, Subrahmanya MH. 2007. Bangalore. Cities. 24:379–390.
- Smith N. 1984. Uneven development: nature, capital, and the production of space. Athens: The University of Georgia Press; p. 198–199.
- Swyngedouw E. 2006. Metabolic urbanisation: the making of the cyborg cities. In: Heynen N, Kaika M, Swyngedouw E, editors. In the nature of cities: urban political ecology and the politics of urban metabolism. London: Routledge; p. 20–39.
- Tewari M. 2005. Post-MFA adjustments in India’s textile and apparel industry: emerging issues and trends. ICRIER, WP 167.