
 ?Mathematical formulae have been encoded as MathML and are displayed in this HTML version using MathJax in order to improve their display. Uncheck the box to turn MathJax off. This feature requires Javascript. Click on a formula to zoom.
ABSTRACT
Measuring and comparing sustainable development levels of cities are essential procedures in creating and maintaining sustainable urban futures. This paper introduces a new urban sustainability assessment model: The Live-and-Work (LaW) City Index. It intends to enumerate/evaluate all targeted individual indicators in a simple, comprehensive manner, where all could be overseen solely, thus tracking their progress towards targeted values, assisting policymakers by providing an interpreted integrated sustainability assessment framework. The model incorporated all related domains affecting urban sustainable development; in a method that is further extended to gauge and rank cities’ performance. A functional form of aggregated indicators is derived to compute the overall index, illustrated in the form of a pie/radar chart. For proofing and calibrating the effectiveness and reliability of the model, it has been applied to three different cities. The results have shown that the model has the communicative advantage in comparative levels of different values.
1. Introduction
With population growth and urban migration occurring at a faster rate than ever before, cities are becoming among the great forces of change upon the well-being of humans and ecosystems alike. The urban world majority trend is intensifying and thus the criterion of sustainable development is crucial to maintain the suitability of life in cities (Hardi and Zdan Citation1997; Beaumont Citation2014).
Sustainable development assessment is an intensive data collection procedure that facilitates the auditing process of cities towards sustainable development trends. It is crucial for both communication and operation purposes. Most cities lack common, clear and objective baselines against which to measure progress (Atkinson et al. Citation1997). An objective study is needed where these cities could be ranked against others, according to a broad range of criteria to measure their current and future progress (Beaumont Citation2014).
Sustainable development indices are increasingly being recognised as essential tools for evaluation, implementation and follow-up of urban performance. They can be further extended to measure and rank cities and their achievement towards sustainable development goals. Indices in addition, help cities themselves and people within them to make progress towards living in a more sustainable environment (Bohringer and Jochem Citation2011).
One of the aims of the research is to develop an ‘Indexing Model’ that is ‘Live-and-Work (LaW) City Index’ Model; the real issue is a simple one: How can we blend the economic dynamism of cities with the need to create cohesive, high-quality social communities within the environmental limits for achieving the live-work balance?
The live-and-work balance can be achieved by building a better quality of life that balances social, environmental and economic needs and offers an indicative picture of the health and wealth of cities for the present and the future (Batten Citation2016).
The range of people’s needs in a city is broad, encompassing the quality of life and quality of work. The quality of life enables them to live including livelihood requirements, housing, education, recreational outlets and access to culture and arts, also the city’s built assets, such as buildings, transportation networks and pedestrian thoroughfares should perform optimally when planned to accentuate the living experience of its people. Quality of work is getting a city to invest, develop, evolve and ultimately be a better host for its permanent residents. Maintaining a balance between the two qualities; live and work, will consequently propel a city to become more competitive (Batten Citation2016).
From here three main categories were chosen (Environment, Society and Economy). The index categories are selected to achieve the live-work balance of cities in a fair and balanced way and consider the triple bottom line approach, without differentiating the importance of any on the others (Gaffney and Togtokh Citation2010).
It is intended while designing the index to take into consideration the pros and cons of other established indices and come up with a one-dimensional metric; to evaluate a city’s specific information on the three dimensions of sustainable development and thus, determine the degree of the city’s index ranking. The higher the value for the index, the more attractive the city is towards its citizens, and vice versa (Schlor et al. Citation2013).
Another aim of the research is to visualise all targeted values of individual indicators and the sub-indices in a comprehensive and easy manner, where all individual indicators could also be overseen solely and thus tracking their progress towards their targeted values.
This paper is organised in five sections. Following this introduction the problems are highlighted, discussing the drawbacks of several indicators tool achievements. After that, the methodological approach of the LaW City Index Model is constructed; in this section, the main components of the model are introduced: theoretical concepts, core and sub-core indicators and indexing bases of the model. The reliability and effectiveness of the model is also clarified through the model results in section four. Lastly, the conclusions are discussed.
2. Defining the problem
The field of sustainable development has developed immensely over the past few decades. The awareness and action that precipitated this progress has accomplished a great deal; however, one difficult aspect of sustainable development improvement is that it can be hard to measure and quantify. These measurements are still extremely important; they can validate actions in certain areas and identify how efforts can be improved in the future. Therefore, it is important that we employ sustainable development indicators to measure the outcomes in cities, where people can live and work (United Nations, Economic and Social Affairs, Citation2007), (Munda et al. Citation2014).
2.1. Quantifying sustainable development
Sustainable development indicators are multi-dimensional measurements that are quantitative in nature. These indicators point to an issue or conditions to demonstrate the well-being or quality of life in urban settlements, which include an integral view for the environmental, economic and social dimensions rather than examining one factor in isolation. While sustainable development indicators encompass these traits, what make them unique are the visualisation phenomena and the efficient, logical approaches in determining comparative levels (Munda et al Citation2014).
2.2. Indicator tools achievements for sustainable cities
Sustainable development indicators are tools that allow city planners, city managers and policy makers to gauge the socio-economic and environmental impact of, for example, current urban designs, infrastructure, policies, waste disposal systems, pollution and access to services by citizens. They allow for the diagnosis of problems and pressure in urban areas and help monitor the success and impact of sustainable development interventions. Besides that, they could be further aggregated to rank cities by benchmarking their performance (European Commission Citation2018).
There have been several efforts and a continuing need to develop indicator tools to capture elements of sustainable development in real cities by various organisations and research groups. Many of these indicator tools have specifically focused on one/two dimensions more than the other/s; neglecting the overlapping of the other pillars of sustainable development. Besides that, same weightings were assigned to individual indicators when developing the index tool.
The European Green City Index (Economist Intelligence Unit, Siemens Citation2009) is an indicator tool that is considered to be an evaluation of the environmental sustainability of 30 European cities. Thirty indicators were used to compare these cities. Little attention, however, is paid to measure of health, happiness and quality of life for this index. A normalised value is given to each indicator to allow comparison between cities. This indicator system was not intended for widespread use, but could easily be adapted to the task of evaluating other cities. A spider web was used to visualise the performance of these cities (The European Commission DG Environment by the Science Communication Unit Citation2018).
The Ecological Footprint, the Environmental Sustainability Index (ESI) (Yale University 1999) and the Environmental Performance Index (EPI) (Yale University 2002), are all considered to be other examples of environmental sustainability indicators (Bohringer and Jochem Citation2011).
The Global City Indicators Program (GCIP) (The WorldBank Citation2002) is another example, but on the contrary; gave little attention to environmental sustainability. The programme is a decentralised city-led initiative; that enables cities to measure, report and improve their performance and quality of life. Standardised city indicators are developed to facilitate comparison and verification across cities and over time. The GCIP was initiated by the World Bank and its partners and is now run by the Global City Indicators Facility, based at the University of Toronto. The Global City Indicators Programs is suitable and applicable for all cities regardless of their size. The framework is organised into two broad categories: city services and quality of life. The two are structured around 18 themes. Each theme consists of core and supporting indicators. At present, there are 27 core and 36 supporting indicators (63 indicators in total), there are also 10 indices that are currently under development. This tool covers all aspects of urban life, with an emphasis on economic and social measures of sustainable development. It does not measure pollution or air quality and there is little mention of renewable energy resources for this tool (Bhada and Hoornweg Citation2009).
However, some limited achievements have been done to measure and monitor city performance and urban quality of life as a comprehensive system; including all three sustainable development dimensions and a single standard.
The 2016 ARCADIS Sustainable Cities Index is an example of an achievement done that ranks 100 global cities on the three dimensions of sustainable development. The purpose of the index was to offer a clear assessment of where a city is today, identifying the outputs arising from the interaction between the city’s physical, social and economic systems. This will help cities achieve a better balance across each of the pillars of sustainable development. The research shows that cities around the world are not effectively balancing these three pillars, instead many demonstrate split personalities. While taking the lead in some areas, cities often underperform in one element of the sustainability dimensions which negatively impact their overall performance (Batten Citation2016).
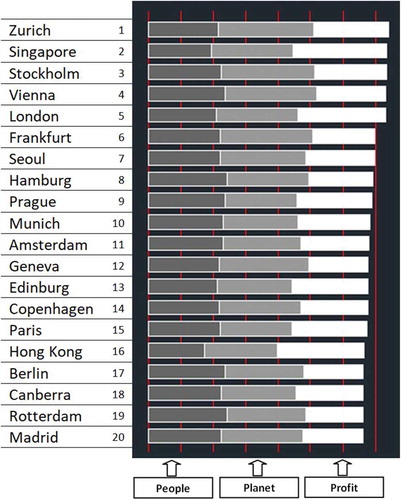
Arcadis partnered with the Centre for Economic and Business Research (Cebr) to explore how cities are doing across these three areas. Cebr assessed 100 of the world’s leading cities, using 32 different indicators, to develop an indicative ranking of the sustainable development of each. Each city received a score on each of the three pillars, and then the average of the three sub-indices was calculated to obtain the city’s overall score and thus was ranked accordingly. indicates the sustainable development city index for the top 20 cities. It was concluded that Zurich City leads the overall ranking and tops the environmental sub-index but while it scores highly in the economic section it reveals its split personality by appearing in the twenty-seventh place for social dimensions (Batten Citation2016).
Figure 1. ARCADIS sustainable cities ranking.
Source: (Batten Citation2016)
From here, weaknesses and strengths were tackled for each of the mentioned indices. These were further put in to consideration while designing the LaW City Index. The weaknesses and strengths could be summarised as follows:
Global City Indicators Program: (Strength: easy to implement. Weakness: covers all aspects of urban life, with an emphasis on economic and social measures of sustainable development but it does not measure pollution or air quality and there is little mention of renewable energy resources (Bhada and Hoornweg Citation2009)).
European Green City Index: (Strength: easy to implement, indicators are normalised and then visualised using a spider web. Weakness: Little attention is paid to measure of health, happiness and quality of life and emphasis only on environmental measures of sustainable development, also the indicator system was not intended for widespread use (applied on European Cities) (European Commision Citation2018)).
ARCADIS City Index 2016: (Strength: integration between the three different sustainable measures (profit, planet and people). Weakness: weightings of all indicators are the same, also lacked a comprehensive visual manner for both individual indicators and their indices (Baten Citation2016)).
2.3. Bridging the gap for composite indicators drawbacks
A composite indicator is formed when individual indicators are compiled into a single index on the basis of a model framework.
The composite indicator should ideally measure multi-dimensional concepts which cannot be captured by a single indicator (European Commission OECD Citation2008), besides that they are easier to interpret than many separate indicators and eventually can reduce the visible size of a set of indicators without dropping the underlying information and therefore assessing the progress of city overtime. On the other hand composite indicators may sometimes send misleading policy messages if poorly constructed or misinterpreted (Bohringer and Jochem Citation2011).
From here arose the conflict debate between supporters and opponents for the use of composite indicators. Aggregators believe that such a summary statistics can indeed capture reality and meaning. The second school, the non-aggregators believe one should stop once an appropriate set of indicators has been created and not go the further step of producing a composite index (Bohringer and Jochem Citation2011).
Most composite indicators relied mainly on complicated formulas to develop their indices. This consequently lacked viewing the individual indicators in one integrated visual manner together with its final computed value. For example, the 2016 ARCADIS Sustainable Cities Index, mentioned previously, shows the sub-indices values for each city, but fails to show the individual indicators and how they move towards their targeted values in a one comprehensive and integrated manner.
In overall, the main aims of the research are to take into account the drawbacks of other composite indicators by utilising the following aspects when modelling the tool:
Integrating and taking into account the three main dimensions of sustainable development without differentiating the importance of any of the others.
Assigning different weightings to individual indicators when developing the index.
Reducing the size of separate indicators by combining them in one integrated manner and thus computing the final value of the index that could be further used to rank cities.
Visualising all targeted values of individual indicators and the sub-indices in a comprehensive and easy manner, where all individual indicators could also be overseen solely and thus tracking their progress towards their targeted values.
Guide decision making for public and decision makers because of the visual, easy interpretation criteria it follows.
2.4. Logical aspects of sustainable development indices
Composite indicators are generally used to summarise a number of underlying individual indicators or variables. The indices are constructed by applying a set of logical aspects such as: normalisation, aggregation and weighing of the underlying variables (Singh et al. Citation2011).
Normalisation also called transformation or standardisation is usually applied to single variables (indicators) in order to make them comparable to one another, i.e. transforming the various scales of variables into one unique scale (Yigitcanlar and Dur Citation2010), (Yigitcanlar et al. Citation2008).
The normalised indicators are then aggregated (added). Aggregate of indicators assists decision makers by reducing the clutter of too much information, thereby helping to communicate information succinctly and efficiently. As Meadows, 1998, states ‘aggregation is necessary to keep from overwhelming the system at the higher levels of the hierarchy’ (Yigitcanlar and Dur Citation2010). This could be done by using specific formulas and get the right functional relationship (e.g. Arithmetic mean).
Different weights may be assigned to component series in order to reflect their importance. Weights usually have an important impact on the index and on the resulting ranking (Yigitcanlar and Dur Citation2010).
Sustainable development indicators are different from traditional indicators of economic, social, and environmental progress. Traditional indicators measure changes in one part of a community as if they were entirely independent of the other parts. Sustainable development indicators are very tightly interconnected, in other words, they are characterised by their complexity; for example, Job indicators are related and interlinked to crime, education and poverty indicators, while air quality indicators are interlinked and related to transportation, natural resources and land use and planning indicators (Booysen Citation2002), (National Association of Planning Councils Citation2007).
Therefore, weighing will be able to specify correct inter-relationships, by assigning a stronger weight to important indicators. In other words, if one indicator is more important than another, the former is assigned a stronger weight than the latter within the aggregation procedure (Bohringer and Jochem Citation2011).
3. Methodology of modelling framework
This paper reports a study that develops the LaW City Index Model that is considered to be an indicator-based urban sustainable development model. The specific aim of the model is to incorporate all related domains affecting urban sustainable development when work and living conditions are put together in one scheme and incorporate them into a practical assessment method. From here, a model framework is developed that will consequently have the potential and reliability to rank different types of cities with an economic base, that can either be a new or an old historical city.
3.1. The LaW City Index Model framework
The LaW City Index scenario will follow six consecutive steps that finally computes and visualises the indexing model of cities, allowing them to be comparable and thus guiding in the decision-making process. The model is detailed in .
Figure 2. Procedures for setting up the modelling process.
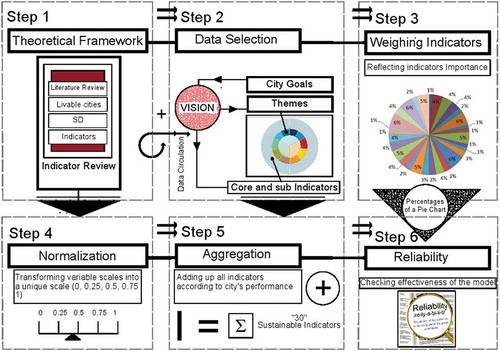
The first step of the model is to select a relevant measurement method that is used to evaluate performance of cities. This is selected in regards to its theoretical concept consistency and practical simplicity. A theme-based framework is applied. Ideally, this framework will allow indicators to be selected, combined and weighed in a detailed simple manner, which reflects the dimensions of the phenomena being measured (Ebert and Welsh Citation2004; Communities Committee Citation2007; European Commission OECD Citation2008; Yigitcanlar and Dur Citation2010; Bohringer and Jochem Citation2011).
The main objectives for creating the live-and-work balance within a city are based on the triple bottom-line approach of sustainable development; this consequently will develop the main three categories of sustainable indicators headlines, which are as follows:
Promoting a vibrant culture and a diverse economic base (Profit).
Protecting the natural environment (Planet).
A socially inclusive city with high-quality public domain (People).
3.2. Data selection of modelling scenario
To gauge the comparative levels of the urban settings a number of core and sub-indicators and parameters are employed. The individual indicators are then organised and grouped under the main three headlines as discussed previously.
3.2.1. LaW City’s vision, goals and objectives
In order to create a healthy environment when putting work opportunities and living facilities in the same scheme, a detailed vision together with main objectives and goals for the LaW City is listed to articulate its thematic headlines; thus preparing for the selection of individual indicators (Grey and Siddal Citation2011).
The vision states: Within the next 20–30 years the LaW City could establish reputation as dynamic, vibrant, compact and resourceful city through a shared vision of its citizens and civic leaders. Thus creating a beautiful, liveable city region promoting vibrant culture, creation of new employment opportunities, development and delivery of renewable energy; a resilient environment, and a diverse innovation based economy which supports the livelihoods and well-being of its citizens. It will be a city region of communities connected through an integrated transportation network with recreational areas, green spaces, affordable housing and adequate services. It will protect and improve the natural environment and manage resources efficiently. The vision is for a city region where people will seek to live, work and enjoy as a matter of choice (Grey and Siddal Citation2011).
3.2.2. LaW City’s thematic headlines
The next step is to select the city thematic policies (Suite of headlines sustainability indicators).
The indicators selected will be a reflection of the stated vision in terms of the progression of the sustainable development agenda. Each concept (category/headline) will be supported by a number of ‘themes’ that is used to audit the progress towards the vision. Ten themes were chosen. These were guided by a sample of themes that are included in international, national, regional and local documents. The 10 themes are then linked and grouped under the three key concepts (headlines) (Fouda and El-Khazendar Citation2015).
3.2.3. LaW City’s core and sub-indicators selection
The research went through various numerous projects that exist worldwide to develop and apply indicators, some of them are; The Canadian Mortgage and Housing Corporation (CMHC), the United Nations Development Program (UNDP), Eurostat, the UN Commission on Sustainable Development and the Habitat Centre of the United Nations. Further details were also established in a recently published paper (Fouda and El-Khazendar Citation2015).
presents an example for one of the study guides used in the former paper. The table combines 17 studies covering 188 individual indicators, by Tanguay et al. (Citation2009). The category and frequency of use of indicators compiled from them are also detailed below (Tanguay et al. Citation2009; Fouda and El-Khazendar Citation2015).
Table 1. Frequency of use of indicators compiled from 17 studies.
From here, a set of individual indicators; core indicators (covering planning policies) and sub-indicators (evaluating other indicators), was then selected for each theme.
The indicators had been selected for the themes based on how well they:
Highlight the links between the community’s economic, social and environmental well being
Focus on a long-range view
Are understandable to the community
Are valid and reliable (Fouda and El-Khazendar Citation2015)
Once the indicators were selected, they were grouped according to basic categories (Thematic headlines).
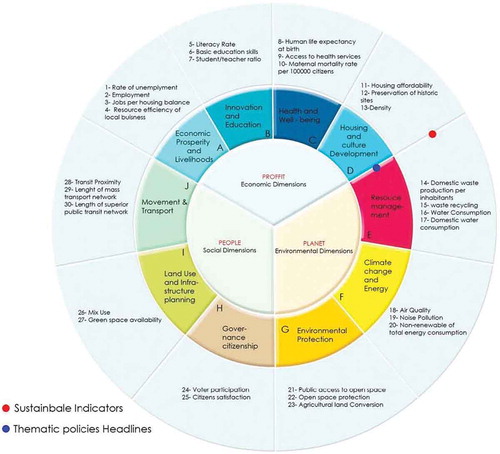
A framework for a Standard Indicator Format (SIF) has been also designed for each of the ‘30’ individual indicators to achieve a common understanding of the purpose and definitions of the indicator measurements in the sustainable development indicator set; the SIF for one of the indicators is further detailed as an example in Appendix 1. The SIF establishes a common methodology for calculating and presenting data and for the consequent trend analysis and benchmarking. For each of the 30 indicators, there is one SIF containing the following information: identification and description, relevance of the indicator, data sources, parameters, formulas and calculations and thematic mapping. illustrates the 30 indicators that were previously researched and compiled under the 10 themes (Fouda and El-Khazendar Citation2015), (Hintze Citation2015).
Figure 3. The ‘30’ Individual indicators compiled under 10 themes.
3.3. Weighing individual indicators
Many other indices failed to show the performance of cities as an integrated approach between the three pillars of sustainability, focusing on one/two dimension/s and neglecting the other/s, such as: the Global City Indicators (Bhada et al. Citation2009) and The European Green City Index (Economist Intelligence Unit, sponsored by Siemens Citation2009), as discussed before. The weight of individual indicators is crucial to achieve their inter-connectivity and overlapping between them. Nevertheless, Santa Monica, California was one of the projects that proved the integration between policy goals and sustainable development indicators by developing the goal/indicator matrix. The goal indicator matrix is a relatively more objective method than other methods in showing the inter-linkages of all sustainable development indicators together with the cities’ policy goals (Sustainable Environment [date unknown]), shown in Appendix 2.
Accordingly, and as shown in , a goal/indicator matrix was developed; emphasising the linkages between the indicators selected and city goals. The matrix lists all the 30 individual city indicators in the leftmost column and the 10 themes representing the city goals areas across the top; detailed before in .
Table 2. Indicators counts and weights.
For each indicator, counts (resembled by the number ‘1’) are shown for every goal area about which the indicator provides information and interlinks with it. For example; the indicator ‘rate of unemployment’; interlinks two thematic headlines (city goals) listed across the top these are: (economic prosperity of livelihood and innovation and education) and accordingly a score of 2 counts is computed for that indicator (1 count for each).
On the other hand, the indicator ‘transit proximity’ inter-links eight thematic headlines (city goals) listed across the top these are: (economic prosperity, health and well-being, environmental protection, climate change, efficient resource management, community engagement, land use and movement and transport) and accordingly a score of 8 counts is computed for that indicator (1 count for each). By comparing between the two indicators we will conclude that the transit proximity indicator is of more importance than the rate of unemployment and thus achieving more counts and more weight (Sustainable Environment [date unknown]).
Accordingly, this proves the linkages between the goal areas and the impact of decisions across environmental, social and economic boundaries. From here, it is concluded that, the higher linkages between the indicators and the city thematic headlines (goals) the higher its counts and weights. The weights are further visualised and resembled (numbered from 1 to 30) in a pie-chart according to their counts, as shown in .
3.4. Normalisation of individual indicators
Normalisation is required prior to any data aggregation when, as usual, indicators in a dataset have different measurement units. Indicators are expressed in a variety of statistical units such as: percentages, ratios, absolute values…, etc.), thus need to be normalised in order to be comparable (Munda et al. Citation2014). The methods that appeared better-suited for the construction is re-scaling. From here, a series of benchmarks were formulated to represent different levels of indicators. Each of these levels corresponds to a normalised value comprised between 0 and 1. illustrates the normalisation values for individual indicators (Bosello et al. Citation2011).
Table 3. Normalisation of indicators variables.
A different benchmark (a standard or point of references against which things may be compared) will be designed for each indicator according to different European and International Sources, both at a technical and at a policy level (Bosello et al. Citation2011). A general definition of the benchmarking criteria will be given first for every indicator and then they are benchmarked to values that indicate different levels of performance in absolute terms (Rhim and Chun Citation2015), (Hemphill et al. Citation2004), (Pinter et al. Citation2005). illustrates the description of the benchmarking procedure done to one individual indicator and how it is structured.
Table 4. % Renewable of total energy consumption benchmarks values.
4. Application of the model
The LaW Index Model outputs are aggregated and visualised in the form of a pie/radar chart. A pie/radar chart is an integration of the pie and radar chart, stacked up together in a single chart. The pie chart will be able to visualise the correlation count and weights of the 30 different individual indicator variables illustrated previously. Which is further extended to gauge and rank cities’ performance.
4.1. Aggregated indicators results of the LaW Model
The 30 different individual indicators will create 30 sectors; each sector will be assigned an angular value depending on its weight (% of 360 degrees). The radar chart will then visualise the performance of the city for all 30 variables across the five-normalisation values (ranging between 0–1) thus dividing the circular chart into four internal concentric circles. Accordingly, the performance value for each indicator will decide its area filling. Finally, the output chart is then prepared for use in the benchmarking and policy-making processes. The structure and outlines of an empty pie/radar chart is shown in .
Table 5. The 30 indicators, formulas and standardisation values used for auditing.
Figure 4. Pie/radar chart structure of the LaW Model.
(Indicator Number: as listed in and , and later: and .)
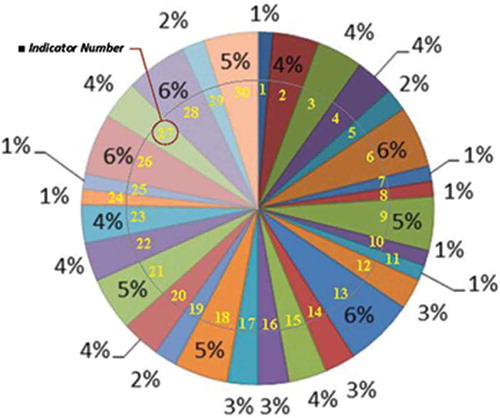
Figure 5. Pie/radar chart for New Borg Al-Arab City—year (2011–2012).
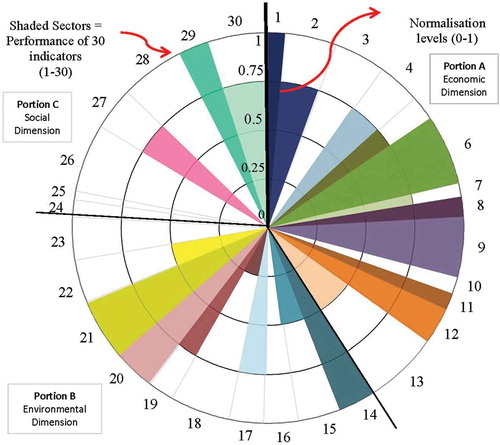
Figure 8. Stacking up alternative development scenarios for city (A) in different study times () and (
).
From here, it is possible to define a functional form for aggregation. It was taken into consideration that indices should ideally remain relatively simple in terms of their construction and interpretation. The general formula extracted to generate the index is derived from the following criteria:
Index (I) = Individual indicators aggregation
Aggregation = Adding up together the total area sectors for each individual indicator that the city has achieved
(N.B.: Area of each individual indicator across the five-level normalisation depends on the city’s performance)
(Where = the area of the individual indicator
= 1–30), r = the radius of the sector out of the five-level normalisation values (0, 0.25, 0.5, 0.75, 1), depending on its performance and
= the angular value in degrees depending on the weight of each individual indicator).
I = Summation of area sectors of 30 individual indicators in total
(Where N is the normalisation value that is equivalent to r (radius)).
An ideal sustainable city will have a normalisation value of 1 (target level fully sustainable) for every individual indicator, thus filling up all its sectors:
Where
From here a general formula (Equation 6) could be extracted to calculate the index of the LaW City Index Model as a percentage of an ideal city as follows:
(Where is the weight of the indicator variable in degrees and N is out of the five-levels normalisation values according to its performance.)
The index of a city could finally compute the summation of the areas fillings for the 30 indicators variables; the higher the areas fillings the higher its index value and vice versa. This consequently could rank multiple cities and gauge their performance towards their sustainable development goals.
4.2. Effectiveness and reliability of the LaW Model
The effectiveness and reliability of the model could be validated by implementing the model scenario on different cases of urban development with varying conditions.
Three cities were chosen as follows; New Borg Al-Arab—Egypt, Milton Keynes—United Kingdom and Košice—Slovakia. It was intended to have varying conditions for the urban development chosen to verify and emphasise the reliability of the model.
To ensure fair test results. A SIF; as discussed before, was constructed to achieve a common understanding of the purpose, and the definitions of the indicator measurements. illustrates the entire 30 individual indicators together with their formulas and their standardisation values. These were employed to audit the performance of the mentioned three cities and their achievements towards sustainable development goals.
For each city, the 30 indicators were calculated independently and their scores were benchmarked with the standardisation values. Accordingly, a normalisation score was given for each (range {0–1}) as previously discussed.
4.2.1. LaW City Index for New Borg Al-Arab City
New Borg Al-Arab City is a new independent satellite city for Alexandria in Egypt with a diverse economic base, besides being an industrial city including: tourism, construction, services and agriculture (Fouda and El-Khazendar Citation2015).
The study relied on statistical sources; together with the aid of GIS, to compute the values for each indicator. These were referenced from sources such as: Central Agency for Public Mobilization and Statistics (CAPMAS April 2004), Data Support and Urban Analysis input (UN-Habitat Citation2009), United Nations Industrial Development Organization (UNIDO Citation2000), World Bank Reports (Anderson Citation2012), (Ministry of Housing and New Borg AL Arab Development Agency Citation2012), (Organization for Physical Planning Citation2000Citation), (Population and Social Data Base Citation2006). shows the normalisation score for each indicator after calculating its value (Fouda and El-Khazendar Citation2015).
Table 6. The normalisation value for each indicator for New Borg Al-Arab City.
visualises the LaW City Index for New Borg Al-Arab City (Year 2011–2012). A pie/radar chart is constructed to show the level of sustainable development performance for each of the 30 variables indicators. From here the index value for the city () could be calculated as follows:
Index % = (Total Area for 30 individual indicators/π) *100
Index % = (1.533/3.14)*100
Index % = 49%
A sustainable development appraisal through observation analysis for the current state concluded that there is a gap between: the original visions, development frameworks, detailed plans and actions on the one hand, and the present status of the city on the other (Fouda and El-Khazendar Citation2015). The LaW City Index has also proven that economic dimension was given more attention than the environmental and social dimensions (Area sectors in economic portion (A) are highlighted more than other dimensions (portion B&C)). This in return concludes the lagging of the city’s achievement from being a gravitational pull towards its citizens and proves the effectiveness and reliability of the model.
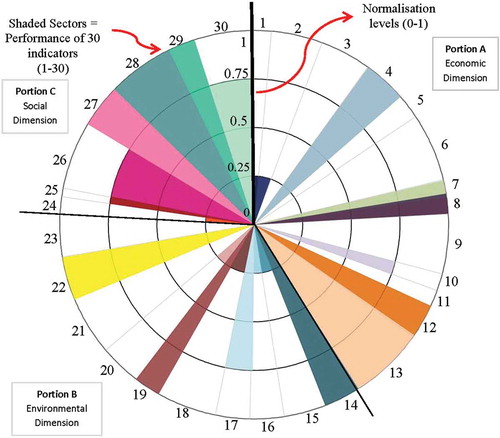
4.2.2. LaW City Index for Milton Keynes City
Milton Keynes was designated a new town in 1967 to relieve the pressure of the population growth that were occurring in the south of the county of Buckinghamshire. The master plan specified that the new town would use a grid pattern of roads enclosing dispersed land uses, at approximately 1 km intervals to provide fast, congestive-free routes across the city. Importance was also placed on good landscape design (Titheridge Citation2011).
Besides that, industry, commerce and residential housing are distributed throughout the city in an attempt to provide areas of employment, services and housing within walking distance of each other. Milton Keynes has a good record in implementing many innovative energy and environmental schemes. Besides that, the city is considered to possess a large, diverse and dynamic local economy (Titheridge Citation2011).
Milton Keynes was chosen as a second case study to ensure the varying conditions for the urban development. The city is situated in a developed country in Europe opposite to New Borg Al-Arab City.
The study relied on statistical sources to compute the values for each indicator. These were referenced from sources such as: (Milton Keynes Council Citation2017), Eurostat, World Bank Reports, European Environmental Agency, (Atlas of Air Quality Zones and Monitoring Stations), Milton Keynes Local Development Framework and Census Bureau (Cowley C, Madden P, Quinn T &Winter T. Citation2007). shows the normalisation score for each indicator after calculating its value.
Table 7. The normalisation value for each indicator for Milton Keynes City.
visualises the LaW City Index for Milton Keynes City (Year 2011–2012). A pie/radar chart is constructed to show the level of sustainable development performance for each of the 30 variables indicators. From here the index value for the city () could be calculated as follows:
Figure 6. Pie/radar chart for Milton Keynes City—year (2011–2012).
Index % = (Total Area for 30 individual indicators/ π) *100
Index % = (1.533/3.14)*100
Index % = 49%
A sustainable development appraisal through observation analysis for the current state was developed (Milton Keynes Council Citation2017) and it was concluded that the city had major strength in most of the indicators’ sectors. Further enhancements were needed for the following:
Brownfield development to decrease the effect of low-density planning.
On-site renewable energy generation is required.
Provision of more facilities and services.
Decrease of Households’ wastes per capita.
Promoting improvements to public transport.
The LaW City Index has also proven the sustainability appraisal mentioned previously (low and average normalisation scores for these indicators). Besides that, it has emphasised that the sustainable development dimensions (economy, social and environment) were somehow balanced opposite to New Borg Al-Arab City.
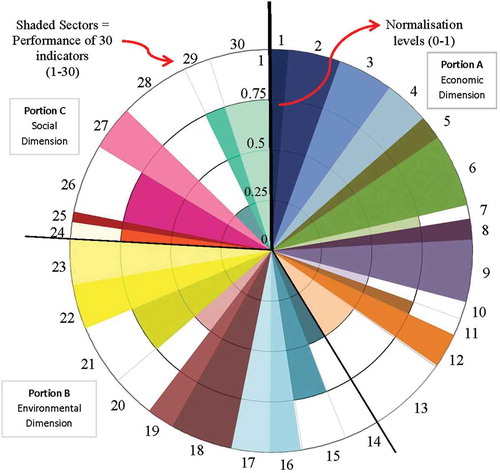
4.2.3. LaW City Index for Košice City
Košice is a city in eastern Slovakia, close to the Hungarian border. Since the 1990s, the Košice region has belonged to disadvantaged regions of eastern Slovakia, facing many problems: high unemployment rates, overall increasing out-migration that reduces human capital, lack of modern infrastructure and significant environmental problems (Marczis 2007–2009).
Košice was chosen as a third case study to also ensure the varying conditions for the urban development. Kosice is a historical industrial city with an old land use strategic master plan opposite to both New Borg Al-Arab and Milton Keynes Cities (new cities).
The study relied on referenced statistical sources to compute the values for each indicator, although data were somehow limited. These were referenced from sources such as: Eurostat, (The World Bank Citation2002), European Environmental Agency, Indicators for Sustainable Cities, Europa, Census Bureau and UNDP (Marczis Citation2009). shows the normalisation score for each indicator after calculating its value.
Table 8. The normalisation value for each indicator for Košice City.
visualises the LaW City Index for Košice City (Year 2011–2012). A pie/radar chart is constructed to show the level of sustainable development performance for each of the 30 variables indicators. From here the index value for the city () could be calculated as follows:
Figure 7. Pie/radar chart for Kosice City—year (2011–2012).
Index % = (Total Area for 30 individual indicators/π) *100
Index % = (1.429/3.14)*100
Index % = 45.5%
A sustainable development appraisal through observation analysis for the current state was developed and it was concluded that the city had major strength in the social dimension, especially for public transportation sector, but deteriorations were clear for both economic and environmental sectors (The World Bank Citation2002).
The LaW City Index has also proven the sustainability appraisal mentioned previously (low and average normalisation scores for these indicators). Besides that, it has emphasised that the social dimension was given more attention than economic and environmental dimensions.
5. Results of the application of the model
The results of the application of the model have revealed its effectiveness to visualise and calculate the indices of the mentioned cities. Yet, can be further extended to rank cities sustainable development performance.
5.1. LaW City Index rank
The LaW City Index could be used to rank cities in a tabular format and gauge their comparable sustainable development performance accordingly. shows the ranks of the former analysed cities.
Table 9. Final LaW Index city rank comparison.
It was clear from the table above that the higher the balance between the three dimensions of sustainable development (economic, social and environmental) the higher the rank is obtained by the city.
5.2. Further applications
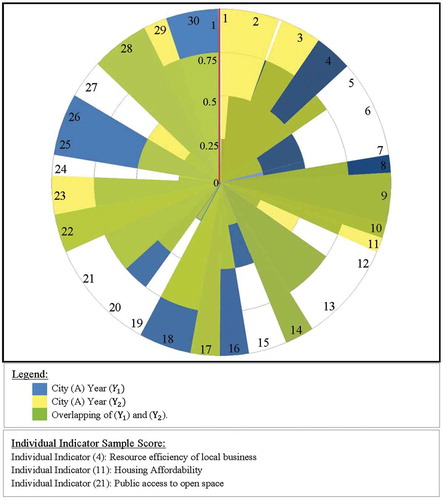
The model also has the communicative advantage of being easy to convey comparative levels of sustainability for cities in different study time, making it a relatively simple exercise for both the general public and decision makers to understand. The sustainability outcomes of alternative development scenarios during different year intervals could be easily visualised by stacking up different models. shows the visualisation of composite indicators for a hypothetical city (A) in two different year intervals (), (
).
A pie/radar chart is constructed for city (A) in different study time to show the levels of sustainable development performance for the city for two different year intervals () and (
). Year (
is indicated in blue values, while Year (
) is indicated in yellow values. The overlapping between the information will indicate a mixture of the two colours (shown in figure’s legend). The information for both years is stockpiled to make it comparable and easy to interpret. compares a sample score of three different individual indicators for both years (
) and (
).
Table 10. A sample of three individual indicators scores for city (A) in years () and (
).
6. Conclusions
The research results demonstrate that it is possible to produce a viable local level sustainable development assessment model, apply the model to a major urban area, and produce a visualised sustainable development index.
Efforts were done to develop composite indicators, but it was concluded that most of them focused on environmental dimensions and neglected the overlapping of the other influential ones. The proposed model exposed light on an overview of the nature and importance of composite indicators and how they can be structured and implemented precisely, overcoming its drawbacks, to gauge and rank the performance of cities across the demands of people, planet and profit, as a way of achieving the live-and-work balance.
The model action mode was developed by following a set of logical steps such as: weighing, normalisation and aggregation of individual indicators. The visualised LaW City Index has the communicative advantage of being easy to convey comparative levels of different values.
The model can also estimate the sustainable development outcomes of alternative development scenarios during temporal intervals. This can be achieved by stacking up different model scenarios, making it a relatively simple exercise for both the general public and decision-makers to understand.
Additional aspects are also needed to be considered. Hence, further research is anticipated which will focus on enhancing the model by testing it on more than three cities and thus ranking them against others. At this early stage of the proposed norm it was intended to be tested on three cities. The main purpose is to see whether the model works properly and provides meaningful and accurate findings.
Another area for further development and amendment of the model involves linking the model values in a GIS environment. ArcGIS has the capabilities to link location data with attributes and also perform spatial analysis on these data, thus, enabling city leaders to integrate and visualise enormous amounts of data for better and more realistic decision making.
All these improvements will also be tested in real case studies, and several sensitivity analyses. A more rigorous sensitivity analysis might also be used to check for the robustness and accuracy of the model. Nevertheless, the sustainable development indexing and assessment experience deducted by the overall results are valid, reliable and has shown that, when fully operated, the model has the potential to help planners and policy makers to pursue an integrated framework for locally adoptable sustainable development policies. The model is useful in providing unambiguous representation of relationships in urban form and problem areas of urban settings and, where necessary, policies can be tested and accommodated accordingly.
Problems resulting from composite indictors were also enhanced through the development of the LaW Index Model. The model employs a holistic view of the urban dynamics, integrating all three areas of sustainable development and is not only an environmental impact assessment model. Besides that, the model was able to visualise all 30 indicators together with the overall computed index value of cities in an easy, simple and powerful illustrative manner.
Disclosure statement
No potential conflict of interest was reported by the authors.
Additional information
Notes on contributors
Yasser ElSayed Fouda
Yasser ElSayed Fouda is a consultant and an Associate Professor of Urban Planning and Architecture. He was appointed as the deputy council head of Department of Architectural Engineering, Faculty of Engineering, Tanta University, Tanta, Egypt. His major field of research is sustainability in urban development, and contemporary conflicts of the urban environment, urban planning, landscape, and urban ecology.
Deena Mohamed Elkhazendar
Deena Mohamed ElKhazendar is an external researcher at the Department of Architectural Engineering, Faculty of Engineering, Tanta University, Tanta, Egypt. Graduated as an architect, her main research discipline is issues of urban sustainable development of new industrial communities.
References
- Anderson C 2012. City sustainability indicators. World Bank, Urban Development and Local Government.http://www.eu-ems.com/event_images/Downloads/The%20World%20Bank.pdf.
- Atkinson G, Dubourg WR, Hamilton K, Munasinghe M, Pearce DW, Young CEF. 1997. Measuring sustainable development: macroeconomics and the environment. UK: Edward Elgar, Cheltenham. ISBN 9781858985725.
- Batten J 2016. Sustainable cities index 2016, putting people at the heart of city sustainability. ARCADIS. https://www.arcadis.com/media/0/6/6/%7B06687980-3179-47AD-89FD-F6AFA76EBB73%7DSustainable%20Cities%20Index%202016%20Global%20Web.pdf
- Beaumont P 2014. Go Green, The Green Dandelion Sustainability: Indicators of Sustainability Actions, University of Rochester.
- Bhada P, Hoornweg D 2009. The global city indicators program: a more credible voice for cities. directions in urban development. World Bank. Washington (DC): © World Bank. https://openknowledge.worldbank.org/handle/10986/10244License:CCBY3.0IGO
- Bohringer C, Jochem P 2011. Measuring the immeasurable: a survey of sustainability indices. Discussion Paper No. 06-073. Germany: Centre for European Economic Research. ftp://ftp.zew.de/pub/zew-docs/dp/dp06073.pdf.
- Booysen F. 2002 August. An overview and evaluation of composite indices of development. Soc Indic Res. 59(2): 115–151. The Netherlands.
- Bosello F, Portale E, Compagnolo L, Eboli F, Parrado R 2011. Integrating mainstream economic indicators with sustainable development objectives, INSTREAM Seventh Framework Programme Theme FP7-ENV-2007-1 Area 6.4.2.2. Sustainable Development indicators. Grant agreement number: 211759.
- The Central Agency for Public Mobilization and Statistics. 2004 April. Egypt in figures, CAPMAS.
- Communities Committee. 2007. Indicators tool kit - chapter 4: measuring progress. Seventh American Forest Congress. http://www.communitiescommittee.org/fsitool/Chapter4.pdf.
- Cowley C, Madden P, Quinn T, Winter T 2007. The sustainable city index: ranking the largest 20 British Cities. Forum for the Future, UK. https://www.forumforthefuture.org/project/sustainable-cities-index/overview.
- Ebert U, Welsh H. 2004. Meaningful environmental indices: a social choice approach. J Environ Econ Manage. 47:270–283.
- Economist Intelligence Unit, sponsored by Siemens. 2009. European green city index. Assessing the environmental impact of Europe’s major cities.
- The European Commission DG Environment by the Science Communication Unit. 2018. Science for environmental policy, 2018. Indicators for sustainable cities. In-depth Report 12. UWE, Bristol. http://ec.europa.eu/environment/integration/research/newsalert/pdf/indicators_for_sustainable_cities_IR12_en.pdf
- European Commission OECD. 2008. handbook on constructing composite indicators: methodology and user guide. (Organisation for Economic Co-operation and Development) OECD Publishing, Paris. http://www.oecd.org/sdd/42495745.pdf.
- Fouda YE, El-Khazendar DM. 2015. GIS based decision support system for auditing sustainable development in industrial cities—case of Borg Al-Arab City. J Archit Plann. 23(2014, 2015):23–41. Beirut, Lebanon: Beirut Arab University. http://www.bau.edu.lb/BAUUpload/Library/Files/Architecture/Volume%2023/3.pdf.
- Gaffney O, Togtokh C 2010. 2010 Human Sustainable Development Index. United Nations University.
- Grey T, Siddal E 2011. Sustainability indicators framework 2011, Towards a Sustainable Dublin Region, Dublin.
- Hardi P, Zdan T. 1997. Assessing sustainable development: principles in practice. Canada: The International Institute for Sustainable Development.
- Hemphill L, Berry J, McGreal S. 2004. An indicator-based approach to measuring sustainable urban regeneration performance: part 1, conceptual foundations and methodological framework. Urban Stud. 41(4):725–755. Sage.
- Hintze J 2015. NCSS statistical software. Chapter 230, Circular Data Analysis. http://www.ncss.com/wp-content/themes/ncss/pdf/Procedures/NCSS/Circular_Data_Analysis.pdf;.http://www.siemens.com/greencityindex
- Marczis M. 2009. Capacity development for sustainable development in the Kosice Region in Slovakia. UNDP BRC, 2007-2009. United Nations Development Programme. http:\\www.localdevelopmentforinclusion.org/assets/12-capacity-development-in-kosice-region—project-brief.pdf
- Milton Keynes Council. 2017 February. Plan: MK Draft Plan, Feb 2017. United Kingdom.
- Ministry of Housing, Utilities and Urban Development, New Urban Communities Authority, New Borg Al-Arab Development Agency, General Organization for Physical planning: Borg Al-Arab New City Strategic Plan. May 5, 2012.
- Munda G, Nardo M, Podinovskii VV 2014, December 18. Composite Indicators Research Group, European Commission.
- National Association of Planning Councils. 2007. Social indicators: brief overview/history. www.communityplanning.org.
- Organization for Physical Planning, Ministry of Housing Utilities and Urban Communities. Egypt 2000. Greater Cairo Atlas.
- Pinter L, Hardi P, Bartelmus P 2005. Sustainable development indicators: proposals for a way forward. New York (NY): Prepared by United Nations Division for SD. www.iisd.org/pdf/2005/measure_indicators_sd_way_forward.pdf.
- Population and Social Data Base. Agency for public mobilization and statistics 2006 census, and Development Report 1995, 2003 & 2010.
- Rhim J, Chun J 2015. Indicators in practice, ARCADIS Sustainable Cities Index Report, Yale University.
- Schlor H, Fisher W, Hake J-F. 2013, Jan. Methods of Measuring Sustainable Development of the German Energy Sector. ELSEVIER, Applied Energy, (101):172–181. https://www.sciencedirect.com/science/article/pii/S0306261912003583.
- Singh RK, Murty HR, Gupta SK, Dikshit AK. 2011. An overview of sustainability assessment methodologies. Ecol Indic. 15(1):281–299. ElSEVIER.
- Sustainable Environment. UK Indicators. [date unknown]. Santa Monica Sustainable city plan. http://www.sustainable-environment.org.uk.
- Titheridge H 2011. A sustainability assessment of transport in Milton Keynes. UK. United Kingdom: University College London. http://www.wctrs-society.com/wpcontent/uploads/abstracts/berkeley/F6/897/Titheridge_WCTRS07v2.doc.
- UNHABITAT Indicators. 2009 July. Urban indicators guidelines. http://www.unhabitat.org/downloads/docs/Urban_Indicators.pdf.
- United Nations Industrial Development Organization (UNIDO). 2000. Challenges of sustainable industrial development in Egypt. http://www.mafhoum.com/press2/79E19.pdf.
- United Nations, Economic and Social Affairs. 2007. Indicators of sustainable development, guidelines and methodologies. United Nations publication. Third ed. New York (NY). https://sustainabledevelopment.un.org/content/documents/guidelines.pdf.
- Tanguay G., Rajaonson J., Lefebvre J-F., Lanoie P. 2009, Jan. Measuring the Sustainability of Cities: A Survey-Based Analysis of the Use of Local Indicators. Montreal, Canada. CIRANO, Partenaire Financier: Development economique, Innovation et Exportation, Quebec. ISSN 1198-8177. https://www.cirano.qc.ca/files/publications/2009s-02.pdf.
- The World Bank. 2002. Slovak republic: living standards, employment and labor market study. Washington D.C.
- Yigitcanlar T, Dur F. 2010. Developing a sustainability assessment model: the sustainable infrastructure, land-use, environment and transport model. Sustainability ISSN 2071-1050. 2(1):321–340. Australia.
- Yigitcanlar T, Fabian L, Coiacetto E. 2008. Challenges to urban transport sustainability and smart transport in a tourist city: the gold coast, Australia. The Open Transp J. 2:29–46.
Appendix 1.
Standard Indicator Format (SIF) for one indicator
A framework for a standard indicator format (SIF) has been also designed for each of the ‘30’ individual indicators to achieve a common understanding of the purpose and definitions of the indicator measurements in the sustainable development indicator set. It establishes a common methodology for calculating and presenting data and for the consequent trend analysis and benchmarking. For each of the 30 indicators, there is one SIF containing the following information: identification and description, relevance of the indicator, data sources, parameters, formulas and calculations and thematic mapping.
Appendix 2.
Goal/Indicator Matrix
Indicators have been selected for the themes based on how efficiently they:
address the issue of the communities’ carrying capacity relative to the four types of communities’ capital: natural, human, social and built.
possess accessible data resources for the city.
highlight the links between the community’s economic, social and environmental well being.
focus on a long range view.
are understandable to the community.
The matrix in table lists all of the sustainable city indicators, and the 10 themes representing the city goals, in area across the top. For each indicator, dots are shown for every goal area about which the indicator provides information. From the table below we could ensure the inter-linkages between the indicators, and the multi-dimensions of sustainability.