
 ?Mathematical formulae have been encoded as MathML and are displayed in this HTML version using MathJax in order to improve their display. Uncheck the box to turn MathJax off. This feature requires Javascript. Click on a formula to zoom.
ABSTRACT
This study proposes an exploratory urban morphology agent-based model (ABM) to simulate the combined impact of the establishment of hub facilities that urban residents can conveniently access, policies for promoting human interactions around them, and the introduction of trams amidst dispersed habitations in peripheral urban areas. The proposed model offers a new perspective on ways to improve the urban environment. It describes a shift from dispersed habitation to concentrated habitation in a bottom-up manner through behavioural changes at the micro level, which lead to productive human interactions in an urban setting. Specifically, the model experimentally demonstrates a trade-off between increased human interactions caused by the introduction of hub facilities that attract a diverse range of activities, and policies that promote such interactions and development amongst dispersed habitation. Additionally, the model suggests that the direction of urban growth is a consequence of collective action, implying that collaborative efforts can facilitate its improvement.
1. Introduction
1.1. Measures for dispersed habitation accompanying urban expansion
Global population has exponentially increased throughout the twentieth and twenty-first centuries. Consequently, land – a finite resource – has undergone rapid development worldwide, which has adverse environmental impacts. Urbanisation, in particular, is expanding at a rate far higher than that of population growth, and more than half of the global population lives in cities (Angel et al. Citation2011; United Nations, Department of Economic and Social Affairs Citation2012; Gerland et al. Citation2014; Bacci Citation2017).
The benefits of cities – a concentration of diverse complementary multiple activities, people, and cultures in one place – cannot be overemphasized. The so-called agglomeration economies in cities have two aspects. First, localisation economies indicate geographic concentrations of inter-connected individuals and groups in a particular field. Second, urbanisation economies, also known as urban agglomerations, emerge when dissimilar individuals and groups are located near each other (Krugman Citation1996; Irwin Citation2010; Levin et al. Citation2013; Beeson Citation2017). It is not only commercial organisations that benefit from such sharing, matching, and learning (Duranton and Puga Citation2004); households, too, can avail of social contacts, the quality of the neighbourhood, or the proximity to schools and shops (Elkin et al. Citation1991; Behan et al. Citation2008; Wey Citation2019; Carmona Citation2021).
In addition to covering the soil, urbanisation places additional load on the land – for example, through the development of lifelines such as water, sewerage, and electricity grids and transport networks. Therefore, urbanisation exerts a greater negative impact on natural and social environments than any other form of land use (Batisani and Yarnal Citation2009; van Delden et al. Citation2016). Consequently, dealing with growing urbanisation has become a major global concern.
Recently, guidelines for managing land use have been collaboratively developed by researchers from various disciplines across Europe. Addressing the three aspects of sustainability – the economy, ecosystem, and society – they compared and evaluated the following Scenarios of typical urbanisation as consequences of interventionist urbanisation policies (Cotella et al. Citation2020):
Compact urbanisation: often a consequence of policies that address urbanisation in terms of revitalisation, enrichment, and redevelopment of urban areas.
Polycentric urbanisation: often a consequence of policies that straddle space and time, such as collaboration between public transport and urban development.
Diffuse urbanisation: often a consequence of liberal policies, including the promotion of privately owned vehicles and home ownership, which is the opposite of bureaucratic planning.
Among the urban forms resulting from these Scenarios, the first and second are largely positively evaluated. However, there are several related concerns such as over risk management and the potential imbalance with other cities in compact urbanisation, and access and traffic noise in polycentric urbanisation. The third urban form, by contrast, is negatively evaluated in almost every aspect, including high transport costs, low energy efficiency, environmental pollution, negative influences on biodiversity, and significant social separation. Its only strength is the convenience it offers to individuals.
Diffuse urban form is one of the significant characteristics of urban sprawl. There is vast anti-sprawl literature designed for both the public and academics. Despite some agreement about the major forms of sprawl and their disadvantages, the definition of ‘sprawl’ remains ambiguous. Although there is insufficient evidence that strategies for containing urban sprawl or densification are effective and that their social benefits outweigh their negative side-effects, political support for those strategies is substantially expanding (Millward Citation2006; Behan et al. Citation2008; Rubiera-Morollón and Garrido-Yserte Citation2020).
In such a context, what is an effective approach for dealing with complex issues such as sustainable urban growth? Land use, including urbanisation, is a consequence of the interaction of various mutually influencing factors. Additionally, these elements are not limited to authorities with legal rights and political or economic power. For example, decisions may be made because stakeholders, including private developers, predict and respond to the decisions of such authorities. A major characteristic of urbanisation is that it ‘emerges’ from numerous individual and collective decisions made by residents or groups of various sizes, regarding where and how to stay, work, study, and enjoy interactions, considering constraints such as affordability and mobility (Batty Citation2007; Frenkel and Ashkenazi Citation2008; Webb et al. Citation2018).
A common method of conventional urban planning is to present an ideal and restrict the activities of individuals and groups in the process of realising it. However, in democracies, such a top-down exercise of power is difficult to impose (Sieverts Citation2003; Healey Citation2017). Thus, urban planning requires a multi-dimensional, multi-sector, and multi-stakeholder approach.
Drawing on these concerns, this study presents an approach to improve dispersed habitation by generating a bottom-up ‘emergence’ created by appropriate interventions in resident behaviour by policymakers/implementors.
1.2. Transport oriented development
Among the attempts made worldwide to realise urban sustainability, we cannot overlook the concept of Transport Oriented Development (TOD). Since TOD was developed by Peter Calthorpe in the early 1990s as an alternative to low-density and huge-range residential suburban developments, its basic principles and policies have been effective for at least three decades (Calthorpe Citation1993). TOD commonly refers to the integration of transport and land use in the form of compact urban development at public transport nodes with high-quality walkable environment (Calthorpe Citation1993; Ewing et al. Citation2017; Zhang et al. Citation2019b; Hrelja et al. Citation2020; Su et al. Citation2021). This concept was inspired by the Garden City ideal posited by Ebenezer Howard (Howard Citation1902), in terms of relatively high-density and small clusters of land use and connection through transport networks (Caves Citation2004). Originally, TOD was understood as planning principles based on universal models and definitions (Calthorpe Citation1993; Cervero and Kockelman Citation1997; Rogers Citation1997). For example, the three Ds principle – high density, diversity of land-use patterns, and habitable design – used to be the focus (Cervero and Kockelman Citation1997). Thereafter, as it was applied more widely, a diversity of more flexible approaches and definitions for TOD were accepted. Representatively, another three Ds – accessibility to destination, distance to transit, and demand management – were added (Cervero Citation2004; Ewing and Cervero Citation2010; Curtis Citation2012). Additionally, TOD is considered an effective solution to the serious and growing problems of climate change and global energy security, as it can create dense and walkable communities that significantly reduce the need for driving (US High Speed Rail Association Citation2015; Hrelja et al. Citation2020; Ibraeva et al. Citation2020). Against this background, TOD, as an integrated planning strategy towards urban sustainable growth, has received increasing attention from researchers and practitioners, and gained increasing popularity in many cities worldwide (Thomas et al. Citation2018; Hrelja et al. Citation2020; Ibraeva et al. Citation2020). However, there has been a lack of attention to apply TOD in non-metropolitan, low-density, and provincial contexts (Nigro et al. Citation2019; Hrelja et al. Citation2020). In this context, this study discusses the potential of applying TOD beyond the street scale to the regional city scale, smaller than the metropolitan scale, to counteract dispersed habitation.
1.3. AIM of the research
Using a simulation experiment, this study examined interventionist policies designed to achieve sustainable urban growth, focussing on changes in spatial behaviour in the form of dispersed habitation in peripheral urban areas, as a consequence of collective behaviour of residents. The simulation is based on the research findings of the agent-based, operational land use-transport interaction (LUTI) model, which is an effective tool to examine the emergence of bottom-up urban forms based on collective behaviours. Thereafter, the study expanded the model by simultaneously introducing the benefits of human interaction at the micro-level in cities and the given condition of dispersed habitation. The model was further developed by considering the introduction of the tram – a transport policy that not only represents an alternative to privately owned vehicles but also has the potential to exert an influence on face-to-face interaction. This artificial society model allowed us to discuss an approach for sustainable urban growth that evaluates factors that could improve dispersed habitation. It is based on promoting human interaction and transport policies in cities.
This study did not aim to improve the urban environment in a particular location. Rather, it intended to gain insights into changes in urban forms caused by individual residents’ behaviour. Specifically, it sought to answer the following questions:
How can we model improvements in dispersed habitation in peripheral urban areas, which is an obstacle for sustainable urban growth?
What type of resident behaviour would lead to improvement?
What are the factors that would induce such behaviour?
The model suggests that the direction of urban growth is a consequence of collective action, implying that collaborative efforts can improve it (Cotella et al. Citation2020).
1.4. Structure of the article
The remainder of this article is organised as follows. Section 2 reviews related studies to explain the scientific basis of the study’s urban morphological agent-based model (ABM) and describes the position of the model. Section 3 discusses the basic constitutive elements of the model, based on the Overview, Design concepts, and Details (ODD) protocols. Sections 4 to 6 report a simulation experiment, based on several Scenarios of interventionist policies for urban expansion, and discuss the results. They also present test results on the model’s validity by comparing the model’s output with insights gained from real cities. Finally, Section 7 summarises the major findings of the model and concludes the study by discussing the possibilities for further development.
2. An overview of preceding studies and position of the current study
2.1. Agent-based land use-transport interaction model
Changes in land use, including urbanisation, stem from various driving forces (e.g. social, economic, political, and physical factors) and complex interactions among them (Gimblett et al. Citation2001; Mitsuda and Ito Citation2011; Meyfroidt et al. Citation2018). The basic principle, that land use influences travel behaviour, and vice versa, has been acknowledged by many researchers and is supported by empirical findings (Batty et al. Citation1999; Acheampong and Silva Citation2015; Kii et al. Citation2016). Moreover, interdisciplinary research has examined the laws that govern the relationship between urban travel behaviour and land use over the past half a century. However, in urban planning, there is a strong inclination to draw from experience because experiments in actual cities are nearly impossible.
Accordingly, considerable efforts have been made to develop models and simulations of changes in traffic and land use to explore urban growth strategies. They have led to the development of the land use-transport interaction (LUTI) model, which considers the interaction between land use by households and firms and transport as a system to support decision-making (Batisani and Yarnal Citation2009; Acheampong and Silva Citation2015; Ding Citation2019). Additionally, a concept that considers artificial systems such as cities as a form of self-organisation based on collective interaction among many autonomous factors and their adoptive behaviour has been attracting scholarly attention (Epstein and Axtell Citation1996; Batty Citation2007; Kwapień and Drożdz˙Citation2012; Rauws Citation2016). Drawing on complexity sciences, the agent-based model (ABM) is a unique modelling approach that posits that each agent learns their behaviour through interaction with the given environment, and can revise and improve it (Axtell and Epstein Citation1994; Epstein Citation2006; Gilbert Citation2008; Railsback and Grimm Citation2011; Shook and Wang Citation2015). The ABM has enabled us to simulate the bottom-up emergence of macro-level social phenomena, based on individual behaviour.
The application of the ABM to the modelling of land use began with the classical cellular automaton (CA), as employed in Schelling’s model of segregation, in which the condition of each cell represented a specific type of land use. This abstract model of urban morphology describes the emergence of simple patterns (Schelling Citation1971). Since then, owing to the development of a range of urban ABMs, complex land-use patterns in cities at the macro-level – including the emergence of cities and sprawl – have been expressed as forms of self-organisation employed by agents such as households and firms. These urban ABMs have long been developed and operated for studies on a range of urban issues. The SLEUTH (Slope, Land-cover, Exclusion, Urbanisation, Transportation, Hillshade) is an urban growth model based on CA, mainly used to analyse urban sprawl and explore future Scenarios of land-use changes and urban growth. It has been more application-orientated and calibrated with real-world data in the process of application to various city regions (Clarke et al. Citation1997; Silva and Clarke Citation2002; Rafiee et al. Citation2009; Zhou et al. Citation2019). The DUEM (Dynamic Urban Evolutionary Model) is an urban growth simulation software consistent with GIS data inputs, outputs, and related functionality and oriented to the analysis of spatial dynamics. It can accept a wide range of hypothetical and real applications, and present ways in which land uses can be structured through their life cycles (Batty et al. Citation1999; Xie and Batty Citation2005; Feng et al. Citation2016). The LEAM (Land use Evolution and impact Assessment Modelling) framework has been developed as a comprehensive urban planning support system to assess the expansion of regional scale sprawl and environmental changes (Deal and Schunk Citation2004; Deal et al. Citation2013, Citation2017). The ALMA (Agent based Land Market) is a new bilateral agent-based land market model, which explicitly simulates spatial and market interactions between buyers and sellers based on different decision rules in a homogeneous landscape. It demonstrates that urban expansion is led by changing the relative market power of buyers and sellers through land rents change (Filatova et al. Citation2009; Michels et al. Citation2020). Additionally, ABMs have been used for other urban context problems such as simulations of housing land use during population growth and decline (Haase et al. Citation2010), formation of slums (Patel et al. Citation2012), evaluation of housing policies for creating compact cities (Ma et al. Citation2013), and changes in volume of travel, parking requirements, and CO2 emissions, which might result from the large-scale uptake of shared and self-driving vehicles (Martinez and Viegas Citation2017).
2.2. Agent-based human interaction model
Jacobs (Citation1961) emphasised that a significant function of cities was to serve as lively and energetic places for people to interact. Oldenburg (Citation1989) argued that a ‘third place’, comprising streets, squares, and public facilities where people could conveniently gather and interact, was essential to making cities vibrant. Recently, several studies have suggested that in cities that are socially tolerant and have concentrations of diverse residents, the creativity produced by strong human interaction fosters economic growth through improvements in productivity and innovation (Florida Citation2005; Belitski and Desai Citation2016).
The benefits of interaction are not only economic; cities that become crucibles with diverse, creative populations offer rich cultural and entertainment experiences (Florida et al. Citation2011; Bertolini Citation2020). Consequently, more cities are aiming for smart growth and have introduced policies such as mixed land use, increased walkability, and promotion of population concentration (Henderson Citation2010; Hrelja et al. Citation2020). The emergence of this type of human interaction has created a framework in which the social and economic activities of the city are larger than the sum of its constitutive elements (i.e., the activities of individuals and groups).
The ABM is useful in exploring this type of urban system because it can simulate complex social phenomena. Accordingly, research on ABMs has focussed on the relationship between urban forms and human interactions. Spencer (Citation2012) examined the influence exerted by a place on the evolution of social networks through human interaction, using an ABM of social dynamics drawn from evolutionary economic geography. Liu and Silva (Citation2013) developed a spatially explicit model of the market dynamics of the location of firms and households, based on the strength of human interaction, to evaluate industrial policies for sustainable development. Malik et al.’s (Citation2015) creative urban model facilitated the detailed examination of the dynamism of the formation of creative clusters by setting agents with multiple attributes. The model suggested the possibility that knowledge spillover through human interaction induces a bottom-up emergence through the pursuit of social fairness.
2.3. Where is this study situated?
Through a simulation using an abstract model based on a regional city in Japan, Nagai and Kurahashi (Citation2021) introduced a new perspective on bottom-up constraints in dispersed habitation in urban peripheries through the benefits of productive human interaction at the micro level, drawing from the two conceptual frameworks of the ABM studies mentioned above. However, considering that many Japanese cities have already expanded, owing to motorisation (Eaton and Eckstein Citation1997), the effectiveness of a policy of maintaining a concentrated urban structure is doubtful. Additionally, Japan is mountainous, with a relatively small amount of habitable land and a declining population (Koike et al. Citation2000; Ministry of Land, Infrastructure and Transport Citation2017). Therefore, it is unrealistic to construct new concentrated cities in Japan.
Against this background, this study contributes to the literature through our dynamic urban ABM, spatially explicit simulation of Scenarios in which the existing dispersed habitation in urban peripheries is dissolved. By integrating the sub-model components of travel behaviour, relocation, and human interaction and by linking input and output, our model simultaneously included the social complexity of human behaviour and urban forms while stylising them. It enabled us to discuss the bottom-up dissolution of dispersed habitation related to changes in urban form at the macro-level caused by the collective behaviour of individual residents at the micro-level.
Furthermore, the introduction of trams is a well-known method of providing an alternative to privately owned vehicles in cities, to improve the urban living environment by reducing traffic jams and air pollution, and saving energy. It is easier to lay tracks for trams than for conventional trains. Trams are being increasingly introduced as a method of transport for short distances, particularly in European cities. They are also being reintroduced in Japan (Oba et al. Citation2008; Utsunomiya Citation2016). Additionally, by modelling the introduction of the tram to connect city centres, this study attempted to overcome the limitations of Nagai and Kurahashi (Citation2021), who discussed only the conventional railway network connecting city centres to suburbs.
3. Agent-based model of urban dynamics
The experimental model examined in this study uses the urban dynamics model presented by Nagai and Kurahashi (Citation2021) as its basic framework, and develops it by changing the conditions under which the simulation begins, diversifying the transport means and refining its parameters. Specifically, the artificial society model – spatially and explicitly – expresses the agents as both individuals using the transport network and relocating households. The model aims to abstract actual social phenomena by focussing on changes in urban land use patterns caused by the autonomous behaviour of urban residents. However, it does not consider irregular changes in land prices due to the influence of real-estate market dealings or direct urban policies. Furthermore, to enhance its applicability to areas other than those examined in the study, the model does not consider geographical conditions such as topography and climate, generational differences among households and individuals, and preferences for a particular behaviour. The outline of the experimental model is described based on ODD protocols (Railsback and Grimm Citation2011).
3.1. Purpose
The ABM simulates the effects of the relationships between the installation of hub facilities for urban residents, policies for promoting resident interaction, and the introduction of trams for dispersed habitation in urban peripheries through the autonomous behaviour of each resident. Additionally, we aim to gain insights into the micro–macro linkage in the urban system in various Scenarios through the simulation.
3.2. Entity and scale of the experimental model
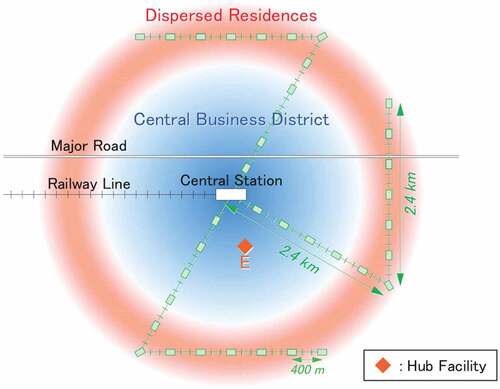
The entity is a two-dimensional urban scheme with active household agents, both of which are spatially explicit. shows the outline of the urban scheme. It abstracts a typical regional city in Japan. The central business district (CBD) and the commuter town in the suburbs along the railway line was originally planned and built according to a zoning arrangement intended to separate residents’ work lives from their personal lives. The commuter town was then transformed through repeated relocations, autonomously executed by households because of motorisation. Consequently, many residences are dispersed in low-density surrounding the CBD (Tsai Citation2005; Ding et al. Citation2022). As shown in the figure, there are two stations, a railway line that connects them, and a major road. To simplify the model, traffic control, such as traffic lights at crossings and one-way roads in the urban scheme, was not considered. It was assumed that the roadway and sidewalks were evenly distributed in high-density.
Figure 1. Dispersed habitation urban scheme.
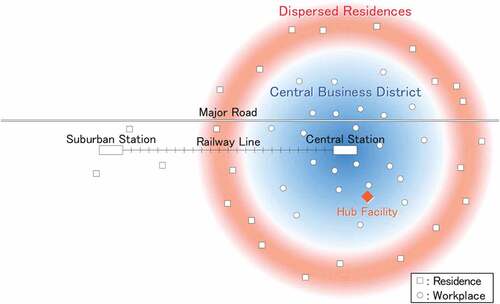
The number of household agents was set at 1,000. As one household agent corresponds to 10 real households, the model simulated the behaviour of 10,000 real households. The same number of workplaces was placed in the CBD, in accordance with the normal distribution around the central station. Additionally, one hub facility (HUB), which would attract diverse activities to the city centre and can be conveniently used by urban residents, was placed in the CBD. Whether the HUB is run by the public or a private sector body or a combination of the two is inconsequential. A radius of 500 m around the HUB was considered in implementing policies to promote interactions.
3.3. State variables of the household agent
The state variables of the household agent were as follows:
Coordinates of the residence
Coordinates of the workplace
Currently selected linked trip
Value list of the linked trip
As the study focussed on changes in land use patterns through household relocation, it adopted the assumption of an exogenous workplace. The coordinates of the workplace corresponding to a certain household agent were always fixed. A linked trip is a series of travel behaviours, beginning at the starting point till the arrival at the destination. An unlinked trip comprises each method of transport serving as a constitutive element of a linked trip.
3.4. Process overview and scheduling
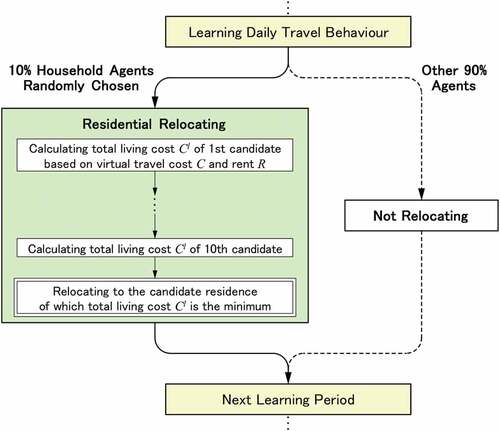
The household agents engage with the corresponding travel behaviour to commute to work or place of study, based on the value list of the linked trip in the urban scheme. Following the learning period, in which the process is repeated 30 times, the transport methods converge into a single method. Subsequently, 10 candidates for relocation, which are within, or not very far from, the distribution of the residences as a whole, are proposed to a few randomly selected household agents. They relocate to the candidate with the lowest total cost of living. The total cost of living is calculated on the basis of two factors: travel cost and rent. These relocations change the land use pattern.
In a single simulation round, the relocation cycle is repeated 20 times. It is assumed that a single relocation cycle in the simulation (30 rounds of travel behaviour in the model) corresponds to two years in the real world. Thus, a single round of simulation corresponds to 40 years in the real world. It implies that household agents would relocate twice, on average, over 40 years. As relocation tends to occur amid a change in family structure, such as a birth or separation (Kulu and Milewski Citation2007; Yamada and Deguchi Citation2016), this scheduling is sufficiently valid.
3.5. Sub-model of travel behaviour
The household agent’s travel behaviour was spatially and explicitly processed on the urban scheme to reflect the empirical finding that urban variables such as the travel distance, the available means of transport, and transport density influence travel behaviour in the model. Each travel behaviour of a household agent followed the linked trip it selected.
Six types of linked trips were selected for the model, as shown in . The most main means of transport among the unlinked trips, which constitute a linked trip, is referred to as the ‘representative means of transport’ of the linked trip. The representative means of transport for most household agents were privately owned vehicles, reflecting the advanced state of motorisation in the real world at the start of the simulation. Each agent started from their residence. Once all the household agents reached their workplace, they began leaving for the HUB. After spending some time there, they went back to their residence. Once they returned to their residence, the total travel cost, , was calculated with the following formula:
Figure 2. Six types of linked trips.
where ,
,
, and
represent time, fees, fatigue, and interaction values, respectively; and
,
,
, and
represent each agent’s preference bias. The study emphasised homogeneity rather than differences among household agents; thus, it was assumed that all household agents had equal preference bias. The
-greedy method – a method for reinforcement learning – was used by household agents to explore transport methods, reflecting the finding that individuals do not select transport methods and routes rationally, based on complete information, but are often bound by habitual rationality (Fujii Citation2008). Based on the cost, the value of the linked trip, selected as the
-th trip from the value list,
, was updated according to the following formula:
The next travel behaviour followed the linked trip selected from the value list. The household agents converged the linked trips to a single trip after the learning period, in which they repeated their travel behaviour 30 times.
3.5.1. Traffic jams
Traffic jams during morning and evening peak hours are a serious problem worldwide. Traffic jams incur a variety of social costs, including an increase in time loss, financial cost, unpleasantness, fatigue, and air pollution (Behan et al. Citation2008; Zhang et al. Citation2019). To reflect a simplified road transport network, the study assumed that traffic jams were generated as a consequence of local interactions among agents. Specifically, a traffic jam is generated when the number of household agents travelling in their privately owned vehicles in the neighbourhood simultaneously as a household agent travelling in a privately owned vehicle exceeds a certain limit. Consequently, the travelling speed of the household agent in question decreases. The reduction in speed due to traffic jams increases time loss, financial costs, and fatigue costs. Additionally, the fluctuation in travelling time, owing to traffic jams, is considered an additional cost that cannot be ignored as it could be a factor for additional risk or uncertainty. Furthermore, its influence becomes more noticeable in proportion to the severity of the traffic jams (Bhat and Sardesai Citation2006; Mori et al. Citation2015). Based on these findings, the traffic jam fatigue cost was added to the household agents who were in the middle of a traffic jam.
3.5.2. Interaction value
A 500 m radius around the HUB was considered in the implementation of policies for promoting interaction. This area was under the influence of diverse activities. The distance was set with reference to the concept of ‘Ped Shed’ (Hebbert Citation2003). When household agents travelling on foot or on a bicycle interacted face-to-face within this area (in other words, when they geographically agglomerated on the model plain), a useful, efficient, and creative cultural or entertaining experience was generated. It was assumed that this benefit was enjoyed as an ‘interaction value’. The urban environment is improved (via innovation, entrepreneurship, and economic productivity) when land use within a city is diversified and interaction density increases (Knudsen et al. Citation2008; Malik et al. Citation2015). The study emphasised the positive feedback loop in which many people, staying in a particular place, attracted others and enhanced the strength of activities in that place (Kakoi et al. Citation2010). Accordingly, the interaction value, , was measured using the formula given below:
where represents the number of other household agents who travel on foot or on bicycle within the
metre radius of the household agent in question.
represents the interaction promotion coefficient. The result of multiplying the interaction value,
, with the preference bias,
, is cancelled out by the total travel cost. The interaction promotion coefficient can be regarded as the degree of collaborative effort, resulting in further interaction, in proportion to the accumulation of pedestrians within the area in question. Empirical findings demonstrate that the characteristics required for an urban environment to feature valuable human interaction include the following (Knudsen et al. Citation2008; Drennan and Kelly Citation2010; Florida et al. Citation2011; Landry Citation2012; Malik et al. Citation2015; Belitski and Desai Citation2016; Bertolini Citation2020)
Affordable mobility
Mixed land/building use
Social diversity
Social tolerance
Consequently, the interaction promotion coefficient can be enhanced via collaborative efforts in the area as a whole, such as the development of pleasant walkways and cycle lanes, the expansion of diverse and attractive shops and places, and the hosting of open events that offer mobility, intermingling, diversity, and tolerance. When the coefficient increases, the benefits of mobility with interaction also increase, which further cancels out the total travel costs. Consequently, this coefficient can be regarded as a coefficient of gain. Policies for improving the interaction promotion coefficient are, hereafter, referred to as ‘interaction policies’. An excessive accumulation of pedestrians or cyclists could result in harm, equivalent to a traffic jam caused by automobiles. However, the study did not consider such negative effects as it assumed that the policy of developing pleasant walkways and cycle lanes to promote interaction would ease the congestion.
3.6. Sub-model of relocation
After all the household agents converged the transport methods into a single method, having completed the learning period, we randomly selected 10% of the household agents for relocation. The relocation occurred spatially, explicitly in the urban scheme. The household agents in question were presented with a list of 10 destinations within, or not very far from, the distribution of the residences as a whole. Each agent relocated to the destination with the smallest assumed living cost. In the process, households faced several restrictions in satisfying their preferences (Moeckel Citation2017). Among them, travel cost (or travel time) and rent were emphasised (Iacono et al. Citation2008; Hunt Citation2010; Pagliara et al. Citation2010; Taniguchi et al. Citation2010; Acheampong and Silva Citation2015). Thus, the assumed total living cost of the destination, , was calculated as follows:
where represents the assumed total travel cost to the destination. The household demanded a high level of accessibility to work and to places of shopping and leisure activities (Iacono et al. Citation2008). Additionally, travel behaviour before relocation became a habit and influenced the relocation destination and the travel behaviour after relocation (Fujii Citation2008). Therefore, the total assumed travel cost,
, was calculated by measuring the assumed travel behaviour, starting from the destination and based on the transport method on which the household agent converged through learning.
refers to rent of the destination. Owing to improvements in efficiency and productivity caused by accumulation, there is a positive correlation between the degree of development concentration and rent (Drennan and Kelly Citation2010; Koster and Rouwendal Citation2012). Therefore, the rent of the destination,
, was calculated as follows:
where and
refer to the number of residences and workplaces, respectively, within the radius,
, of the destination.
represents the size of the area in question.
and
represent consumption areas by residence or workplace, respectively.
and
represent transformation coefficients for the rent of the residence or workplace, respectively. illustrates how the relocation of household agents is processed in the model with reference to the assumed total living cost of the destination,
(and the assumed total travel cost
and rent
). Thus, the rent of the destination increased in proportion to the accumulation of residences and workplaces. Specifically, local interactions among the households, and between the household and the environment, influenced the land use pattern through changes in rent.
Figure 3. Process of relocation of household agents.
3.7. Initialisation and input
lists the parameter settings for the urban scheme and household agents. The setting of these values, particularly the currency conversion coefficients, requires utmost care because setting this coefficient leads to automatic changes in profit evaluation. Consequently, the study carefully set these values, with reference to various sources, including socio-demographic data and other statistics published by official institutions and previous studies while assuming a typical regional city in Japan. The validity of the model, including these values, was supported by the contrast between the simulation results and the real city, based on pattern-oriented modelling (POM).
Table 1. Parameter settings based on socio-demographic data and other statistics published by official institutions (Ministry of Land, Infrastructure and Transport Citation2017; MIAC Citation2017) and previous studies (Taniguchi et al. Citation2010; Nagai and Kurahashi Citation2021).
3.8. Observation and evaluation
Changes in urban form were evaluated by observing the results of the simulation of each Scenario with reference to the following indicators:
Proportion of each representative transport method
Total CO
emissionsFootnote1 (expressed in percentage using the level at the start of the simulation as the base)
Average travel time
Standard deviation of residence distribution (east–west and north–south)
Distribution map of residences (coloured using the representative transport method)
Each Scenario was executed eight times under the same conditions. The proportion of each representative transport method, total CO emissions, average travel time, and standard deviation of the residence distribution are the averages of the execution results. The distribution map of residence was arbitrarily generated from these execution results.
4. Experiment 1: simulation from dispersed habitation
4.1. Conditions for experiment 1
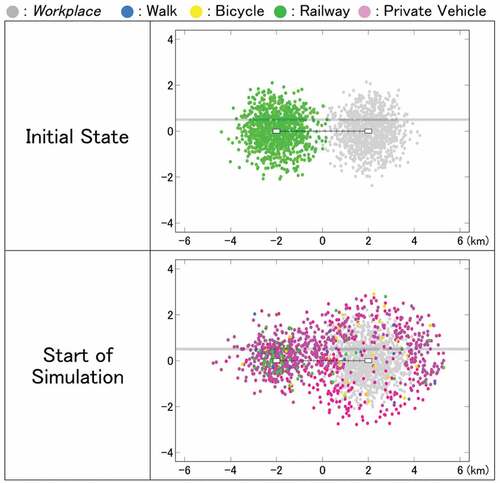
This section reports the simulation experiment. It started in the state where dispersed habitation had already progressed. The lower row in shows the value of each indicator at the start of the simulation. The lower figure in denotes the distribution of residences and workplaces at that point. Most residences were dispersed in low-density surrounding the CBD and approximately 90% of the households used privately owned vehicles. It shows that the state, after the relocation cycle, was repeated 20 times (equivalent to 40 years) from the initial state, in which all residences were concentrated around a suburban station, in accordance with the zoning arrangement intended to separate work and life (see the upper row of and the upper figure in ). Under these initial conditions, a simulation experiment was performed on the effect of installing a HUB, which is open to urban residents, and the implementation of interaction policies around it. There are two options for the location of the HUB:
Figure 4. Distribution of residences at the initial state and the start of the simulation.
A: No installation (no implementation of interaction policies)
E: Near the central station, 0.5 km south and 0.5 km east of it
Table 2. Value of each indicator at the initial state and the start of the simulation.
Four interaction promotion coefficients were assumed: 0, 10, 20, and 30. These experimental Scenarios are denoted as ‘Scenario SA’ and ‘Scenarios SE0–SE30’ by combining ‘S’, the initial letter in ‘sprawl’, and the interaction promotion coefficient.
4.2. Results of experiment 1
presents the results of the quantitative indicators of Scenarios SA and SE0–SE30. depicts the final distribution of residences in those Scenarios. In Scenario SA, the number of households using privately owned vehicles increased to 95% and dispersed habitation around the CBD expanded. In Scenarios SE0–SE30, although interaction policies were implemented, the households using privately owned vehicles did not shift to other means of transport and there was no improvement in dispersed habitation. Overall, in all the Scenarios, as in Scenario SA, the number of households using privately owned vehicles increased and dispersed habitation intensified.
Figure 5. Final distribution of residences in Experiment 1.
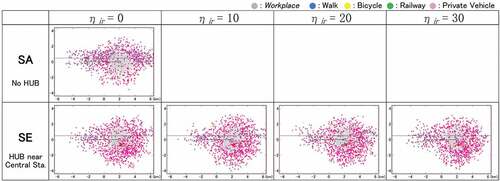
Table 3. Results of each indicator in experiment 1.
5. Experiment 2: simulation assuming the introduction of tram
5.1. Conditions for experiment 2
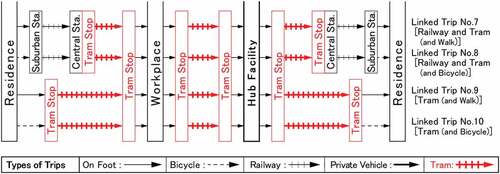
This section reports the simulation experiment that assumed the introduction of tram. Following the ‘Karlsruhe model’ (De Bruijn and Veeneman Citation2009), it was assumed that the tramline would use the existing railway tracks. Specifically, as indicates, three tramlines were radially installed from the central station and their ends passed through some of the dispersed residences that surrounded the CBD. As is done for conventional tramlines, stops were installed at 400 m intervals on each route.
Figure 6. Schematic of tramlines.
The household agents could choose a linked trip with both the railway and tram or a linked trip combining the tram with walking or cycling (as shown in ). As in case of the previous experiment, this one was conducted under conditions in which two location options for the HUB: A and E, were combined with four interaction promotion coefficients. These experimental Scenarios are denoted as ‘Scenario SAt’ and ‘Scenarios SEt0–SEt30’ by combining ‘S’, the initial letter in ‘sprawl’, and ‘t’, the initial letter in ‘tram’ and the interaction promotion coefficient. Scenario SE30t+, which doubled the execution period of Scenario SE30t, was also implemented.
Figure 7. Linked trips using tram.
5.2. Results of experiment 2
presents the results of the quantitative indicators for Scenarios SAt and SEt0–SEt30. illustrates the final distribution of residences in those Scenarios. In Scenario SAt, the number of households using privately owned vehicles increased and dispersed habitation around the CBD expanded, similar to Scenario SA. In the Scenario SEt series, from Scenario SEt0 to SEt20, the number of households using privately owned vehicles increased and dispersed habitation expanded, similar to Scenario SAt. However, in Scenario SE30t, in which interaction policies were encouraged, more than half of the households that used privately owned vehicles shifted to tram use. The total number of households using the tram reached approximately 50%. Owing to this shift, total CO emissions were reduced by more than 40%.
Figure 8. Final distribution of residences in experiment 2.
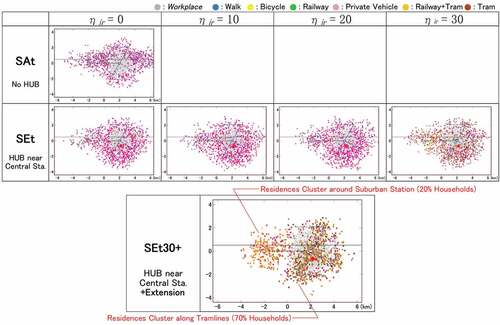
Table 4. Results of each indicator in experiment 2.
Furthermore, in Scenario SEt30+, in which the execution of Scenario SEt30 was extended, the number of households using the tram reached approximately 90% and total CO emissions significantly decreased, by approximately 80%.
Regarding the distribution of residences, two clusters emerged. One was centred around a suburban station comprising households that used a combination of railways and trams for commuting (approximately 20% of all the households). The other was a cluster along the tramlines, stretching from the centre of the CBD to the periphery, comprising households that used only the tram for commuting (approximately 70% of all the households).
6. Discussion
6.1. Discussion of experiment results
The combination of the appropriate placement of a hub facility that urban residents can conveniently access (near the central station) and policies to promote human interaction was demonstrated to be exceptionally effective in restraining the use of privately owned vehicles and dispersed habitation when work and life were separated at the time of policy implementation (Nagai and Kurahashi Citation2021). However, when dispersed habitation was at an advanced stage, these policies could not restrain its increase or the rise in the use of privately owned vehicles. It suggests that the worsening of the urban environment due to low-density suburban habitation and lifestyles, dependent on privately owned vehicles, is deep-rooted and difficult to reverse.
Additionally, this policy measure, when used alone, achieves the results described above when the tram service connects the CBD to a group of residences distributed in low-density surrounding it. By contrast, when the combination of tram use and appropriate placement of a hub facility was augmented by interaction promotion policies in the area in question, we observed a rapid shift from privately owned vehicles to trams as if a ‘phase transition’ had occurred. Moreover, CO emissions were reduced and dispersed habitation improved. If these policies are maintained over long periods, a significant improvement in the urban environment can be achieved. Thus, to return to the first of the questions we had posed in the Introduction, improvements in dispersed habitation in peripheral urban areas could be modelled based on the micro–macro linkage between spatially explicitly autonomous active agents and a planar urban scheme. This fact also suggests that a combination of the appropriate placement of the hub facility, interaction promotion policies, and the introduction of tram can ensure the effective management of sustainable urban growth.
Nevertheless, these policies will remain ineffective unless they are implemented on a relatively large scale. Interaction promotion policies induce walking in urban areas through incentives such as convenience, safety, and a rich experience. Similarly, many successful instances of tram introduction combine the tram with other policies that are beneficial for pedestrians. For example, in Karlsruhe, Germany, parts of tramlines were turned into a transit mall, which restricted car traffic (De Bruijn and Veeneman Citation2009). In Toyama, Japan, efforts were made to revitalise the shopping area along the tramline, which is far from the central station (Oba et al. Citation2008).
Thus, our experiment demonstrated that combining the introduction of the tram with policies that, for instance, induce pedestrian activities before and after tram use, significantly improves the urban environment. Here, regarding our second question in the Introduction, we can answer that residents’ short-distance public transport use and walking in the city centre improved dispersed habitation. Furthermore, for the third question, interaction promotion policies, which are collaborative efforts for the attraction of activities and closely integrated and cooperated with transportation, induced such behaviour of residents. As the implementation of interaction promotion policies requires collaborative efforts and costs from the local area, it is not simple, given the consensus building required. However, if we consider that not only urban residents but also businesses in the area would benefit from the liveliness induced by the accumulation of pedestrians, then the aim is not entirely unrealistic.
Regarding the distribution of residences in the same Scenario, the cluster of residences that emerge along the tramlines diverges from the original polycentric and rational land use based on the separation of work and life. However, it can be positively evaluated because of the resulting compact urbanisation.
First, if a form of ‘living in the city’ is realised in which short-distance public transport plays a major role and people live close to their workplace, residents will be liberated from the problems posed by rush hour and air pollution.
Second, mixed land use results in a wide range of social activities in the city centre, which supports its revitalisation. Therefore, the concentration of different activities will lead to the ‘urbanisation economies’ – a complementary economic effect (Krugman Citation1996; Beeson Citation2017) – and a creative urban environment (Knudsen et al. Citation2008; Malik et al. Citation2015; Belitski and Desai Citation2016).
Regarding the application of the TOD model at the regional city scale, our experiment revealed both a limitation and a vindication of the basic principles and policies of TOD. To combat an existing area of dispersed development and car dependency, a coordinated package of TOD as a site-specific development strategy and collaborative measures needs to be ‘retrofitted’. The first of the minimum necessary elements for the success of the ‘retrofit’ was the introduction of trams and high-quality public transportation. The second was what we called interaction promotion policies, which refer to the attraction of activities to areas around transportation nodes, that is, land use closely integrated and cooperated with transportation.
6.2. Testing the validity of the simulation model
When simulating real systems that are considered complex, including cities, abstracting the model as much as possible enables capturing the essential factors (Axelrod Citation1997; Epstein Citation2006). Therefore, the validity of the model could be ameliorated not only by including a few of the new parameters or changing their initial values but also by excluding a few of them. Additionally, the validity of the ABM needed to be tested to investigate whether it captured the basic characteristics of the real system, owing to the nature of emergence in a complex, self-organising system (Wu Citation2002; Drchal et al. Citation2016). Pattern-oriented modelling is an effective method to test validity in this case. It evaluates a model’s validity by examining whether the emergent pattern output, which is not directly defined as a parameter setting, recreates the observational patterns that characterise the real system, which is the subject of modelling (Railsback and Grimm Citation2011).
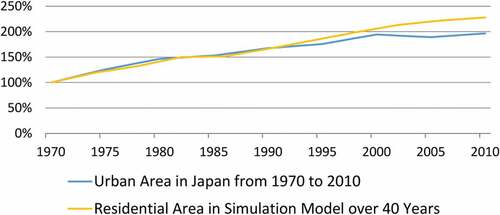
In , the shift in the urban area in Japan, over 40 years (1970–2010) (yellow line) is superimposed on the shift in the residential area in the model over the 20 relocation cycles (equivalent to 40 years) from the initial state discussed in ‘Section 4. Experiment 1’ (blue line). The two show extremely similar shifts, indicating that the result of the Scenario can be regarded as a demonstration that urban areas have consistently expanded during Japan’s rapid economic growth (Eaton and Eckstein Citation1997). Additionally, the distribution of residences in the Scenario considerably changed from a zoning schema, which separated work and life, into dispersed habitation, in which most residences surrounded the CBD, as shown in . This situation can be regarded as an example of the growth process of concentric, low-density, suburban habitation in accordance with the single-centred urban model that Alonso (Citation1964) introduced and which has been supported by many subsequent studies.
Figure 9. Shift in urban area in Japan and residential area in the model.
Furthermore, most of the household agents living in a dispersed manner changed their means of transport from railway to privately owned vehicles. It can be regarded as a reflection of the tendency in regional Japanese cities during the same period when the major means of transport shifted from railways to privately owned vehicles, saturating the road networks (Ministry of Land, Infrastructure and Transport Citation2017). Additionally, Scenario SAt in ‘Section 5. Experiment 2’ demonstrates that introducing the tram to connect the CBD to a group of dispersed residences surrounding it could not, by itself, restrain the increase in dispersed habitation and privately owned vehicle use. It may explain why the development of public transport in suburban, low-density residential areas did not prevent sprawl or the use of privately owned vehicles in large cities such as in Atlanta, US (Bertaud and Richardson Citation2004) and Madrid, Spain (Garca-Palomares Citation2010).
This model does not aim to precisely recreate a real city but analyses the highly abstract mechanism of urban dynamics through a small number of simple elements and rules. Representatively, possible choices for the agents in relocation within the system were constrained mainly by urban planning laws or policies constraints on the basis of interaction promotion policies and introduction of tram. The findings of the modelling are based on such large degrees of freedom available to the agents. Nevertheless, several social phenomena (observational patterns) that were not directly built into the model were recreated. It suggests that the model, its setting, and its experimental results are sufficiently valid to examine the behaviour of a real city.
7. Summary
7.1. Research outcomes
This study proposed an exploratory urban morphology ABM to simulate a combination of the establishment of a hub facility that urban residents can conveniently access, policies to promote human interaction around it, and the introduction of tram that impacts dispersed habitations in peripheral urban areas. The stylised abstract urban model, which includes autonomous agents, provides insight into the micro–macro linkage in dispersed habitation, which is not desirable in any urban system.
A significant contribution of the proposed model is its introduction of a new perspective on how to improve the urban environment, by inducing a shift from dispersed habitation to concentrated habitation in a bottom-up manner through behaviour at the micro level, that is, via productive human interactions in an urban setting. Specifically, the model experimentally demonstrated a trade-off between creation of high-density active travel by tram and on foot within an existing area of dispersed development and increased dispersed habitation. It implies a vindication of principles and policies of TOD, which underlines the integration and cooperation of transportation and land use.
7.2. Future challenges
One of the ways of developing the model is to introduce demographics. In this study, the number of households was kept constant throughout the model execution period; however, in reality, demographics differ from one city to another. For example, in Europe, urban growth has been discussed in conjunction with population increase. By contrast, in regional Japanese cities, depopulation, as a consequence of low birth rates, and the ageing population have become major issues. The influence that such demographics would exert on policies for restructuring urban spaces is yet unknown and deserves further exploration.
Additionally, there may be concerns over the assessment whether the model settings and results can be applied in real-world situations – a problem frequently encountered when simulation is applied in the social science field. For example, property law might significantly affect the results if the heterogeneity of households in income and the real-estate market, which were not implemented for simplicity in this model, were considered. The same might be said for land availability, which, in the real world, varies according to geographical conditions and previous development. At future stages of the model development, these potential issues would need to be addressed.
Disclosure statement
No potential conflict of interest was reported by the author(s).
Additional information
Funding
Notes on contributors
Hideyuki Nagai
Hideyuki Nagai received his Ph.D. degree from University of Tsukuba, Japan, in 2018. In 2021, he joined Kyoto Arts and Crafts University, where he is currently a fixed-term lecturer. His research interests include urban and architectural design and computational social science.
Setsuya Kurahashi
Setsuya Kurahashi received his Ph.D. degree from University of Tsukuba, Japan, in 2001. In 2006, he joined University of Tsukuba, where he is currently a professor of Graduate School of Business Sciences. His research interests include social simulation, artificial intelligence and history.
Notes
1. Calculated by multiplying the CO2 emissions per passenger per transport distance for privately owned vehicles and the railway (Ministry of Land, Infrastructure and Transport Citation2021) by the total travel distance of each transport method of all the household agents.
References
- Acheampong RA, Silva E. 2015. Land use–transport interaction modeling: a review of the literature and future research directions. J Transp Land Use. 8(3):11–38.
- Alonso W. 1964. Location and land use. toward a general theory of land rent. Cambridge (MA, USA): Harvard University Press.
- Angel S, Parent J, Civco DL, Blei A, Potere D. 2011. The dimensions of global urban expansion: estimates and projections for all countries, 2000–2050. Prog Plann. 75(2):53–107. doi:10.1016/j.progress.2011.04.001.
- Axelrod RM. 1997. The complexity of cooperation: agent-based models of competition and collaboration. Princeton (NJ, USA): Princeton University Press.
- Axtell R, Epstein J. 1994. Agent-based modeling: understanding our creations. Bull Santa Fe Inst. 9(4):28–32.
- Bacci ML. 2017. A concise history of world population. Hoboken (NJ, USA): John Wiley & Sons.
- Batisani N, Yarnal B. 2009. Uncertainty awareness in urban sprawl simulations: lessons from a small US metropolitan region. Land Use Policy. 26(2):178–185. doi:10.1016/j.landusepol.2008.01.013.
- Batty M. 2007. Cities and complexity: understanding cities with cellular automata, agent-based models, and fractals. Cambridge (MA, USA): The MIT Press.
- Batty M, Xie Y, Sun Z. 1999. Modeling urban dynamics through GIS-based cellular automata. Comput Environ Urban Syst. 23(3):205–233. doi:10.1016/S0198-9715(99)00015-0.
- Beeson PE. 2017. Agglomeration economies and productivity growth. In: Milles ES, McDonald JF, editors. Sources of metropolitan growth. Oxfordshire (UK): Routledge; p. 19–33. https://www.amazon.co.jp/Sources-Metropolitan-Growth-John-McDonald/dp/1138533319/ref=monarch_sidesheet
- Behan K, Maoh H, Kanaroglou P. 2008. Smart growth strategies, transportation and urban sprawl: simulated futures for Hamilton, Ontario. The Canadian Geographer/Le Géographe Canadien. 52(3):291–308. doi:10.1111/j.1541-0064.2008.00214.x.
- Belitski M, Desai S. 2016. Creativity, entrepreneurship and economic development: city-level evidence on creativity spillover of entrepreneurship. J Technol Transf. 41(6):1354–1376. doi:10.1007/s10961-015-9446-3.
- Bertaud A, Richardson HW. 2004. Transit and density: Atlanta, the United States and Western Europe. In: Christine Bae C-H, Richardson HW, editor. Urban sprawl in Western Europe and the United States. London (UK): Informa; p. 293–310. https://www.routledge.com/Urban-Sprawl-in-Western-Europe-and-the-United-States/Bae-Richardson/p/book/9781138266438
- Bertolini L. 2020. From “streets for traffic” to “streets for people”: can street experiments transform urban mobility? Transport Rev. 40(6):734–753. doi:10.1080/01441647.2020.1761907.
- Bhat CR, Sardesai R. 2006. The impact of stop-making and travel time reliability on commute mode choice. Transport Res Part B. 40(9):709–730. doi:10.1016/j.trb.2005.09.008.
- Calthorpe P. 1993. The next American metropolis: ecology, community, and the American dream. Princeton (NJ, USA): Princeton architectural press.
- Carmona M. 2021. Public places urban spaces: the dimensions of urban design. Oxfordshire (UK): Routledge.
- Caves RW. 2004. Encyclopedia of the city. Oxfordshire (UK): Routledge.
- Cervero R. 2004. Transit-oriented development in the United States: experiences, challenges, and prospects. Washington D.C. (USA): Transportation Research Board.
- Cervero R, Kockelman K. 1997. Travel demand and the 3Ds: density, diversity, and design. Transport Res Part D. 2(3):199–219. doi:10.1016/S1361-9209(97)00009-6.
- Clarke KC, Hoppen S, Gaydos L. 1997. A self-modifying cellular automaton model of historical urbanization in the San Francisco Bay area. Environ Plann B Plann Des. 24(2):247–261. doi:10.1068/b240247.
- Cotella G, Evers D, Rivolin UJ, Solly A. 2020. ESPON SUPER—sustainable urbanization and land-use practices in European regions. Luxembourg: ESPON EGTC.
- Curtis C. 2012. Delivering the’D’in transit-oriented development: examining the town planning challenge. J Transp Land Use. 5(3):83–99. doi:10.5198/jtlu.v5i3.292.
- De Bruijn H, Veeneman W. 2009. Decision-making for light rail. Trans Res Part A. 43(4):349–359.
- Deal B, Kim JH, Hewings GJ, Kim YW. 2013. Complex urban systems integration: the LEAM experiences in coupling economic, land use, and transportation models in Chicago, IL. In: Pagliara F, Bok M de Simmonds D, Wilson A, editors. Employment location in cities and regions. Berlin/Heidelberg (Germany): Springer; p. 107–131. https://link.springer.com/book/10.1007/978-3-642-31779-8”atlanta
- Deal B, Pan H, Timm S, Pallathucheril V. 2017. The role of multidirectional temporal analysis in scenario planning exercises and planning support systems. Comput Environ Urban Syst. 64:91–102. doi:10.1016/j.compenvurbsys.2017.01.004.
- Deal B, Schunk D. 2004. Spatial dynamic modeling and urban land use transformation: a simulation approach to assessing the costs of urban sprawl. Ecol Econ. 51(1):79–95. doi:10.1016/j.ecolecon.2004.04.008.
- Ding R. 2019. The complex network theory-based urban land-use and transport interaction studies. Complexity. 2019:1–14. doi:10.1155/2019/4180890.
- Ding X, Yu S, Miao Y, Wang C, Jin Z. 2022. Types, modes and influencing factors of urban shrinkage: evidence from the Yellow River Basin, China. Sustainability. 14(15):9213. doi:10.3390/su14159213.
- Drchal J, Čertickỳ M, Jakob M. 2016. VALFRAM: validation Framework for Activit-ybased Models. J Artifl Soc Social Simul. 19(3):5. doi:10.18564/jasss.3127.
- Drennan MP, Kelly HF. 2010. Measuring urban agglomeration economies with office rents. J Econ Geogr. 11(3):481–507. doi:10.1093/jeg/lbp066.
- Duranton G, Puga D. 2004. Micro-foundations of urban agglomeration economies. Handbook Reg Urban Econ. 4:2063–2117.
- Eaton J, Eckstein Z. 1997. Cities and growth: theory and evidence from France and Japan. Reg Sci Urban Econ. 27(4–5):443–474. doi:10.1016/S0166-0462(97)80005-1.
- Elkin T, McLaren D, Hillman M. 1991. Reviving the city: towards sustainable urban development. Friends of the Earth Trust. London (England): Continuum International Publishing. https://www.amazon.com/Reviving-City-Towards-Sustainable-Development/dp/090596683X
- Epstein JM. 2006. Generative social science: studies in agent-based computational modeling. Princeton (NJ, USA): Princeton University Press.
- Epstein JM, Axtell R. 1996. Growing artificial societies: social science from the bottom up. Cambridge (MA, USA): MIT Press.
- Ewing R, Cervero R. 2010. Travel and the built environment: a meta-analysis. J American Plann Assoc. 76(3):265–294. doi:10.1080/01944361003766766.
- Ewing R, Tian G, Lyons T, Terzano K. 2017. Trip and parking generation at transit-oriented developments: five US case studies. Landsc Urban Plan. 160:69–78. doi:10.1016/j.landurbplan.2016.12.002.
- Feng Y, Liu Y, Batty M. 2016. Modeling urban growth with GIS based cellular automata and least squares SVM rules: a case study in Qingpu–Songjiang area of Shanghai, China. Stochastic Environ Res Risk Assess. 30(5):1387–1400. doi:10.1007/s00477-015-1128-z.
- Filatova T, Parker D, Van der Veen A. 2009. Agent-based urban land markets: agent’s pricing behavior, land prices and urban land use change. J Artifl Soc Social Simul. 12(1):3.
- Florida R. 2005. Cities and the creative class. Oxfordshire (UK): Routledge.
- Florida R, Mellander C, Stolarick K. 2011. Creativity and prosperity: the global creativity index. Toronto (ON, Canada): University of Toronto.
- Frenkel A, Ashkenazi M. 2008. Measuring urban sprawl: how can we deal with it? Environ Plann B Plann Des. 35(1):56–79. doi:10.1068/b32155.
- Fujii S. 2008. An empirical test of hypothesis on influence of travel behavior on residential choice behavior: a fundamental study on transportation measures for promoting compact cities. JSTE Journal of Traffic Eng. 43(6):53–62.
- Garca-Palomares JC. 2010. Urban sprawl and travel to work: the case of the metropolitan area of Madrid. J Transport Geogr. 18(2):197–213. doi:10.1016/j.jtrangeo.2009.05.012.
- Gerland P, Raftery AE, Ševčková H, Li N, Gu D, Spoorenberg T, Alkema L, Fosdick BK, Chunn J, Lalic N, et al. 2014. World population stabilization unlikely this century. Science. 346(6206):234–237. doi:10.1126/science.1257469
- Gilbert N. 2008. Agent-based models. Sage: Singapore.
- Gimblett R, Daniel T, Cherry S, Meitner MJ. 2001. The simulation and visualization of complex human–environment interactions. Landsc Urban Plan. 54(1):63–79. doi:10.1016/S0169-2046(01)00126-8.
- Haase D, Lautenbach S, Seppelt R. 2010. Modeling and simulating residential mobility in a shrinking city using an agent-based approach. Environ Model Softw. 25(10):1225–1240. doi:10.1016/j.envsoft.2010.04.009.
- Healey P. 2017. Making better places: the planning project in the twenty-first century. London (England): Bloomsbury Publishing.
- Hebbert M. 2003. New urbanism? The movement in context. Built Environ. 29(3):193–209. doi:10.2148/benv.29.3.193.54285.
- Heilig GK. 2012. World urbanization prospects: the 2011 revision. New York (NY, USA): United Nations, Department of Economic and Social Affairs (DESA), Population Division.
- Henderson JV. 2010. Cities and development. J Reg Sci. 50(1):515–540. doi:10.1111/j.1467-9787.2009.00636.x.
- Howard E. 1902. Garden cities of to-morrow. 2nd ed. Swan Sonnenshein: London, England.
- Hrelja R, Olsson L, Pettersson-Löfstedt F, Rye T. 2020. Transit oriented development (TOD): a literature review. In: Nationellt kunskapscentrum för kollektivtrafik. Vol. K2. Lund (Sweden). https://www.k2centrum.se/en
- Hunt JD. 2010. Stated preference examination of factors influencing residential attraction. In: Pagliara F, Preston J, Simmonds D, editors. Residential location choice. Berlin/Heidelberg (Germany): Springer; p. 21–59. https://link.springer.com/book/10.1007/978-3-642-12788-5
- Iacono M, Levinson D, El-Geneidy A. 2008. Models of transportation and land use change: a guide to the territory. J Plann Lit. 22(4):323–340. doi:10.1177/0885412207314010.
- Ibraeva A, de Almeida Correia Gh, Silva C, Antunes AP. 2020. Transit-oriented development: a review of research achievements and challenges. Trans Res Part A. 132:110–130.
- Irwin EG. 2010. New directions for urban economic models of land use change: incorporating spatial dynamics and heterogeneity. J Reg Sci. 50(1):65–91. doi:10.1111/j.1467-9787.2009.00655.x.
- Jacobs J. 1961. The death and life of great American cities. New York (NY, USA): Random House.
- Kakoi M, Nakamura R, Saito S. 2010. Causal structure modeling of consumer’s decision-making on selection of commercial facilities. Fukuoka Univ econ rev. 54(3–4):241–256.
- Kii M, Nakanishi H, Nakamura K, Doi K. 2016. Transportation and spatial development: an overview and a future direction. Transport Policy. 49:148–158. doi:10.1016/j.tranpol.2016.04.015.
- Knudsen B, Florida R, Stolarick K, Gates G. 2008. Density and creativity in US regions. Annals Assoc American Geogr. 98(2):461–478. doi:10.1080/00045600701851150.
- Koike H, Morimoto A, Itoh K 2000. A study on measures to promote bicycle usage in Japan. In: Proceedings of the Velo Mondial 2000—World Bicycle Conference, Amsterdam, The Netherlands.
- Koster HR, Rouwendal J. 2012. The impact of mixed land use on residential property values. J Reg Sci. 52(5):733–761. doi:10.1111/j.1467-9787.2012.00776.x.
- Krugman P. 1996. The self-organizing economy. Hoboken (NJ, USA): Wiley-Blackwell.
- Kulu H, Milewski N. 2007. Family change and migration in the life course: an introduction. Demogr Res. 17:567. doi:10.4054/DemRes.2007.17.19.
- Kwapień J, Drożdż S. 2012. Physical approach to complex systems. Phys Rep. 515(3–4):115–226.
- Landry C. 2012. The creative city: a toolkit for urban innovators. Oxfordshire (UK): Routledge.
- Levin S, Xepapadeas T, Crépin AS, Norberg J, De Zeeuw A, Folke C, Hughes T, Arrow K, Barrett S, Daily G, et al. 2013. Social-ecological systems as complex adaptive systems: modeling and policy implications. Environ Dev Econ. 18(2):111–132. doi:10.1017/S1355770X12000460
- Liu H, Silva EA. 2013. Simulating the dynamics between the development of creative industries and urban spatial structure: an agent-based model. In: Geertman S, Toppen F, Stillwell J, editors. Planning support systems for sustainable urban development. Berlin/Heidelberg (Germany): Springer; p. 51–72. https://link.springer.com/book/10.1007/978-3-642-37533-0
- Ma Y, Zhenjiang S, Kawakami M. 2013. Agent-based simulation of residential promoting policy effects on downtown revitalization. J Artifl Soc Social Simul. 16(2):2. doi:10.18564/jasss.2125.
- Malik A, Crooks A, Root H, Swartz M. 2015. Exploring creativity and urban development with agent-based modeling. J Artifl Soc Social Simul. 18(2):12. doi:10.18564/jasss.2722.
- Martinez LM, Viegas JM. 2017. Assessing the impacts of deploying a shared self-driving urban mobility system: an agent-based model applied to the city of Lisbon, Portugal. Inter J Trans Sci Technol. 6(1):13–27. doi:10.1016/j.ijtst.2017.05.005.
- Meyfroidt P, Chowdhury RR, de Bremond A, Ellis EC, Erb KH, Filatova T, Garrett R, Grove JM, Heinimann A, Kuemmerle T, et al. 2018. Middle-range theories of land system change. Global Environ Change. 53:52–67. doi:10.1016/j.gloenvcha.2018.08.006.
- Statistic Bureau, Ministry of Internal Affairs and Communications. 2017. Labor force survey; [accessed 2022 Oct.], [ Available online: http://www.stat.go.jp/data/roudou/index.htm].
- Michels A, Kang JY, Wang S 2020. An exploration of the effect of buyer preference and market composition on the rent gradient using the ALMA framework. In: Proceedings of the 3rd ACM SIGSPATIAL International Workshop on GeoSpatial Simulation, Seattle (WA, USA). p. 48–51. https://dl.acm.org/doi/proceedings/10.1145/3423335
- Millward H. 2006. Urban containment strategies: a case-study appraisal of plans and policies in Japanese, British, and Canadian cities. Land Use Policy. 23(4):473–485. doi:10.1016/j.landusepol.2005.02.004.
- Mitsuda Y, Ito S. 2011. A review of spatial-explicit factors determining spatial distribution of land use/land-use change. Landscape and Ecoll Engin. 7(1):117–125. doi:10.1007/s11355-010-0113-4.
- Ministry of Land, Infrastructure and Transport. 2017 . White paper on land, infrastructure and transport in 2016; [accessed 2022 Oct.], Available online: http://www.mlit.go.jp/hakusyo/mlit/h28/index.html].
- Ministry of Land, Infrastructure and Transport. 2021. Environment: co2 emissions in transportation sector; [accessed Oct. 2022], [ Available online: https://www.mlit.go.jp/sogoseisaku/environment/sosei_environment_tk_000007.html].
- Moeckel R. 2017. Constraints in household relocation: modeling land-use/transport interactions that respect time and monetary budgets. J Transp Land Use. 10(1):211–228.
- Mori U, Mendiburu A, Álvarez M, Lozano JA. 2015. A review of travel time estimation and forecasting for advanced traveller information systems. Transport Metrica A. 11(2):119–157. doi:10.1080/23249935.2014.932469.
- Nagai H, Kurahashi S. 2021. Agent-based modeling of the formation and prevention of residential diffusion on urban edges. Sustainability. 13(22):12500. doi:10.3390/su132212500.
- Nigro A, Bertolini L, Moccia FD. 2019. Land use and public transport integration in small cities and towns: assessment methodology and application. J Transport Geogr. 74:110–124. doi:10.1016/j.jtrangeo.2018.11.004.
- Oba T, Matsuda S, Mochizuki A, Nakagawa D, Matsunaka R. 2008. Effect of urban railroads on the land use structure of local cities. WIT Trans Built Environ. 101:437–445.
- Oldenburg R. 1989. The great good place: café, coffee shops, community centers, beauty parlors, general stores, bars, hangouts, and how they get you through the day. MN (USA): Paragon House Publishers: Saint Paul.
- Pagliara F, Preston J, Kim JH. 2010. The impact of transport policy on residential location. In: Pagliara F, Preston J, Simmonds D, editors. Residential location choice. Berlin/Heidelberg (Germany): Springer; p. 115–136. https://link.springer.com/book/10.1007/978-3-642-12788-5
- Patel A, Crooks A, Koizumi N. 2012. Slumulation: an agent-based modeling approach to slum formations. J Artifl Soc Social Simul. 15(4):2. doi:10.18564/jasss.2045.
- Rafiee R, Mahiny AS, Khorasani N, Darvishsefat AA, Danekar A. 2009. Simulating urban growth in Mashad City, Iran through the SLEUTH model (UGM). Cities. 26(1):19–26. doi:10.1016/j.cities.2008.11.005.
- Railsback SF, Grimm V. 2011. Agent-based and individual-based modeling: a practical introduction. Princeton (NJ, USA): Princeton University Press.
- Rauws W. 2016. Civic initiatives in urban development: self-governance versus self-organisation in planning practice. Town Plann Rev. 87(3):339–362. doi:10.3828/tpr.2016.23.
- Rogers R. 1997. Cities for a small planet. London (England): Faber & Faber.
- Rubiera-Morollón F, Garrido-Yserte R. 2020. Recent literature about urban sprawl: a renewed relevance of the phenomenon from the perspective of environmental sustainability. Sustainability. 12(16):6551. doi:10.3390/su12166551.
- Statistic Bureau, Ministry of Internal Affairs and Communications. 2017. Labor force survey of Internal Affairs and Communications, Statistic Bureau. Available online: http://www.stat.go.jp/data/roudou/index.htm
- Schelling TC. 1971. Dynamic models of segregation. J Math Sociol. 1(2):143–186. doi:10.1080/0022250X.1971.9989794.
- Shook E, Wang S. 2015. Investigating the influence of spatial and temporal granularities on agent-based modeling. Geogr Anal. 47(4):321–348. doi:10.1111/gean.12080.
- Sieverts T. 2003. Cities without cities: an interpretation of the Zwischenstadt. Oxfordshire (UK): Routledge.
- Silva EA, Clarke KC. 2002. Calibration of the SLEUTH urban growth model for Lisbon and Porto, Portugal. Comput Environ Urban Syst. 26(6):525–552. doi:10.1016/S0198-9715(01)00014-X.
- Spencer GM. 2012. Creative economies of scale: an agent-based model of creativity and agglomeration. J Econ Geogr. 12(1):247–271. doi:10.1093/jeg/lbr002.
- Su S, Zhang J, He S, Zhang H, Hu L, Kang M. 2021. Unraveling the impact of TOD on housing rental prices and implications on spatial planning: a comparative analysis of five Chinese megacities. Habitat Int. 107:102309. doi:10.1016/j.habitatint.2020.102309.
- Taniguchi T, Takahashi Y, Nishikawa I 2010. Multi-agent simulation on relationship between individuals’ travel behavior and residential choice behavior. In: Proceedings of the SICE Annual Conference 2010, Taipei, Taiwan. IEEE. p. 1728–1733.
- Thomas R, Pojani D, Lenferink S, Bertolini L, Stead D, van der Krabben E. 2018. Is transit-oriented development (TOD) an internationally transferable policy concept? Reg Stud. 52(9):1201–1213. doi:10.1080/00343404.2018.1428740.
- Tsai YH. 2005. Quantifying urban form: compactness versus ‘sprawl’. Urban Studies. 42(1):141–161. doi:10.1080/0042098042000309748.
- US High Speed Rail Association. 2015. The transit oriented development institute; [accessed 2022 Oct.], [ Available online: http://www.tod.org/].
- Utsunomiya K. 2016. Social capital and local public transportation in Japan. Res Transport Econ. 59:434–440. doi:10.1016/j.retrec.2016.02.001.
- van Delden L, Rowlings DW, Scheer C, Grace PR. 2016. Urbanisation-related land use change from forest and pasture into turf grass modifies soil nitrogen cycling and increases N2O emissions. Biogeosciences. 13(21):6095–6106. doi:10.5194/bg-13-6095-2016.
- Webb R, Bai X, Smith MS, Costanza R, Griggs D, Moglia M, Neuman M, Newman P, Newton P, Norman B, et al. 2018. Sustainable urban systems: co-design and framing for transformation. Ambio. 47(1):57–77. doi:10.1007/s13280-017-0934-6
- Wey WM. 2019. Constructing urban dynamic transportation planning strategies for improving quality of life and urban sustainability under emerging growth management principles. Sustainable Cities Soc. 44:275–290. doi:10.1016/j.scs.2018.10.015.
- Wu F. 2002. Calibration of stochastic cellular automata: the application to rural-urban land conversions. Interl J Geogr Inf Sci. 16(8):795–818. doi:10.1080/13658810210157769.
- Xie Y, Batty M. 2005. Integrated urban evolutionary modeling. In: Atkinson P, Foody GM, Darby SE, Wu F, editor. Geodynamics. Boca Raton (FL, USA): CRC Press; p. 273–294. https://www.taylorfrancis.com/books/edit/10.1201/9781420038101/geodynamics-peter-atkinson-giles-foody-steven-darby-fulong-wu?refId=5621236d-d129-4cdb-b90a-c6be5bb6e163&context=ubx
- Yamada K, Deguchi H. 2016. Simulation analysis of population dynamics based on autonomous residential choice in suburb areas. Trans Soci Inst Control Engin. 52(10):555–565. doi:10.9746/sicetr.52.555.
- Zhang L, Zeng G, Li D, Huang HJ, Stanley HE, Havlin S 2019 a . Scale-free resilience of real traffic jams. Proceedings of the National Academy of Sciences. 116(18):8673–8678. https://www.pnas.org/
- Zhang Y, Song R, van Nes R, He S, Yin W. 2019. b . Identifying urban structure based on transit-oriented development. Sustainability. 11(24):7241. doi:10.3390/su11247241.
- Zhou Y, Varquez AC, Kanda M. 2019. High-resolution global urban growth projection based on multiple applications of the SLEUTH urban growth model. Scientific Data. 6(1):1–10. doi:10.1038/s41597-019-0048-z.