
 ?Mathematical formulae have been encoded as MathML and are displayed in this HTML version using MathJax in order to improve their display. Uncheck the box to turn MathJax off. This feature requires Javascript. Click on a formula to zoom.
I thank Dr. Eric W. Gibson for the insightful overview of p-values and replication problems. I enjoyed the broad discussion on the proper understanding and interpretation of p-values based on his expertise and practice in randomized clinical trials. It is a great pleasure to discuss this article and to share some of my thoughts.
1 Problems on the Fixed Significance Level of 5%
As alerted in the ASA statement on “Statistical Significance and p-Values” (Wasserstein and Lazar Citation2016), null hypothesis statistical testing with the fixed significance level (denoted by α) is also prevailing in Japan. George Cobb’s post to an ASA discussion forum as noted in the preface of the ASA statement:
Q: Why do so many people still use p = 0.05?
A: Because that’s what they were taught in college or grad school.
is still true in Japan. This is partly because Japanese universities do not have any department of statistics; therefore, introductory level undergraduate statistics courses are taught by non-statisticians who are not familiar with statistical methods other than null hypothesis statistical testing, which is also understood superficially. Blind setting of α as 5% is routine in the biomedical community in Japan. Researchers are very pleased when they have the result of but are disappointed when
; they thus repeat experiments or enroll more subjects as a remedy. Akira Sakuma, the famous Japanese biostatistician, referred to this tendency as a serious disease, and gave it the scientific name of “significantosis” (Sakuma Citation1977).
Dr. Gibson stated “I do not believe there is a replication crisis” (Gibson Citation2020), and it’s true because it is the natural course when using the fixed α of 5%. In the example given in Gibson (Citation2020, Figure 3), Dr. Gibson explained the situation that 1000 trials are designed with 80% power, that the prevalence of real effects is 10%, and that a threshold of is used for publication. It is easy to understand this as a screening test (Lash Citation2017). The upper section of shows a rearrangement of Figure 3, and its false discovery proportion (FDP) is calculated as 36% (45/125). The lower section of shows the expected counts when investigators would conduct replication trials for 125 significant results using the same 80% power and 5% threshold. Even when the true prevalence of real effects is set relatively high as 10%, the 5% α gives a replication proportion only 51% (64/125) (the observed replication proportion is 53% (66.75/125), but 2.25 trials are false positive results).
Table 1 Expected counts for 1000 trials with prevalence of a real effect as 10% using as the screening threshold (1 - specificity) with 80% power (sensitivity).
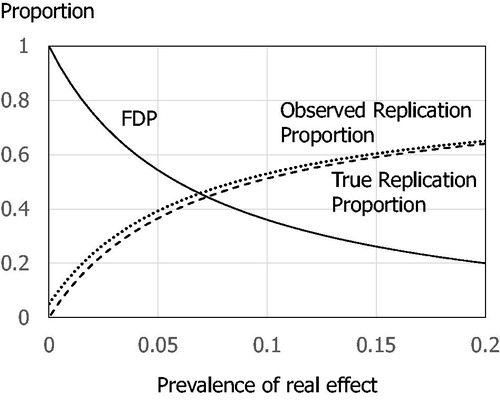
shows the FDPs and replication proportions in different prevalence of real effects. When the prevalence is 15%, the true replication proportion reaches 60% with 26% FDP, and goes down to 40% with 50% FDP, when the prevalence is 6%.
Fig. 1 False discovery proportion (FDP) and replication proportion, using as the threshold and power = 80%. Solid line: FDP, dotted line: observed replication proportion, dashed line: true replication probability.
2 Don’t Say “Statistically Significant”
Following the ASA statement, a Nature comment (Amrhein, Greenland, and McShane Citation2019) and an Editorial in the American Statistician (Wasserstein, Schirm, and Lazar Citation2019) have recommended to stop using the term “statistically significant.” Dr. Gibson has also avoided the use of “significant” (although I found one in his Acknowledgments), and has provided proper understanding and interpretation of p-values. As noted in a Clinical Trials Editorial (Cook et al. Citation2019), “(a) typical clinical trial will be premised upon a statistical hypothesis testing framework, both for the determination of the sample size and for its analysis.” It should be noted in a trial protocol, however I, as a trial statistician, do not need to say “statistically significant” in my clinical study reports or clinical trial articles. “When reporting the results of significance tests, precise p-values (e.g., “p = 0.034”) should be reported rather than making exclusive reference to critical values” (ICH E9 Citation1998). It is important to “(w)atch out for pressure to embellish the abstract or the press release” (Wasserstein, Schirm, and Lazar Citation2019).
To understand whether the evidence is persuasive enough to support an affirmative decision, I do not think that proper interpretation of p-values is sufficient. According to the 4th and 6th principles in the ASA statement:
4. Scientific conclusions and business or policy decisions should not be based only on whether a p-value passes a specific threshold, and
6. By itself, a p-value does not provide a good measure of evidence regarding a model or hypothesis,
we may consider other information such as strength of treatment effect, consistency of the reported effect, and clinical plausibility which are part of Hill’s nine aspects to consider when deciding whether an association is causal (Hill Citation1965).
When writing this comment, I asked myself whether I could stop conducting the PRAISE-2 trial. Based on Table 3 in Gibson (Citation2020), the overall mortality result of the PRAISE-I trial gave a hazard ratio of 0.84 with a 95% confidence interval of 0.69 and 1.02, and in patients with nonischemic heart failure, the hazard ratio was 0.54 and the 95% confidence interval of 0.37 and 0.79. The 95% confidence interval for the overall result included no effect, but shifted to the amlodipine effective side. The promising result was a finding in one of eight subgroups; however, if, in the same situation, my clinical counterpart tells me that it is clinically plausible that amlodipine is effective for nonischemic heart failure, I would probably plan a new trial limited to nonischemic heart failure patients. I would like to ask Dr. Gibson the same question.
I would like to close my comment with another fixed 5% α level story in Japan (Sakuma Citation1999). Because Fisher (Citation1925) suggested the 5% α level in his book “Statistical Methods for Research Workers,” once we had a very plausible rumor:
Since a research worker could conduct one experiment per year in the agricultural experiments, in which Fisher worked, research worker’s life was roughly 20 years. Fisher thought that only one failure in 20 experiments throughout one’s research life could be allowed.
When Fisher came to Japan, Motosaburo Masuyama, a Japanese mathematical statistician, asked Fisher whether the rumor was true. “I never thought like that,” Fisher answered.
ORCID
T. Shun Satohttp://orcid.org/0000-0001-9830-013X
Additional information
Funding
References
- Amrhein, V. , Greenland, S. , and McShane, B. (2019), “Retire Statistical Significance,” Nature , 567, 305–307. DOI: 10.1038/d41586-019-00857-9.
- Cook, J. A. , Fergusson, D. A. , Ford, I. , Gonen, M. , Kimmelman, J. , Korn, E. L. , and Begg, C. B. (2019), “There Is Still a Place for Significance Testing in Clinical Trials,” Clinical Trials , 16, 223–224. DOI: 10.1177/1740774519846504.
- Fisher, R. A. (1925), Statistical Methods for Research Workers , London: Oliver and Boyd.
- Gibson, E. W. (2020), “The Role of p-Values in Judging the Strength of Evidence and Realistic Replication Expectations,” Statistics in Biopharmaceutical Research , 12.
- Greenland, S. , Senn, S. J. , Rothman, K. J. , Carlin, J. B. , Poole, C. , Goodman, S. N. , and Altman, D. G. (2016), “Statistical Tests, P Values, Confidence Intervals, and Power: A Guide to Misinterpretations,” European Journal of Epidemiology , 31, 337–350. DOI: 10.1007/s10654-016-0149-3.
- Hill, A. B. (1965), “The Environment and Disease: Association or Causation?” Proceedings of the Royal Society of Medicine , 58, 295–300. DOI: 10.1177/003591576505800503.
- ICH E9 (1998), “E9 Topic: Statistical Principles for Clinical Trials,” available at https://database.ich.org/sites/default/files/E9_Guideline.pdf.
- Lash, T. L. (2017), “The Harm Done to Reproducibility by the Culture of Null Hypothesis Significance Testing,” American Journal of Epidemiology , 186, 627–635. DOI: 10.1093/aje/kwx261.
- Sakuma, A. (1977), Drug Evaluation (Vol. I), Tokyo: University of Tokyo Publishing (in Japanese).
- Sakuma, A. (1999), “Statistics Anecdotes,” in Clinical Trials in the 21st Century , eds. H. Tsubaki , T. Fujita , and T. Sato , Tokyo: Asakura Publishing (in Japanese).
- Wasserstein, R. L. , and Lazar, N. A. (2016), “The ASA’s Statement on p-Values: Context, Process, and Purpose,” The American Statistician , 70, 129–133. DOI: 10.1080/00031305.2016.1154108.
- Wasserstein, R. L. , Schirm, A. L. , and Lazar, N. A. (2019), “Moving to a World Beyond p<0.05 ,” The American Statistician , 73, 1–19.