
ABSTRACT
This article focuses on health monitoring of structures using multiple smart materials. In this research, two fiber-optic sensors, namely fiber Bragg grating (FBG) and fiber-optic polarimetric sensor (FOPS), are investigated for damage detection in the beam specimen. FBG is used for local strain measurement while FOPS is used for global strain measurement. Both FBG and FOPS show significant changes in the strain due to damages in the specimen. Also, at the center of the specimen, piezoelectric wafer active sensor (PWAS) is attached. The electromechanical admittance (EMA) signature of the specimen beam is recorded by PWAS. The changes in the amplitudes of the peaks obtained at various frequencies in this EMA signature are analyzed, and it is shown that the peak amplitudes respond differently to damages and to change in loading. Thus, multiple smart materials (FBG, FOPS, and PWAS) are used to get improved information on the health of the beam.
1. Introduction
Large and heavy mechanical and civil structures need to be monitored on a regular basis for cracks or damages. Generally, the strain changes abruptly in these structures due to damages. Structures such as mechanical blades, shafts, aero-wings, and civil structures have to be monitored for strain variations due to cracks and damages [Citation1–Citation4]. Different smart materials are being used to monitor the health of structures. Fiber-optic sensors and piezoelectric wafer active sensor (PWAS) are among the most used smart materials for structural health monitoring (SHM).
In fiber-optic sensors, information is primarily conveyed through the change in phase/polarization/frequency/intensity of input signal. Different parameters such as strain, pressure, temperature, and twist are measured by different fiber-optic sensors for SHM of different structures [Citation5–Citation9]. The fiber-optic sensing technologies are attractive in damage detection as they facilitate with real-time nondestructive monitoring of different mechanical and civil structures [Citation10]. Out of all the fiber-optic sensors, fiber Bragg grating (FBG) and fiber-optic polarimetric sensor (FOPS) have been researched the most in the last two decades. FBGs are suitable for local SHM or in other words they are used for local strain measurement [Citation11]. Thus, FBG can only monitor damages only in its vicinity. FBG sensors can be easily embedded into composite structures for their SHM [Citation12]. Recently, small-diameter FBG was developed for the measurement of non-homogenous internal strain fields [Citation13]. FOPS measures strain in the entire length of a structure. The increased strain due to the damage or crack in a structure is picked up by FOPS irrespective of the damage location in the structure. Thus, FOPS monitors damages in different structures globally [Citation14–Citation16]. However, the location of the damage might not be achieved using FOPS.
Piezoelectric materials are active smart materials as they actuate under electric field and also sense the reactions [Citation17,Citation18]. Piezoelectric sensors rely on the piezoelectric effect. PWASs are used for the determination of pressure, acceleration, strain, or force [Citation19–Citation23]. Recently, small and conformal piezoelectric ceramics and wafer transducers, either being surface mounted or being embedded into the structures, have been widely studied in admittance signature and for generating and receiving guided waves for structural integrity monitoring [Citation24,Citation25]. Thus, piezoelectric sensors can play a very important role in SHM industry.
Since a single smart material cannot provide enough information to interpret the damage condition in an engineering structure, multiple smart materials were employed to get a better picture of damage state in the structures [Citation25,Citation26]. This article presents the application of multiple smart materials, FBG, FOPS, and PWAS, for crack monitoring in a fixed-fixed beam. In this research, it is shown that the data obtained from all these three smart materials give improved information on cracks in the beam. FBG monitors cracks in the central region (local monitoring) of the beam, whereas FOPS monitors cracks in a certain length (global monitoring) of the beam. Static and dynamic tests were conducted for global SHM of beam structures. However, FOPS is used for global strain measurement in this research for the first time. Additionally, PWAS’s monitoring ability was also studied for incremental loading and cracks. PWAS’s electromechanical admittance (EMA) signature responds differently to the change in load on the beam and to the cracks happening in the beam. The impact of the cracks on EMA signature is abrupt and higher, while on the other hand, loading makes a steadier and lower impact on the EMA signature.
2. Theory
2.1. FBG
A Bragg grating is a periodic structure of the refractive index, fabricated by exposing a photosensitized (or hydrogenated) fiber to a high-power pulsed excimer laser (248 nm) through a phase mask. When the light from a broadband source is launched into the core of the FBG fiber, a single wavelength is reflected back whereas the rest of the signal is transmitted. This reflected wavelength is known as Bragg wavelength () and it is given by
where neff is the effective refractive index of the mode propagating along the fiber and Λ is the grating period of the FBG. Equation (1) suggests that if FBG goes through any longitudinal strain, the grating period (Λ) of FBG will vary resulting in the Bragg wavelength shift. Thus, the longitudinal strain shifts the Bragg wavelength through expansion or contraction of the grating periodicity [Citation27]. This Bragg wavelength shift is read by the FBG interrogator, and the corresponding strain is calculated as
where ΔλB is the shift in the Bragg wavelength and α is the wavelength-strain sensitive factor and its value is 0.67 με−1pm for 850 nm.
2.2. FOPS
In FOPS, high birefringent (Hi-Bi) fiber-like, bow-tie fiber is used. In Hi-Bi fiber, the light travels in two mutually orthogonal modes of polarization: fast mode and slow mode. Fast mode travels faster than the slow mode in the birefringent medium. The polarization of light coming out of Hi-Bi is fixed. This difference in velocities introduces an additional phase between both the components. In case of Hi-Bi fiber, this additional phase is given by
where L is the length of the fiber and Δβ (=βfast − βslow) is the difference in propagation constant between two orthogonally polarized modes which travel along fast and slow axes, respectively. Δβ is called the ‘birefringence’ of the fiber. From Equation (1), it is clear that there are two factors which can cause a change in the additional phase; one is the change in the length (or axial strain) of the fiber core, L, and another is birefringence (∆β) of the Hi-Bi fiber used. Upon the application of longitudinal strain, the length L of the core of Hi-Bi fiber changes which means the phase (ϕ) between both the fast and the slow modes changes. As a result, the polarization of the light coming out of the fiber changes. If the longitudinal strain is produced increasingly in the Hi-Bi fiber, the polarization of the light coming out of the fiber changes sinusoidally. Since the light finally passes through an analyzer, the output intensity (or voltage V) of the light which is measured by the photodiode also changes sinusoidally [Citation15]. In the loading test conducted with FOPS, a normalized output parameter called state of polarization (SOP) is calculated, which is given by
where = (
)/2 is the average photodiode voltage and VR = (
) is the range of the variation of the photodiode voltage from first loading step to last loading step. Following photodiode voltage V, SOP also changes sinusoidally. The cycle of SOP variation depends on the beat length (Lb = 2π/Δβ) of the Hi-Bi fiber used. A phase change of 2π in SOP cycle means a change of Lb in the length of Hi-Bi fiber used as FOPS. The SOP cycle is segmented to calculate total strain in the specimen [Citation28].
2.3. PWAS
In PWAS, the damage/load monitoring is based on EMA signature. The presence of damage/load on the host structure affects its impedance. In other words, the admittance which is the inverse of impedance is affected by the presence of damage or load. The admittance of the PWAS can be measured by an electrical analyzer, such as the Agilent’s LCR (inductance – L, capacitance – C, and resistance – R) meter.
An alternative voltage signal of 1 V root mean square is applied to the bonded PWAS patch () over the user-specified frequency range. The change in extracted admittance signature is an indication of structural loading or damage occurrence [Citation25]. The admittance signature comprising of peaks is a function of the stiffness, mass, and damping of the host structure. The admittance signature is also the function of the properties of PWAS patch and the additive glue with which it is bonded [Citation25,Citation29]. In principle, the EMA-based SHM technique is similar to the conventional global vibration techniques. The major difference is only with respect to the frequency range employed. The frequency is typically <100 Hz for the global vibration technique while it is <400 kHz for EMA-based SHM.
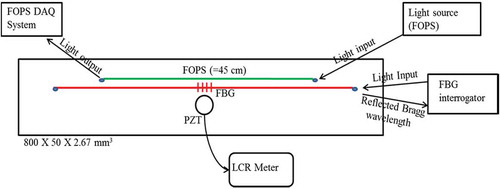
Figure 1. Schematic of specimen with multiple smart materials.
The amplitudes of peaks obtained in the admittance signature of PWAS are proportional to the natural frequencies of the host structure, and shifting of these peak amplitudes indicates changes in natural frequencies of the structure. The change in the frequencies arises due to crack/load in the structure. This technique employs low-cost and low-power PWAS patches which can be non-intrusively bonded to the structure and can be interrogated without removal of finishes. A one-dimensional approach to model PWAS–structure interaction has already been proposed [Citation30]. The admittance of the PWAS sensor is expressed as
where Za and Z are the mechanical impedances of the PWAS patch and the host structure, respectively; j is the imaginary unit; ω is the angular frequency of the driving voltage; wa, la, and ha are the width, length, and thickness of the PWAS patch, respectively; is the complex Young’s modulus of the PWAS material at zero electric field; d31 is the piezoelectric constant;
is the complex dielectric constant;
and
denote the mechanical loss factor and the dielectric loss factor of the PWAS material, respectively;
is the wave number which is related to the angular frequency of excitation
by
; and
is the material density of the structure. G is a real component of admittance, i.e. conductance, and B is an imaginary component of admittance, i.e. susceptance. Equation (5) indicates that the admittance of PWAS patch is directly related to the mechanical impedance of the host structure. Therefore, any change in the admittance signatures is the indication of a change in the structural integrity. The signature comprises of both the conductance and the susceptance.
3. Experiments and results
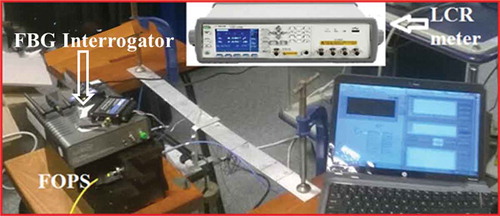
Multiple smart structures are used to get improved information on damage state in an aluminum beam. The dimensions of the specimen are 800 × 50 × 2.67 mm3 and three smart materials, FBG, FOPS, and lead zirconate titanate (PZT), are bonded on the specimen. The schematic of the cross-section of the specimen is shown in . Each smart material has its own instrumentation system. FBG uses an interrogator which includes a light source. For FOPS, the light source and data acquisition (DAQ) system are different as illustrated in . PZT signal is obtained through LCR meter. All the important properties of FOPS, FBG, and PZT patch are given in . The beam was fixed at both the ends, and the load was applied at the center of the specimen beam through a hanger (130 g) as shown in . FBG and PZT are at the center, and the length of FOPS is 45 cm as highlighted. The picture of actual experimental setup with all the three different instrumentation is shown in . First, the beam was loaded incrementally in the steps of 200 g using weights, and the measurements were taken using FBG interrogation system, FOPS’s DAQ system, and PWAS LCR meter. Later, all the weights were removed and a crack was made at location 1 as shown in . Again the beam was loaded in the same loading steps and readings were acquired from all the three sensing systems. Furthermore, additional cracks were made at locations 2, 3, 4, and 5 one by one and the readings were acquired every time in the same loading steps.
Table 1. Different properties of smart materials.
Figure 2. Schematic of experimental setup with cracks at locations 1, 2, 3, 4, and 5.
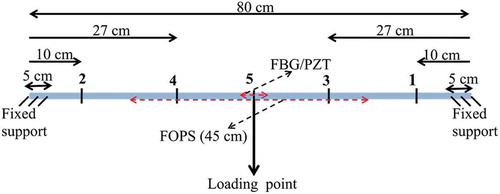
Figure 3. Lab experimental setup.
3.1. Monitoring with FBG
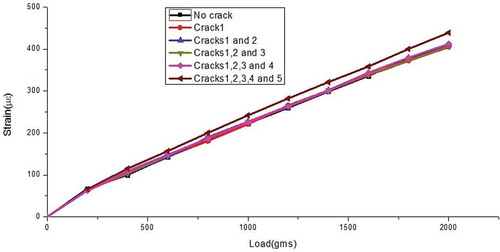
The strains measured by FBG at every load step for every crack scenario are shown in . From ‘No crack’ to ‘Cracks1, 2, 3, and 4ʹ, the load versus strain lines are almost overlapping as the cracks are at locations which are too far to be detected by FBG. However, the slope of the load versus strain line increases significantly when a crack is made at location 5 (central location) which is within the detection range of FBG. Thus, FBG measures strain in the central region of the beam providing crack information in the central part of the beam only.
Figure 4. Strain measured by FBG for different crack scenarios.
3.2. Monitoring with FOPS
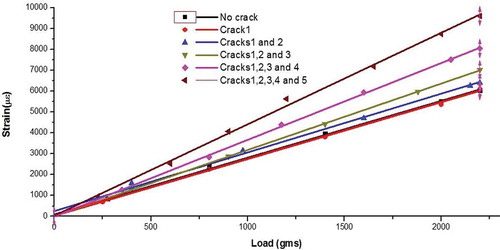
In the case of FOPS, the voltage measured by DAQ system is recorded with increasing load for each crack. Furthermore, the SOP is calculated using Equation (2) and then it is plotted against the increasing load as shown in . SOP varies sinusoidally as the load progresses. Though it is difficult to infer anything directly in , the cycle period of SOP decreases when the cracks occur in a part of the beam where FOPS fiber is present. Since the beat length of the Hi-Bi fiber used here in this experiment is 2.8 mm, one complete cycle of SOP variation corresponds to 2.8 mm increment in the fiber length or specimen length. The total length of the FOPS used in this experiment is 45 cm as shown in and which means that FOPS measures the total strain produced in the whole 45 cm length of the specimen beam. The SOP cycles corresponding to different crack scenarios (from ‘No crack’ to ‘Cracks 1, 2, 3, 4, and 5ʹ) are shown in . Each SOP cycle can be segmented to calculate the total longitudinal strain in 45 cm length of the specimen. Thus, FOPS can be used to calculate the total strain over a certain length. The total strain in 45 cm length is plotted against increasing load for different crack scenarios in . The load versus strain lines corresponding to ‘No crack,’ ‘Crack 1,ʹ and ‘Cracks 1 and 2ʹ are almost overlapping. This is because of the fact that in these cases, the cracks are outside the 45 cm length of FOPS (see for crack locations). When additional cracks are induced in the part of the specimen where FOPS is present (Crack locations 3, 4, and 5), the slope of the load versus strain line increases significantly which is apparent in . Thus, FOPS measures strain in its entire length, leading to global strain monitoring for the considered specimen.
Figure 5. SOP cycles of FOPS for different crack scenarios.
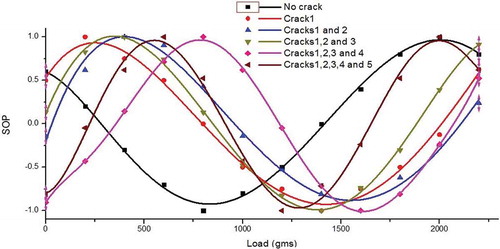
Figure 6. Total strain measured by FOPS in 45 cm length of the specimen for different crack scenarios.
3.3. Monitoring with PWAS
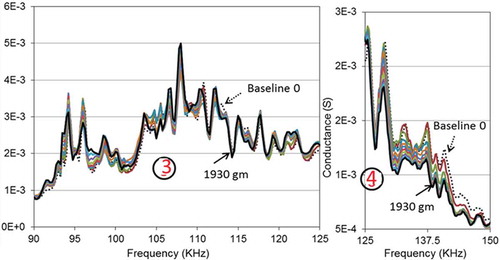
EMA signatures of the specimen were obtained for every loading step (from 0 to 1930 g) for the frequency range from 10 to 150 kHz at a sweep step of 0.25 kHz. This process was repeated for every crack scenario (from ‘No crack’ to ‘Cracks 1, 2, 3, 4, and 5ʹ). EMA signatures with increasing loads for ‘No crack’ condition are shown in . EMA signatures are too condensed to be seen clearly. Therefore, signatures are segmented in four frequency ranges as to study the movement of peaks properly. An expanded view of EMA signatures in range 1 (66–75 kHz) and range 2 (78–83 kHz) is shown in . Similarly, the expanded view of range 3 (90–125 kHz) and range 4 (125–150 kHz) is shown in . From and , it is clear that the peaks are either going down or going up and their movement is very consistent. This indicates that if the load increases progressively, the peaks will continue to move in one direction.
Figure 7. EMA signatures with increasing loads for ‘No crack’ condition.
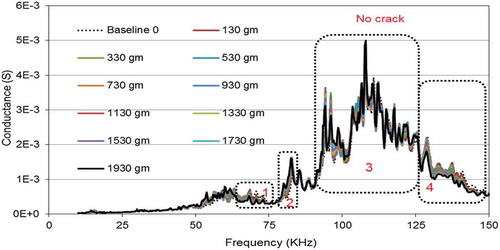
Figure 8. Expanded region of EMA signature in range 1 and range 2.
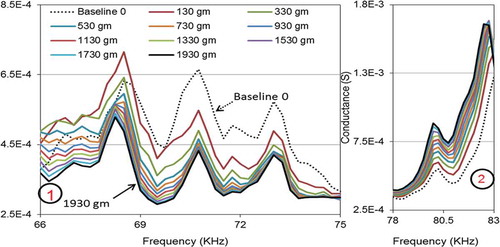
Figure 9. An expanded view of EMA signature in range 3 and range 4.
Furthermore, an analysis was carried out to assess the importance of EMA signatures for load/crack monitoring. This is done by looking at the pattern of root mean square deviation (RMSD) index [Citation31]. RMSD is used to compare the signatures of two different states. RMSD has been widely accepted and used for estimation of the amount of variation between two signatures. It is defined as
where i (=1, 2, 3 … N) represents the peak number in the signature and k (=2, 3, 4 … N) represents the loading step number. is the amplitude of ith peak at base loading step which is the first loading step here in this case and
is the amplitude of the same ith peak at kth loading step. In this study, the RMSD essentially compares the base loading step (or the first loading step) signature with the later signature with kth loading step, i.e. the RMSD indices are calculated with respect to (w.r.t) the first loading step. The values of RMSD indices with increasing loading steps for all the crack scenarios are given in . From this table, it is clear that RMSD indices increase (column wise) consistently with increasing load for every crack scenario or in other words increasing RMSD index is an indication of increasing load on the structure. However, the RMSD values (row wise) with increasing number of cracks do not make any sense. This reflects to the fact that the boundary conditions of the beam get disturbed abruptly after every crack as every crack is made manually using a fine saw. Making crack using saw disturbs the base line every time.
Table 2. RMSD indices (w.r.t. the first load) and differences during load and crack increments.
The EMA signatures with increasing number of cracks for no load condition are shown in . The process of making cracks creates a lot of disturbances in the specimen; therefore, the EMA signatures are disturbed and do not show any pattern similar to EMA signature with increasing load (see ). To study the effect of cracks on EMA signature of the specimen, the RMSD index is calculated for different crack scenarios. Differently from classical application of Equation (7), it is here proposed to consider index k related to the number of cracks rather than the loading step number. This time EMA signature corresponding to ‘No crack’ condition was considered to be the base step () and the crack scenarios from ‘Crack 1ʹ to ‘Cracks 1, 2, 3, 4, and 5ʹ were taken with k = 2 to k = 6, respectively as shown in . Hence, the RMSD indices were calculated with respect to ‘No crack’ signature. The RMSD indices with increasing cracks are given in . These signatures were obtained when there was no load. Cracks are induced at random locations thus their RMSD trends are also random. Clearly, the RMSD index increases drastically with increasing damage in the specimen.
Table 3. RMSD indices with increasing cracks and at ‘No load’ condition.
Figure 10. EMA signatures with increasing cracks for ‘No load’ condition.
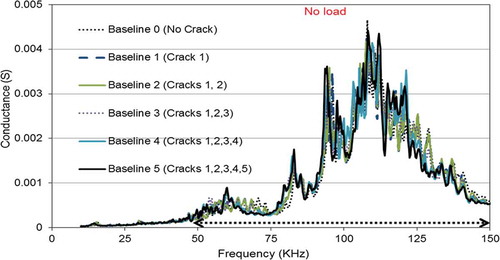
The peaks in EMA signature of the specimen move consistently in one direction, and the value of RMSD index increases gradually with increasing load (). On the other hand, the movement of peaks in EMA signatures is larger with visible disturbances with increasing damage in the specimen (). Hence, the value of RMSD index increases significantly with increasing damage. In the latter case (), only ‘No Load’ condition is considered as it is the case when the disturbance in the boundary conditions due to crack making process is minimum. The disturbances are higher when the beam is loaded, and therefore, the RMSD values change abruptly rather than consistently.
4. Conclusions
One smart material or sensing technology is not sufficient for damage monitoring in a structure. Improved information on damage can be obtained by using multiple smart materials on a structure. In this research, three smart materials, FBG, FOPS, and PWAS, are used for damage/load monitoring in an aluminum beam. FBG can monitor damages in a very specific region (the central region in this case) through local strain monitoring. On the other hand, FOPS can monitor damages in a pre-decided length (45 cm in this case) of the specimen through global strain monitoring. In the case of PWAS, if the variations in EMA signatures are low but consistent, this will implicate the loading or unloading of the specimen. If EMA signature varies substantially but inconsistently, it will implicate the damage occurrence in the specimen. Thus, EMA signatures differentiate between loading and damage occurrence. The RMSD index calculated on the basis of number of cracks implies that damages cause a higher impact on RMSD index value. Thus, RMSD quantifies the severity of damage in the specimen as it increases by more distinguishable amount with an increase in damages. Multiple smart material employment has a great scope for further investigation.
Acknowledgments
The authors acknowledge the financial support from NTU, Singapore.
Disclosure statement
No potential conflict of interest was reported by the authors.
Additional information
Funding
Notes on contributors
Muneesh Maheshwari
Muneesh Maheshwari completed his Master in Technology (M. Tech) from Indian Institute of Technology Kanpur, India. He was the recipient of Junior Research Fellowship during his M. Tech program. He was granted NTU research scholarship in 2012. He completed his PhD from Nanyang Technological University in Jan 2016 in Mechanical and Aerospace Engineering. Currently, he is working as Research Fellow in the school Maritime Institute@NTU.
Venu G. M. Annamdas
Venu Gopal Madhav Annamdas received his B.Eng in Civil Engineering from Osmania University, Hyderabad, India, in 1998. M.Eng in Structural Engineering, Department of Civil Engineering from Indian Institute of Science, Bangalore in 2001. Ph.D in Structures and Mechanics, from School of Civil and Environmental Engineering, Nanyang Technological University (NTU), Singapore in 2007. From 2006 to 2009, he worked as post-doctoral researcher in NTU, Singapore and University of Pittsburgh, USA. His works included applications of electromechanical impedance based technology in laboratory and real for Mass Rapid Station construction site in Singapore, and a project for Penn. DOT, Pennsylvania, USA. From 2009 to 2011, he worked as a faculty in a private engineering college, Hyderabad, India. Since 2012, he has been working as a Researcher (Senior Research Fellow) in schools of Mechanical and Aerospace engineering, and, Civil and Environmental Engineering, NTU, Singapore. His research interest includes sensors and actuators, piezoelectric transducers, electromechanical smart materials, electromagnetic metamaterials etc.
John H. L. Pang
John H. L. PANG is Assistant Chair (Research) and Professor at the School of Mechanical and Aerospace Engineering of Nanyang Technological University Singapore. He received his PhD degree in 1989 and BSc degree in 1985 from the University of Strathclyde, Glasgow, UK. He joined Nanyang Technological University in 1990. His academic interests are in Materials-Process-Performance (MPP) evaluations in Laser Cladding and Additive Manufacturing, Mechanics of Lead-Free Solder Materials, Design for Reliability (DFR), Fatigue Analysis of Welded Joints. He has published over 180 peer-reviewed journal and technical conference papers and has a SCI Web-of-Science (PANG JHL OR PANG HLJ), h-Index of 28, and over 2400 citations. He serves in the Editorial Advisory Board of the International Journal of Fatigue. He had served as Associate Editor in the IEEE Transactions on Components and Packaging Technology and Advanced Packaging, ASME Journal of Electronic Packaging. He is a Fellow of the American Society of Mechanical Engineers (FASME).
Anand Asundi
Anand Asundi graduated from the Indian Institute of Technology, Bombay and received his Ph.D. from the State University of New York at Stony Brook. Following a brief tenure Virginia Tech., he joined the University of Hong Kong in 1983 where he was Professor till 1996. Currently he is Professor and Deputy Director of the Advanced Materials Research Centre at the Nanyang Technological University in Singapore. His teaching area is in Solid Mechanics and his research interests are in Photomechanics and Optical Sensors. He has published over 200 papers in peer-reviewed journals and presented invited and plenary talks at International Conferences around the world. He has also chaired and organized numerous conferences in Singapore and other parts of the world. He is Editor of Optics and Lasers in Engineering and on the Board of Directors of SPIE, the international society of Optical Engineers. He is a fellow of the Institute of Engineers, Singapore and SPIE. He also holds advisory professorial appointments at Tongji University, Shanghai University and Harbin Institute of Technology, China. He is also Chairman of the Asian Committee on Experimental Mechanics and the Asia Pacific Committee on Smart and Nano Materials both of which he co-founded.
Swee C. Tjin
Swee Chuan Tjin graduated from the University of New England, Armidale, Australia in 1987, received his PhD in 1992 from the Department of Medicine at the University of Tasmania, where he worked on Fibre Optic Laser Doppler Anemometry. He joined NTU in 1991 as a Lecturer in the School of EEE. Swee Chuan’s research interests are in fibre optic sensors, biomedical engineering and biophotonics. Over the years, he has published more than 130 refereed journal papers and has filed 34 patents in fibre optic sensors, biomedical engineering and biophotonics. In Dec 2000, he pioneered a start-up company that manufactures fibre optic sensors which provides sensing solutions for civil and geotechnical applications. Dr. Tjin is also recognized by his peers for his effective communication skills and was awarded the College of Engineering Teaching Excellence Award and EEE Teaching Excellence Award in 2005 and 2012 respectively.
References
- J.R. Lee, C.Y. Ryu, B.Y. Koo, S.G. Kang, C.S. Hong, and C.G. Kim, In-flight health monitoring of a subscale wing using a fiber Bragg grating sensor system, Smart Mater. Struct. 12 (1) (2003), pp. 147–155. doi:10.1088/0964-1726/12/1/317
- X. Zhao, T. Qian, G. Mei, C. Kwan, R. Zane, C. Walsh, T. Paing, and Z. Popovic, Active health monitoring of an aircraft wing with an embedded piezoelectric sensor/actuator network: II. Wireless approaches, Smart Mater. Struct. 16 (4) (2007a), pp. 1208–1217. doi:10.1088/0964-1726/16/4/032
- G. Zhao, H.F. Pei, and H.C. Liang, Measurement of additional strains in shaft lining using differential resistance sensing technology, Int. J. Distrib. Sens. Netw. 2013 (2013), pp. 1–6.
- M. Sun, W.J. Staszewski, and R.N. Swamy, Smart sensing technologies for structural health monitoring of civil engineering structures, Adv. Civil Eng. 2010 (2010), pp. 1–13. doi:10.1155/2010/724962
- E. Udd, Fibre Optic Sensors: An Introduction for Engineers and Scientists, Wiley Series in Pure and Applied Optics,Hoboken, NJ, 1990.
- D.A. Krohn, Fibre Optic Sensor: Fundamentals and Applications, Instruments Society of America, Pittsburgh, PA, 1998.
- A. Selvarajan and A. Asundi, Photonics fiber optics sensors and their applications in smart structures non-destructive evaluation, J. Non-Destructive Eval. 15 (1995), pp. 41–56.
- J. Sirkis, Interpretation of Embedded Optical Fiber Sensor Signals. Applications of Optical Fiber Sensors in Engineering Mechanics, ASCE,Reston, VI, 1993, pp. 85–99.
- A. Asundi and P.J. Masalkar, Fiber optic strain sensor, comparison of Hi-Bi fibers, Proc. SPIE. 2574 (1995), pp. 119–122.
- M.M. Raymond, Structural Monitoring with Fibre Optic Technology, Academic Press,Cambridge, MA, 2001.
- M. Maheshwari, A.K. Asundi, and S.C. Tjin, Effect of the location and size of a single crack on first fundamental frequency of a cantilever beam using fiber optic polarimetric sensors and characterisation of FBG sensors, Proc. SPIE. 8793 (2013), pp. G1–G8.
- A.S.-M. Rodrigo and -A.L.-A. Roberto, Structural health monitoring of marine composite structural joints using embedded fiber Bragg grating strain sensors, Compos. Struct. 89 (2009), pp. 224–234. doi:10.1016/j.compstruct.2008.07.027
- D. Coric, M. Lai, J. Botsis, A. Luo, and H.G. Limberger, Distributed strain measurements using fiber Bragg gratings in small-diameter optical fiber and low-coherence reflectometry, Opt. Express 18 (25) (2010), pp. 26484–26491. doi:10.1364/OE.18.026484
- M. Jianjun and A. Asundi, Structural health monitoring using a fiber optic polarimetric sensor and a fiber optic curvature sensor – Static and dynamic test, Smart Mater. Struct. 10 (2) (2001), pp. 181–188. doi:10.1088/0964-1726/10/2/302
- V.M. Murukeshan, P.Y. Chan, O.L. Seng, and A. Asundi, On-line health monitoring of smart composite structures using fibre polarimetric sensor, Smart Mater. Struct. 8 (1999), pp. 544–548. doi:10.1088/0964-1726/8/5/303
- M. Maheshwari, S.C. Tjin, and A.K. Asundi, Efficient design of fiber optic polarimetric sensors for crack location and sizing, Opt. Laser Technol. 68 (2014), pp. 182–190. doi:10.1016/j.optlastec.2014.11.023
- V.G.M. Annamdas and C.K. Soh, Multiplexing and uniplexing of PZT transducers for structural health monitoring, J. Intell. Mater. Syst. Struct. 19 (4) (2008), pp. 457–467. doi:10.1177/1045389X06075523
- Y.Y. Lim and C.K. Soh, Effect of varying axial load under fixed boundary condition on admittance signatures of electromechanical impedance technique, J. Intell. Mater. Syst. Struct. 23 (7) (2012), pp. 815–826. doi:10.1177/1045389X12437888
- B. Morten, G.D. Cicco, and M. Prudenziati, Resonant pressure sensor based on piezoelectric properties of ferroelectric thick films, Sens. Actuators, A 31 (1–3) (1992), pp. 153–158. doi:10.1016/0924-4247(92)80096-L
- J.J. Dosch, D.J. Inman, and E. Gracia, A self-sensing piezoelectric actuator for collocated control, J. Intell. Mater. Syst. Struct. 3 (1) (1992), pp. 166–185. doi:10.1177/1045389X9200300109
- J. Tressler, S. Alkoy, and R.E. Newnham, Piezoelectric sensors and sensor materials, J. Electroceramics 2 (4) (1998), pp. 257–272. doi:10.1023/A:1009926623551
- J. Sirohi and I. Chopra, Fundamental understanding of piezoelectric strain sensors, J. Intell. Mater. Syst. Struct. 11 (4) (2000), pp. 246–257. doi:10.1106/8BFB-GC8P-XQ47-YCQ0
- G. Gautschi, Piezoelectric Sensorics, Springer, Berlin, Heidelberg, Germany, 2002, pp. 73–91.
- X. Zhao, H. Gao, G. Zhang, B. Ayhan, F. Yan, C. Kwan, and J.L. Rose, Active health monitoring of an aircraft wing with embedded piezoelectric sensor/actuator network: I. Defect detection, localization and growth monitoring, Smart Mater. Struct. 16 (4) (2007b), pp. 1208–1217.
- Y. Yang, H. Liu, and V.G.M. Annamdas, Experimental study on sensing capability of fibre optic and piezoceramic sensors for application in engineering structures, Proc. SPIE. 7292 (2009), pp. 1–12.
- Y. Yang, V.G.M. Annamdas, C. Wang, and Y. Zhou, Application of multiplexed FBG and PZT impedance sensors for health monitoring of rocks, Sensors 8 (1) (2008), pp. 271–289. doi:10.3390/s8010271
- A.D. Kersey, M.A. Davis, and H.J. Patrick, Fibre grating sensor, J. Lightwave Technol. 15 (1997), pp. 1442–1461. doi:10.1109/50.618377
- M. Maheshwari, V.G.M. Annamdas, J.H.L. Pang, S.C. Tjin, and A. Asundi, Fibre optic sensors for load-displacement measurements and comparisons to piezo sensor based electromechanical admittance signatures, Proc. SPIE. 9431 (2015), pp. 1–12.
- F.P. Sun, Z. Chaudhry, C.A. Rogers, M. Majmundar, and C. Liang, Automated real-time structural health monitoring via signature pattern recognition, Proc. SPIE. 2443 (1995), pp. 236–247.
- C. Liang, F.P. Sun, and C.A. Rogers, Coupled electro-mechanical analysis of adaptive material systems-determination of the actuator power consumption and system energy transfer, J. Intell. Mater. Syst. Struct. 5 (1994), pp. 12–20. doi:10.1177/1045389X9400500102
- S. Park, S. Ahmad, C.B. Yun, and Y. Roh, Multiple crack detection of concrete structures using impedance-based structural health monitoring techniques, Exp. Mech. 46 (5) (2006), pp. 609–618. doi:10.1007/s11340-006-8734-0