
 ?Mathematical formulae have been encoded as MathML and are displayed in this HTML version using MathJax in order to improve their display. Uncheck the box to turn MathJax off. This feature requires Javascript. Click on a formula to zoom.
ABSTRACT
Composite structures are sensitive to impact damage in practical engineering. Electric resistance change method (ERCM) is an ideal technique for damage monitoring of composite structures. Due to the anisotropy of fiber-resin matrix composites, impact location monitoring is difficult, and research on impact location of fiber composite laminates (FRPs) is limited. A preparation method of MXene/CNT/CuNps thin film sensor is proposed. According to the modeling simulation and theoretical calculation, the resistance change characteristics of the thin film sensor are obtained, the relationship between the impact distance and the resistance change is established, and the sensor array is designed. A three-point localization algorithm and a weight function compensation localization algorithm are proposed, which can improve the imaging accuracy of the impact position. The impact point location was observed and analyzed using ultrasonic C-scan technology. The results show that the weight function compensation positioning algorithm can accurately locate the impact of the composite structure, and the error in the X direction is 7.1%, the error in the Y direction is 0.03%, which verifies the effectiveness of the method.
GRAPHICAL ABSTRACT

1. Introduction
Fiber-reinforced plastic composites (FRPs) are often used in industrial facilities such as aerospace because of their very good physical properties [Citation1–3]. During service, FRPs will inevitably suffer from external disturbances, such as low-velocity impacts [Citation4]. Therefore, in order to ensure the safe use of FRPs under uncertain working conditions, real-time monitoring of plastic plates is necessary.
Impact damage monitoring methods are usually divided into traditional offline monitoring and currently popular online monitoring. The off-line monitoring method usually needs to stop the test piece from working, and split the structure to remove the part that needs to be monitored for off-line condition monitoring, such as acoustic emission, X-ray, ultrasound, thermal imaging, etc [Citation5–9]. The traditional off-line monitoring method has many shortcomings. The characteristics of long cycle and many steps make offline monitoring unable to work in some conditions. With the innovation of monitoring methods, the development of sensors makes online monitoring become the latest research focus. For example, Qiu et al. [Citation10–12] proposed several impact location imaging methods to achieve impact location monitoring of composite materials. Andreades et al. [Citation13] introduced a novel nonlinear ultrasonic SHM method to monitor impact damage in composite laminates using an array of surface-bonded sensors. Kundu et al [Citation14,Citation15] proposed a method for microcrack localization based on cross-shaped sensor clusters in a plate and used acoustic positioning technology to quickly locate and monitor the damage of composite laminates. Navazi et al. [Citation16] developed the hybrid Delay-And-Sum (DAS) with Sparse Reconstruction (SR) method for damage location in composite plates. Mitra et al. [Citation17] provides a state of the art review of guided wave based structural health monitoring (SHM). Zhang et al. [Citation18] evenly arranges the piezoresistive pressure sensor on the surface of the specimen, uses the air gun impact test device to impact the specimen, and determines the impact damage according to the response of the sensor. Bae et al. [Citation19] prepared P(VDF-TrFE) film sensors to monitor the results of matrix cracking and delamination caused by impact on composite laminates. Zhong et al. [Citation20–23] designed several sensor arrays and proposed corresponding impact location algorithms to complete the impact location monitoring of composite materials. The above method is to arrange various sensors on the surface of the structure, and carry out impact monitoring and damage analysis on the surface of the sample. In addition, it is also worth considering the internal cracks of the specimen under impact. In this regard, scholars have tried to place sensors inside the specimen to monitor the damage inside the specimen under impact loading. For example,Takeda et al. [Citation24] embedded the fiber grating sensor (FBG) in composite laminates to monitor impact damage inside composite laminates. Yu et al. [Citation25] proposed an impact localization algorithm based on the recursive quantitative analysis(RQA) of Bragg grating sensors. The position of the impact localization point is calculated according to the distance between the impact point and the Bragg grating sensor. However, the fiber grating sensor has a large size so that it cannot be formed with the composite structure. As claimed by Zhang et al. [Citation5] in this article, the sensor embedded in the FRPs will damage the structural integrity of the composite material, which is not conducive to the manufacture of composite materials. With the development of carbon nanofilm sensors, the problem of integrated molding of composite materials and sensors has been solved. Carbon nano film has good ductility and strength, can be well combined with the flat structure and integrated molding, the performance of the material structure will not cause interference. Wan et al. [Citation26] embedded carbon nanosensors in laminates to form a sensor network. According to the resistance change of the sensor in the experiment, a data processing method is proposed, which can calculate the impact point and complete the impact location monitoring of the laminate during service. The results show that the minimum distance between the positioning result and the real impact point is 2.2 mm. However, the overlap area between the carbon nanotubes is limited, resulting in a low sensitivity of the sensor and an insignificant capture of damage caused by smaller loads. With the addition of two-dimensional nanomaterials, the sensor structure is obviously improved, and the sensing performance of the nano sensor is improved. Zhao et al. [Citation27] prepared MXene/CNT composite films with much higher conductivity than pure MXene films and pure CNT films. Cai et al. [Citation28] fabricated a MXene/CNT composite strain sensor using layer-by-layer spraying technology, which has excellent performance with ultra-high sensitivity and wide service range. The disadvantage is that the preparation process of the sensor is complex and the capture of small impact is not obvious.
Referring to the above work, this paper uses a new resistance change analysis technique to monitor the low-velocity impact location in FRPs panels. On the basis of the research results of the research group [Citation29–32], we have improved the preparation process of the thin film sensor. The MXene dispersion, carbon nanotube dispersion, and copper nanoparticles (CuNps) dispersion were stacked to form a sandwich structure film by alternating suction filtration. It can effectively improve the sensitivity of the sensor, and the sensor array is designed. A calculation method of weight function compensation positioning is proposed. Through ultrasonic C-scan detection, it is proved that the method proposed in this paper is correct and effective. The impact positioning calculation can be completed through the algorithm under the condition of only measuring the resistance change rate of the sensor array. The sensor preparation process is simple, and the requirements for monitoring equipment are low. It is easy to carry and measure, which improves the deficiencies of the above literature.
2. Experimental procedure
2.1 Preparation process of MXene/CNT/CuNps composite film
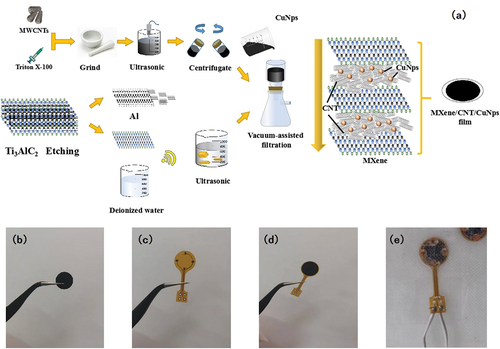
Mix and grind 700 mg carbon nanotubes (Carbon nanotubes (TNIM1) with a purity higher than 95% were purchased from the Chinese Academy of Sciences. The length and diameter of MWCNTs are in the range of 10–30 nm and 5–12 nm) and 10 ml triton X-100, add 1200 mL deionized water for mechanical stirring, and perform ultrasonic crushing and high-speed centrifugation to obtain a carbon nanotube dispersion. Add 2 g Ti3AlC2 powder to 5 mL concentrated hydrochloric acid, and add 1.5 g lithium fluoride powder to stir, after the reaction is complete, perform high-speed centrifugation, use deionized water to wash the solution repeatedly until the pH of the supernatant is less than 7, and perform high-speed centrifugation again to obtain MXene dispersion liquid. Nano-copper suspension is purchased. The carbon nanotube dispersion, MXene dispersion, and CuNps dispersion are alternately filtered to form a sandwich structure. is a schematic diagram of the process for preparing MXene/CNT/CuNps thin films. First, the dispersed carbon nanotube aqueous solution is filtered to form a dense film, and then the colloidal solution containing the layered suspended Ti3AlC2 sheets is filtered to form a continuous MXene thin layer. Finally, add a little nano copper dispersion, which is continuously alternately operated to make a composite film. We dry the filtered film. It should be noted that this process must isolate oxygen. Oxygen in the air oxidizes MXene and degrades sensor performance. The prepared film is cut into circles, and the film is bonded to a flexible printed circuit using conductive silver paste to assemble a complete sensor. The sensor and the data collector are connected by wires, the sensor is placed on the specimen, and then start monitoring.
Figure 1. (a) preparation of sandwich-like MXene/CNT/CuNps films. (b) crop the sensor into a circle. (c) printing flexible circuits. (d) use conductive silver paste to combine sensors and flex circuits. (e) connect the sensor to the wire and cure it together with the composite material, then connect it to the data collector for work.
2.2 Sensor array
2.2.1 The principle of sensor positioning
The MXene/CNT/CuNps thin film sensor is a piezoresistive sensor. When subjected to impact and vibration, the external mechanical energy is converted into the internal energy of the composite laminate, and the energy is conducted along the fiber direction, the composite laminate will produce invisible damage. MXene/CNT/CuNps sensor receives the energy vibration from the fiber direction. The microstructure changes, resulting in a tunnel effect [Citation33], and the resistance changes. In the MXene/CNT/CuNps sensor, the resistance change rule of the MXene sheet is:
Where,R is the total resistance of the MXene sheet,Rn represents the resistance of the n-th conductive branch network overlapping in the MXene sheet. The variation rule of the resistance RM of the carbon nanotube layer is:
In the formula, h is the Planck’s constant, A is the cross-sectional area of tunnel conjunction (here the average cross-sectional area of CNT is approximately adopted), d is the distance between adjacent CNT, m is the mass of the electron,e is the single electron charge, and λ is the height of energy barrier for CNT-based composite system. According to the above formula, it can be analyzed that the resistance of the sensor is mainly determined by the critical distance of the tunnel. The introduction of nano-copper particles can better support the lamellar structure, so as to obtain higher sensitivity. We tested the stability and sensitivity of the prepared new composite film sensor. The test results and the microscopic mechanism of the sensor are shown in .
Figure 2. (a) Sensitivity test diagram of different thin film sensors. (b) MXene/CNT/CuNps stability test diagram. (c) Scanning electron microscopy of composite film under impact (Due to the small size of nano-copper, not marked in the figure). (d) Mechanism of sensor resistance change.
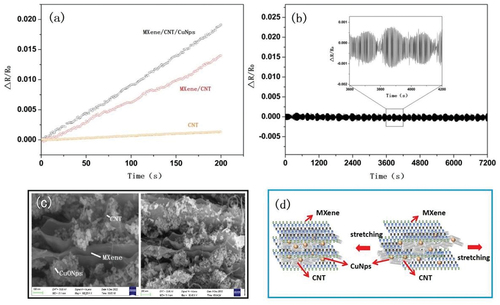
It can be clearly seen from that the invisible impact damage changes the microstructure of MXene/CNT/CuNps under impact, and the film structure undergoes tensile behavior with the accumulation of impact damage, and the tunnel resistance increases, resulting in MXene/CNT/CuNps sensor resistance changes.
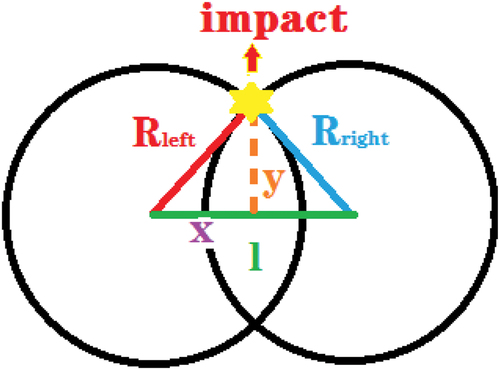
Seven prepared composite film sensors are placed on the same straight line of the test piece, impacting the No. 4 sensor in the middle, and the response changes of the resistance on both sides can be obtained. Taking the maximum resistance change rate of each sensor, the curve function of the maximum resistance change rate of this group of sensors can be obtained, which is called the impact conduction function. According to the impact transfer function, it can be calculated by the intersection of any two sensor transfer functions to complete the one-dimensional linear impact positioning. Similarly, two-dimensional plane impact positioning requires at least three sensors, as shown in the schematic diagram.
2.2.2 Design of sensor array
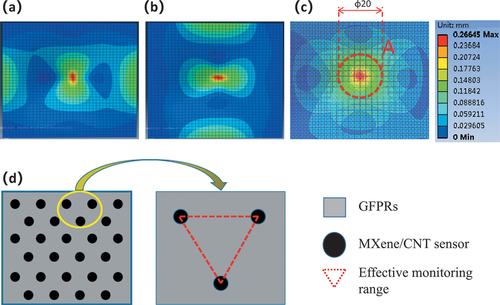
According to , it can be seen that the change rate of sensor resistance near the impact point is the largest. As the distance increases, the change rate of sensor resistance decreases, which proves that the MXene/CNT/CuNps composite film sensor has a certain monitoring range. When the distance reaches a certain distance, the resistance hardly changes, so it is vital to consider the effective monitoring range of sensor. We used ANSYS software to simulate the impact deformation of the test piece. The material of the test piece is unidirectional glass fiber prepreg (6501/G15000/33%). The finite element model of composite laminates is established by two-dimensional shell element. The mesh size is 5 mm. The stacking sequence is [0.90]10, and the material is glass fiber and epoxy resin. In this paper, the progressive damage analysis method is adopted. Based on the Hashin failure criterion, the damage propagation of composite laminates under impact is obtained by using ANSYS software for nonlinear solution. According to the simulation results, it can be seen that the fiber directions of each layer of the composite laminate are different, with the result that the fiber direction deformation after impact is significantly larger than the fiber normal deformation. Before the monitoring starts, the MXene/CNT/CuNps sensor array should be placed between the first and second layers of the fiber composite sheet and molded in one piece. The first layer and the second layer on the upper surface of the test piece are used for composite simulation. The area A in the figure can be regarded as the impact center point and the uniform diffusion deformation around, that is, the impact point is the center of the circle, a circular area with a diameter of 20 mm is a good range for the sensor laying distance. According to the simulation, we got a better range of the sensor laying distance, and designed a three-point sensor matrix array, the laying pattern is an equilateral triangle, and the side length of the equilateral triangle is the optimal sensor distance for simulation,which is shown in .
Figure 3. (a) one-dimensional sensor positioning principle.We can determine the impact location by the intersection of the two sensor functions. (b) two-dimensional sensor positioning principle.The impact point location is derived from the intersection of the three sensing radii.
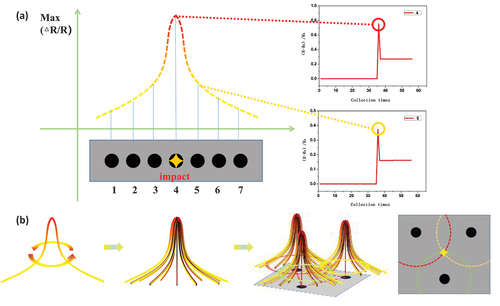
Figure 4. (a) Composite laminate layer 1 simulation. (b) Composite laminate layer 2 simulation.(c) Layer 1 and Layer 2 overlay simulation, which can be used to determine the optimal laying distance of the sensor. (d) Three-point sensor matrix array.
2.3 Three-point sensor positioning algorithm
According to the mechanism of thin film sensor, a localization algorithm of three-point sensor is proposed. The sensor array is arranged at three points. Each working group (three sensors are one group) is composed of an equilateral triangle with a side length of 20 mm. According to the impact response value of the sensor, the maximum three points are selected and combined into an equilateral triangle area, which is the impact location area. Data processing is performed according to the left and right sensors, and the response value is used as the input of the algorithm to calculate the impact location point.
Once the impact area is determined, the left and right sensor responses can be used as input to the algorithm for calculation. First, measure the sensor’s maximum response value α (impact point) and minimum response value β (most distal end) through pre-experiment. The simulation calculation shows that the sensor laying distance is l (unit: mm), and the sensor response value is γn (n is the sensor number). The response rate of change δ is obtained:
Calculate the sensor radius RLeft , Rright,where:
Calculate the positioning point: Use Heron’s formula [Citation34], Pythagorean theorem [Citation35] and other mathematical formulas to carry out plane geometric analysis, and obtain the intersection point of the sensing radius based on sensor 1 as the calculated impact point (the left side of the equilateral triangle area that covers the impact point by default). The vertex is sensor 1), which is specifically expressed as:
Where,ξ represents a constant term whose value is half of the sum of the lengths of the three sides of the triangle, and S△ represents the area of the triangle. Based on the position of the sensor 1 point, the Y coordinate y is (positive and negative are determined by the localized sensor):
The X coordinate x is:
Output x, y. It is obtained that the coordinates of the impact point calculated based on the position of sensor 1 are (x,y). The principles of planar geometric analysis is shown in .
Figure 5. Principles of planar geometric analysis.
Tests have shown that there are certain errors in the three-point impact positioning method. The three-point impact positioning method can control the errors in the X and Y directions within 10%, including the uncertain error of the energy transmission of the impact fiber composite laminate along the fiber direction and the sensor response error. A weighted compensation positioning algorithm is proposed. The impact point is calculated multiple times and the results are weighted to obtain more accurate calculation results.
3. Weighted compensation positioning algorithm and experimental verification
3.1 Weighted compensation localization algorithm
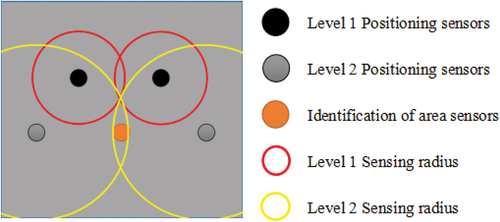
is a schematic diagram of the weighted compensation positioning algorithm. The red sensing radius is the primary fixed distance sensor, the yellow sensing radius is the secondary fixed distance sensor, and the others are localized sensors. Ideally, the response of the sensor closer to the real impact point will be more accurate, so the weight should be larger. According to the sensor arrangement and response results, more sensor positioning groups can be found, and with weights, the impact positioning results can be calculated more accurately, and the error value is smaller, so as to achieve the purpose of precise positioning.
Figure 6. Schematic diagram of the weighted compensated positioning algorithm.
After theoretical analysis, the weighted compensation accuracy algorithm expression is:
Where, ωi represents the weight function, and the weight function compensation positioning method determines the weight according to the ratio of the sensor laying distance to the total distance l, θi represents the calculated distance between the impact point and the sensor 1 in the X or Y direction. ωi is specifically expressed as:
3.2 Experimental process
3.2.1 Preparation of specimen
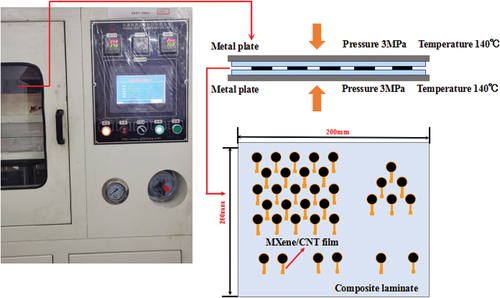
The phase change of the resin in composite manufacturing can be sensed by the MXene/CNT film sensor. We cut the prepreg into 200 mm × 200 mm rectangles and stack 10 layers in alternate layers([0,90]10). Flexible printed circuit (FPC) is a circuit board based on polyester film or polyimide, which has the advantages of high reliability, high flexibility, and lightweight. The MXene/CNT/CuNps thin film sensor is divided into several 10 mm diameter wafers, coated with conductive silver paste on the electrode of the flexible circuit board, the cut film sensor is pasted on the FPC surface by conductive silver paste, and then placed in the oven, the temperature is set to 70°C for 15 min. We put the prepreg embedded in the film sensor into the molding machine, loaded 3 Mpa pressure, heating mold to make the prepreg complete the curing process. The principle is shown in . According to the prepreg supplier‘s advice, we put the temperature to 140°C, then constant temperature for 3 h.
Figure 7. Schematic diagram of fabrication of composite laminates.
The specimen is divided into pretest area, verification area, and test area. The function of the pretest area is to test the maximum response and minimum response of the sensor, and provide parameters for the subsequent test calculation. The verification area is used for the theoretical calculation test of the specimen. When the impact experiment in the verification area is successfully verified by the algorithm calculation, the surface impact test of the specimen can be carried out. The test area is the area where the final test is performed. The designed sensor array is laid on the surface of the specimen to be monitored, and then real-time impact monitoring can be performed.
3.2.2 Experimental design and results
We design an impact test bench. Lap the slide rail device and install the dart on the slider, so that the slider can do free fall motion from the top of the slide rail. A horizontal stage is fixed at the lower end of the bench, and the test piece is fixed with screw iron clips around it. When the impact test is performed, the specimen is fixed on the stage, and the slider is raised to a preset height and then falls freely. During the impact process, a data collector is placed at the lower end of the stand to record sensor data.
We number the 23 sensors in the sensor array in the test area as shown in . Fix the test piece on the impact stand. After determining the optimal sensor array placement distance and the completion of the pre-experiment, the dart was released statically at a height of 300 mm and the impact energy is 6.468 J. Two Flukes were used to record the sensor parameter changes and record the experimental data. The experimental data is processed, and the sensor with the largest resistance change rate is selected as the first-level fixed-distance sensor. According to the three-point sensor arrangement, the third point with a larger resistance change rate in the upper and lower two equilateral triangles is selected as the localized sensor, so as to determine the impact location area. The left and right sensors of the localized sensor are selected as secondary fixed distance sensors. According to the sensor serial number that determines the impact area, the resistance change rates of the six sensors with the largest indication are shown in .
Figure 8. (a) sensor array area.Each sensor is assigned an independent number, and the data changes of each sensor in the experiment are recorded. (b) Low-velocity impact test setup.
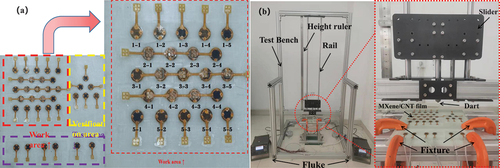
Figure 9. (a) select the 6 sensors with the largest resistance change from the 23 sensor data, and use different shapes and colors to represent the sensors with the largest resistance change rate.(b) compare the resistance response of each sensor after impact. It can be seen that the resistance change rate near the impact point is larger, and with the weighted compensation positioning algorithm, impact positioning monitoring can be performed.
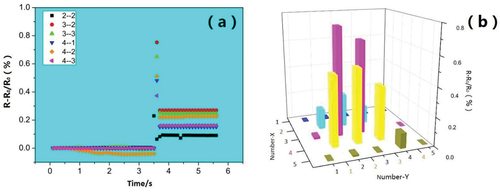
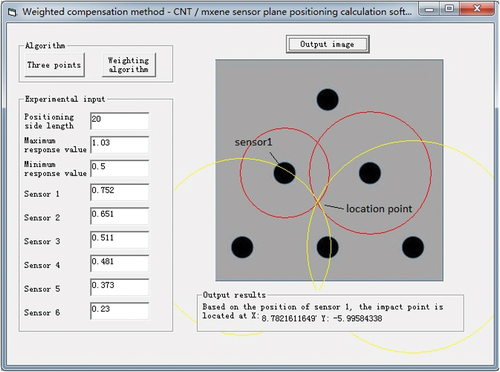
It can be seen that the resistance change rate of the sensor closer to the impact point is larger, and the resistance change rate of the sensor farther away from the impact point does not change or has a smaller response. Process the above experimental data, use the Visal Basic software to program the algorithm, input the pre-experimental parameters and experimental data. The calculation result is as shown in the , according to the weighted function compensation positioning algorithm, the result is based on the position of the No. 1 sensor (8.7822, −5.9958).
Figure 10. Input the maximum sensor resistance change rate indication after measurement.Through the weight function compensation positioning algorithm, the calculation result is(8.7822,-5.9958).
3.2.3 Validation of experimental results
Ultrasonic C-scan is one of the traditional impact location monitoring methods [Citation36–38]. Its principle is simple, and it is widely used in impact location monitoring in offline state.
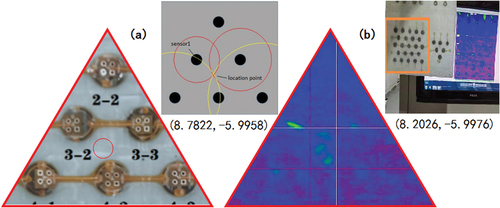
The impacted composite material laminate was removed, and ultrasonic C-scan detection was performed. In , the red circle area is the positioning point given by the sensor array response calculation. shows the detection result of ultrasonic C-scanning. It can be seen that the position of the impact point of ultrasonic C-scanning imaging is very close to the calculation point of the weight function compensation positioning algorithm. The impact point coordinate obtained by C-scan is (8.2026, −5.9976), the results show that the error of the weight function compensation positioning algorithm in the X direction is 7.1%, and the error in the Y direction is only 0.03%, which verifies that the weight compensation algorithm can calculate the impact more accurately than the three-point positioning algorithm. The position of the point has a good positioning and monitoring ability for the impact positioning of the composite laminate.
Figure 11. (a) the red circle is the positioning point obtained after calculation. (b) c-scan results of the impacted specimen.
4. Conclusion
In this paper, the manufacturing process of MXene/CNT thin film sensor is optimized, we propose a new preparation method of MXene/CNT/CuNps film sensor, and the performance of the sensor is improved. Through the simulation of the impact object, the optimal sensor placement array is determined. An impact localization algorithm for three-point sensor array is proposed and programmed. During the monitoring process, acquisition sensor array resistance response changes by algorithm to solve the impact position, and the comparison and verification with the ultrasonic C-scan were carried out, and the following conclusions were drawn:
1) The sensor after optimizing the preparation process showed more stable performance. The response of the sensor array can be consistent with the impact behavior, which provides a reference for the impact location monitoring of composite materials.
2) A three-point type and weight function compensation positioning algorithm is proposed. According to the resistance change rate of the sensor at each point of the sensor array, the coordinate of the impact point is calculated by the algorithm. The experimental verification shows that the error range between the coordinate point calculated by the three-point positioning calculation method and the real impact coordinate point is stable below 10%, and the weight function compensation positioning algorithm has an error of 7.1% in the X direction and 0.03% in the Y direction, which validates our proposed method.
3) The weight function compensation positioning method is programmed to generate visual software, which is convenient for engineering application.
Acknowledgments
This work was financially supported by National Natural Science Foundation of China (11902204), Liaoning Revitalization Talents Program (XLYC2007118), Aeronautical Science Foundation (201903054001), Shenyang Youth Technological Innovation Talent Project (RC200030), Shenyang Natural Science Foundation Project (22-315-6-07), Education Department of Liaoning Province’s Item (LJKQZ 20222263) and Basic Scientific Research Project of Liaoning Provincial Department of Education (LJKMZ20220566).
Disclosure statement
The authors declare that they have no known competing financial interests or personal relationships that could have appeared to influence the work reported in this paper.
References
- Sánchez DM, Gresil M, Soutis C. Distributed internal strain measurement during composite manufacturing using optical fibre sensors. Compos Sci Technol. 2015;120:49–57.
- Chandarana N, Sanchez DM, Soutis C, et al. Early damage detection in composites during fabrication and mechanical testing. Materials. 2017;10(7):685. DOI:10.3390/ma10070685
- Jeong C, Lee TH, Noh SM, et al. Real-time in situ monitoring of manufacturing process and CFRP quality by relative resistance change measurement. Polym Test. 2020;85:106416.
- Yang B, Wang Z, Zhou L, et al. Experimental and numerical investigation of interply hybrid composites based on woven fabrics and PCBT resin subjected to low-velocity impact. Compos Struct. 2015;132:464–476.
- Zhang D, Yang B, Tan J, et al. Impact damage localization and mode identification of CFRPs panels using an electric resistance change method. Compos Struct. DOI:10.1016/J.COMPSTRUCT.2021.114587.
- Saeedifar M, Najafabadi MA, Yousefi J, et al. Delamination analysis in composite laminates by means of acoustic emission and bi-linear/tri-linear cohesive zone modeling. Compos Struct. 2017;161:505–512.
- Cheon JH, Shin ES. Assessment of the ablation characteristics of carbon/phenolic composites using X-ray microtomography. Compos Sci Technol. 2019;182:107740.
- Caminero MA, Garcia-Moreno I, Rodríguez GP, et al. Internal damage evaluation of composite structures using phased array ultrasonic technique: impact damage assessment in CFRP and 3D printed reinforced composites.Compos Part B. Eng. 2019;165:131–142.
- Lisle T, Pastor M, Bouvet C, et al. Damage of woven composite under translaminar cracking tests using infrared thermography. Compos Struct. 2017;161:275–286.
- Qiu L, Yuan SF. Zhang XY et al.A time reversal focusing based impact imaging method and its evaluation on complex composite structures. Smart Mater Struct. 2011;20(10):105014.
- Qiu L, Liu ML, Qing XL, et al. A quantitative multidamage monitoring method for large-scale complex. Compos Struct Health Monit. 2013;12(3):183–196.
- Ren YQ, Qiu L, Yuan SF, et al. A diagnostic imaging approach for online characterization of multi-impact in aircraft composite structures based on a scanning spatial-wavenumber filter of guided wave. Mech Syst Signal Process. 2017;90:44–63.
- Andreades C, Fierro GPM, Meo M, et al. A nonlinear ultrasonic SHM method for impact damage localisation in composite panels using a sparse array of piezoelectric PZT transducers. Ultrasonics. 2020;108: 106181. prepublish. DOI: 10.1016/j.ultras.2020.106181
- Yin SX, Xiao HP, Xu CB, et al. Microcrack localization using nonlinear Lamb waves and cross-shaped sensor clusters. Ultrasonics. 2022;8(124):106770.
- Zhou ZX, Cui ZW, Liu JX, et al. A rapid technique for detecting and localizing damage in composite laminates. Eng Fract Mech. 2023;277:277.
- Nokhbatolfoghahai A, Navazi HM, Groves RM. Using the hybrid DAS-SR method for damage localization in composite plates. Compos Struct. 2020;247:112420. prepublish. DOI:10.1016/j.compstruct.2020.112420.
- Mitra M, Gopalakrishnan S. Guided wave based structural health monitoring: a review. Smart Mater Struct. 2016;25(5):053001.
- Zhang Z, Xu Z, Shao X, et al. Damage boundary of piezoresistive pressure sensor under shock environment.Acta ASTRONAUTICA. Acta Astronaut. 2022;192:328–340.
- Bae JH, Lee SW, Chang S-H. Characterization of low-velocity impact-induced damages in carbon/epoxy composite laminates using a poly(vinylidene fluoride–trifluoroethylene) film sensor. Composites Part B. 2017;135:189–200.
- Li R, Zhong YT, Xiang JW. FEM simulation based adaptive sensors array error compensation method for impact monitoring on stiffened composite structures. Thin Walled Struct. 2022;174:109074.
- Zhong YT, Xiang JW. Impact location on a stiffened composite panel using improved linear array. Smart Struct Syst. 2019;24(2):173–182.
- Zhong YT, Xiang JW, Gao HF, et al. Impact energy level assessment of composite structures using MUSIC‐ANN approach. Struct Control Health Monit. 2016;23(5):825–837. DOI:10.1002/stc.1815
- Zhong YT, Xiang JW. A two-dimensional plum-blossom sensor array-based multiple signal classification method for impact localization in composite structures. Comput-Aided Civ Infrastruct Eng. 2016;31(8):633–643.
- Takeda S, Aoki Y, Nagao Y. Damage monitoring of CFRP stiffened panels under compressive load using FBG sensors. Compos Struct. 2012;94(3):813–819.
- Yu JS, Liang DK. Impact localization system of composite structure based on recurrence quantifcation analysis by using FBG sensors. Opt Fiber Technol. 2019;49:7–15.
- Wan Y, Diao C, Yang B, et al. GF/Epoxy laminates embedded with wire nets: a way to improve the low-velocity impact resistance and energy absorption ability. Compos Struct. 2018;202:818–835.
- Zhao MQ, Ren CE, Zheng L, et al. Flexible MXene/carbon nanotube composite paper with high volumetric capacitance. Adv Mater. 2015;27(2):339–345. DOI:10.1002/adma.201404140
- Cai YC, Shen J, Ge G, et al. Stretchable Ti3C2Tx MXene/carbon nanotube composite based strain sensor with ultrahigh sensitivity and tunable sensing range. ACS Nano. 2018;12(1):56–62. DOI:10.1021/acsnano.7b06251
- Wang XQ, Li BH, Zhang DQ, et al. Strain monitoring using carbon nanotube buckypaper sensor on composite repaired structure. Appl Phys A. 2021;127(12). DOI:10.1007/s00339-021-05099-z
- Wang XQ, Lu J, Lu SW, et al. Health monitoring of repaired composite structure using MXene sensor. Compos Commun. 2021;27:27.
- Lu SW, Zhao CX, Zhang L, et al. Real time monitoring of the curing degree and the manufacturing process of fiber reinforced composites with a carbon nanotube buckypaper sensor. RSC Adv. 2018;8(39):22078–22085. DOI:10.1039/C8RA03445A
- Zhang L, Lu Y, Lu SW, et al. Lifetime health monitoring of fiber reinforced composites using highly flexible and sensitive MXene/CNT film sensor. Sens Actuators A. 2021;332(2):113148. DOI:10.1016/j.sna.2021.113148
- Yang H, Yuan L, Xf Y, et al. Piezoresistive response of graphene rubber composites considering the tunneling effect. J Mech Phys Solids. 2020;139: 103943. prepublish. DOI: 10.1016/j.jmps.2020.103943
- Leng GS. Inequalities for edge lengths and volumes of two simplexes. Geometriae Dedicata. 1997;68(1):43–48.
- Georges JS. THE PYTHAGOREAN THEOREM. Sch Sci Math. 1927;27(4):367–378.
- Abdel-Motaleb IM. Investigation of inhomogeneity in single crystal SiC wafers using C-scan acoustic scanning microscopy. Cryst Struct Theory Appl. 2020;09(01):1–11.
- Hasiotis T, Badogiannis E, Tsouvalis NG. Application of ultrasonic C-scan techniques for tracing defects in laminated composite materials. Strojniški vestnik – J Mech Eng. 2011;57(3):192–203.
- Li P, Gao XJ, Luo Y, et al. Defect monitoring of CFRP with ultrasonic C-scan method. Adv Mater Res. 2011;1269(243–249):5343–5348. 10.4028/https://www.scientific.net/AMR.243-249.5343