
Abstract
The National Aeronautics and Space Administration (NASA) of the United States has launched several rover missions for Martian surface exploration. The two most recent ones include the Mars Exploration Rover (MER) mission in 2003 and the Mars Science Laboratory (MSL) mission in 2011. Both of these missions require highly accurate rover localization and navigation techniques to obtain precise rover traverse information in order to develop long-term science planning and execute daily operations. This paper discusses several localization and navigation techniques for the MER and MSL rovers by using satellites and the instruments on board the rovers, and compares their advantages and disadvantages. The techniques discussed include wheel odometry, visual odometry, incremental bundle adjustment, identifying rovers directly from high-resolution satellite images, and matching ground features between rover images and satellite images.
1. Introduction
Humans have been endeavouring to explore Mars since 1960s, when the USSR launched the first Mars probe (NASA History Program Office Citation2012). As part of its competition with the USSR in the early years, and later for the sake of sheer scientific research and exploration itself, NASA (National Aeronautics and Space Administration of the United States) has been launching various orbital and landed vehicles to Mars. The most recent rover missions include the Mars Exploration Rover (MER) mission in 2003 and the Mars Science Laboratory (MSL) mission in 2011.
The MER mission sent twin rovers, Spirit and Opportunity, to the Martian surface to collect planetary geological information and to search for and characterize a wide range of rocks and soils that could hold clues to past water activity on Mars (Squyres et al. Citation2003). Spirit was launched on 10 June 2003, and Opportunity was launched on 7 July in the same year. They landed on Mars 4 January and 25 January 2004, respectively. While both rovers were designed for operations of 9 months, Spirit explored her landing site in Gusev crater for over 7 years and completed her journey at Troy, near Home Plate on Mars; Opportunity is currently exploring Endeavor crater at Meridiani Planum. Both rovers have found past water evidences on Mars (Herkenhoff et al. Citation2004; Squyres et al. Citation2012).
The MSL mission launched the Curiosity rover on 26 November 2011. Curiosity landed on the Martian surface on 6 August 2012. Taking one step further than the MER mission, the main scientific goal of this mission is to search for past and/or present habitable environments on Mars (Grotzinger et al. Citation2012). The analysis of the heated Martian finds indicated water bound up in the sample (Leshin et al. Citation2013).
Both of these missions require high accurate rover localization and navigation techniques to obtain precise rover traverse information in order to develop long-term science planning and execute daily operations. This paper discusses localization capabilities of the MER and MSL rovers.
2. Instruments for localization and navigation on Mars
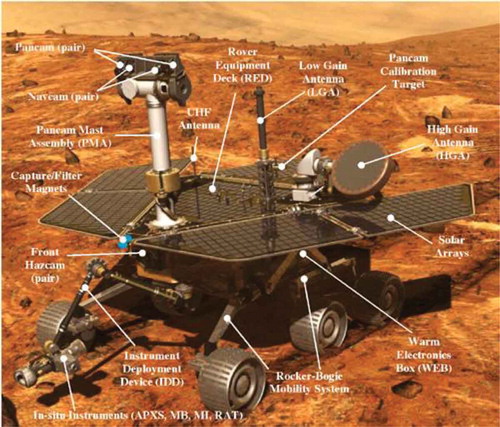
Each of the twin MER rovers, Spirit and Opportunity, has two Hazcam, one Navcam and one Pancam stereo camera systems (Li et al. Citation2004). The front and rear Hazcams are used for hazard avoidance, the Navcams serve for navigation purposes, and the Pancams are used to study the Martian terrain. The Navcams and Pancams are mounted on the rover mast, 1.54 m above the ground (Maki et al. Citation2003; Li et al. Citation2005). The mast can point the camera pairs 360° in azimuth and 91° to −87° in elevation. The Navcams are f/12 cameras with a focal length of 14.67 mm and a 45° × 45° field of view (FOV) (60.7° on the diagonal). The angular resolution at the centre of the FOV is 0.82 mrad/pixel. The depth of field ranges from 0.5 m to infinity, with best focus at 1.0 m (Li et al. Citation2005). The stereo baseline is 20 cm. For Pancams, the stereo baseline is 30 cm and the focal length is 43 mm. The effective depth of field is 1.5 m to infinity, being best at 3 m (Maki et al. Citation2003; Bell et al. Citation2003). The two Pancam cameras have twelve bands (0.4 to 1.0 μm) for stereoscopic imaging with 0.28 mrad instantaneous field of view (IFOV) and 16.8° × 16.8° field of view (FOV) (Maki et al. Citation2003). One pair of Hazcams is mounted on each of the front and rear ends of the rovers’ warm electronics boxes below the solar panel, with a 10-cm baseline formed between the two cameras in an assembly (Maki et al. Citation2003). See for the instruments carried on-board the MER rovers.
Figure 1. MER rover and instruments (http://marsrover.nasa.gov/mission/spacecraft_surface_rover.html).
The MSL rover Curiosity has two Navcam and four Hazcam stereo camera systems using cameras identical to the Navcams and Hazcams on the MER rovers. It also has a Mastcam stereo pair of cameras in place of the MER Pancams (Grotzinger et al. Citation2012). A primary Navcam stereo pair and the Mastcam stereo pair of cameras are mounted on top of the Remote Sensing Mast (RSM) approximately 2 m above ground level (Grotzinger et al. Citation2012). A front Hazcam pair of cameras is mounted on the front panel of the rover body and a rear Hazcam pair is mounted on the back panel of the rover body. In addition to the aforementioned primary cameras, an extra Navcam pair and an extra front/rear Hazcam pair provide redundant backups (Grotzinger et al. Citation2012).
The Mastcams are designed for panoramic, colour and multispectral imaging as well as colour videoing of the landscape; they are also used for the observation of clouds and aerosols (Bogue Citation2012). The cameras are about 1.97 m above the bottom of the wheels when the rover is on a flat surface (). The Mastcams are two fixed-focal length (FFL) cameras with different focal lengths and different science colour filters ( and ). According to Mars Science Laboratory Mission and Science Investigation by Grotzinger et al., the stereo baseline of the pair is about 24.5 cm. The cameras are capable of acquiring images at very high frame rates, including 1280 × 720 pixel high-definition video at about 8 frames per second (fps), and full science frames at somewhat less than 4 fps. The radiometric accuracy is ≤10–15%, with a precision of 5–8% (Grotzinger et al. Citation2012).
Figure 2. Curiosity and its instruments (NASA/JPL, http://mars.jpl.nasa.gov/msl/mission/instruments/).
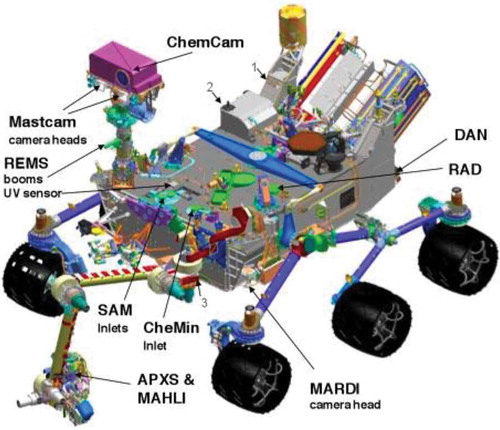
Table 1. Filters equipped on the two MSL Mastcams. Source: Modified from NASA/JPL (2012), http://msl-scicorner.jpl.nasa.gov/Instruments/Mastcam/.
Table 2. Parameters of the MSL Mastcams.
Both MER and MSL rovers are equipped with an IMU (inertial measurement unit) that provides attitude information of the rovers in the Mars Body Fixed (MBF) frame. The above rover cameras can also observe the Sun to obtain the improved azimuth information. The wheel odometers collect counts of the wheel turns to calculate the travelled distance.
3. Prelanding mapping and initial lander/rover localization
3.1. Topographic mapping of landing sites
For landed missions, it is crucial to have accurate topographic information at hand when the spacecraft executes the entry, descent and landing (EDL) process (Kirk et al. Citation2008). Therefore, digital terrain models (DTMs) with high ground resolution and high accuracy are extremely desirable. Due to the limited number of Mars orbiters, researchers have to exploit the existing data sources as much as possible. Thus, many new methods have been developed for Mars mapping based on orbital data.
Attempts to send probes to Mars and take photos of the Martian surface began in 1960s, initiated by the USSR, but not until 1967 was the goal reached by the United States, when Mariner 4 flew by the red planet and took 22 photos. Up till now, several probes have made it to Mars, taking images at different resolutions. shows examples of cartographic mapping instruments on board of some recent Mars orbital missions by NASA and European Space Agency (ESA) (Shan et al. Citation2005; Kim and Muller Citation2009; Li et al. Citation2011b; NASA History Program Office Citation2012).
Table 3. Examples of sensors for Mars cartographic mapping on board Mars orbiters.
DTMs with a grid spacing of 1 m can be produced from HiRISE stereo pairs (Kirk et al. Citation2008). A stereo matching accuracy approaching 0.2 pixels has been achieved. Except in very steep or featureless terrain, little interactive editing is required. The products have been used for landing site selection and surface operations. Kim and Muller (Citation2009) generated stereo DTMs at various grid spacings ranging from 50 m up to 0.7 m using a multi-resolution geodetic control strategy. This method uses a simplified photogrammetric approach and the products can be used to investigate and interpret important geological and geomorphological features. HiRISE images were used to produce DTMs of MER landing sites at a grid spacing of 1 m. Orthophotos with a resolution of 0.25 m were also produced at the same time. They have been used for supporting landing site science exploration and tactical operations (Li et al. Citation2011b). Parker et al. (Citation2012) generated base maps for localization, mission planning and geologic mapping in both the MER and the MSL missions by using a pyramidal georegistration of HiRISE, CTX and HRSC imagery with respect to the MOLA global and local HRSC DEMs.
3.2. Initial localization for MER rovers
The initial location of Spirit was determined by orbiter-based Doppler positioning, EDL process reconstruction and cartographic intersection using common features in the lander, descent and orbiter images (Li et al. Citation2005). The location provided by Doppler positioning was determined in the inertial reference system and transformed to MBF, which is 12 km east of the landing ellipse centre (Guinn and Ely Citation2004; Golombek and Parker Citation2004). The optimal cartographic triangulation was determined by comparison of distinct geological features around the landing site that was later named the Columbia Memorial Station (Golombek and Parker Citation2004; Parker et al. Citation2004; Li et al. Citation2006).
The Opportunity rover was landed in Eagle crater at Meridiani Planum. The location of the lander in the inertial reference system was determined by fitting direct-to-earth (DTE) two-way X-band Doppler radio transmissions and two passes of two-way Ultra High Frequency (UHF) Doppler transmissions between Opportunity and the Mars Odyssey orbiter (Guinn and Ely Citation2004; Golombek and Parker Citation2004). In order to determine the exact crater for landing, a 3-D crater model was generated using a three-tiered Pancam panorama. Crater parameters such as rim size and shape were measured from the crater model and compared with those from the DIMES images (Li et al. Citation2007).
3.3. Initial rover location of the MSL mission
3.3.1. The MSL landing site
Gale crater was selected as the MSL landing site based on optimization of the MSL science objectives and engineering considerations (Grant et al. Citation2011). Gale Crater is a Late Noachian to Late Noachian/Early Hesperian-aged crater (Thomson et al. Citation2011) situated on the dichotomy boundary between the heavily cratered southern highlands and northern lowlands. A prominent mound in its interior is ~5 km high and is similar in height to the southern rim and up to several kilometres higher than the northern rim. The landing ellipse was centred at 4.5° S, 137.4° E and located to the northwest of this mound. The science potential within the landing ellipse was generally considered secondary to that found within the mound material.
In order to ensure a safe landing and traverse for the MSL rover, base maps and DTMs of Gale Crater were prepared prior to landing (Parker et al. Citation2012). These included a two-dimensional image map and DTMs produced from four data sources: MOLA points, HRSC images, CTX images and HiRISE images. A highly precise DTM product with grid spacing of ~0.5 km from MOLA data serves as the base reference elevation data for the current Mars cartographic control and provided an easy translation to inertial space for spacecraft pointing in EDL simulations. HRSC DTMs with a 50-m grid spacing provided the first transition from MOLA data to the higher resolution image data-sets. HRSC enables excellent three-dimensional registration to MOLA data. In addition, most HRSC DTMs are accompanied by an orthorectified 12.5–25 m/pixel panchromatic visible image.
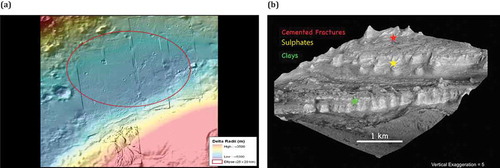
The landing ellipse at Gale Crater and adjacent mountain strata which comprise the region to be explored by the Curiosity rover are shown on the CTX image map (). The DTM of the same area () and a 3D view of strata exposed at the base of Mount Sharp () were constructed by the USGS (Grotzinger et al. Citation2012).
Figure 3. Key science targets at Gale crater shown on a CTX mosaic. The centre of the ellipse is 4.49 S, 137.42 E lat/lon. The ellipse is 20 × 25 km for scale. Images used in the mosaic are: B07_012195_1750_NS_05S222 W, B01_009927_1752_XN_04S222 W, and B21_017786_1746_SN_05S222 W.
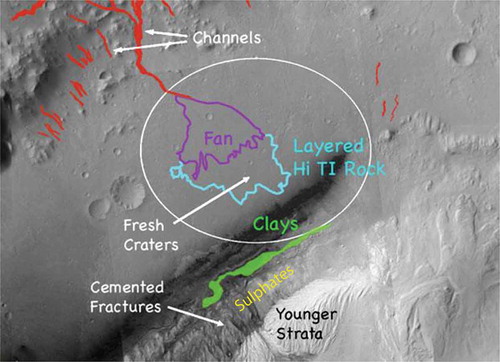
Figure 4. (a) Digital Elevation Model of the Gale crater region. (b) 3D view of strata exposed at the base of Mount Sharp, located in the centre of Gale crater. DEM constructed by USGS based on HiRISE images PSP_001488_1750 and PSP_001752_1750.
3.3.2. EDL and initial rover localization of MSL mission
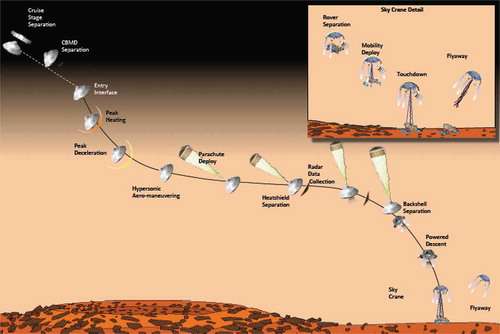
EDL process for the MSL mission was complex and more accurate than the MER mission. illustrates the series of EDL events for MSL (Burkhart and Casoliva Citation2012). The MSL spacecraft made a dramatic entry into the Martian atmosphere and then descended on a parachute. Next, a descent stage carrying Curiosity dropped away and slowed itself further with small rocket engines. Hovering just above the Martian surface, the descent stage became a ‘sky crane’ as it lowered the rover on a tether to the surface, where Curiosity landed on its wheels (Martin-Mur et al. Citation2012). Specifically, the EDL process involves a number of events along the EDL trajectory where various instruments, including an IMU, a Ka-band narrow-beam Doppler altimeter/velocimeter and other devices, were employed to measure and correct the course and to guide the spacecraft to deliver the rover on the targeted area on surface. Details of the EDL technical description can be found in Burkhart and Casoliva (Citation2012).
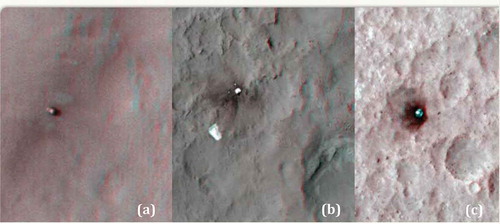
The HiRISE images played an unprecedented role in initial rover localization of the MSL mission. The parachute was imaged during its free fall by HiRISE. The heat shield was found in a HiRISE image (). The Curiosity landing site location was identified by using MARDI thumbnail images on Sol 1. The first 360° Navcam panorama was employed to determine the initial landing location based on a controlled photomosaic of CTX and HiRISE images on Sol 3. The landing site was officially named Bradbury Landing and the location is 4.589467° S, 137.441633° E (MOLA 2000, E longitude) in Gale Crater (Parker et al. Citation2013).
Figure 6. Anaglyph stereo HiRISE images: the MSL rover can be seen as a distinct object in HiRISE image (a), parachute and heat shield are found in (b) and (c).
4. Rover localization along traverse
4.1. Techniques employed for MER localization
Rover localization has been conducted at several levels (Li et al. Citation2004). Within each Sol cycle, on-board IMU and wheel odometry-based localization was regularly performed with infrequent support from sun-finding techniques that improve the quality of the azimuth. The on-board estimate of orientation and position of each rover is updated at a frequency of 8 Hz. Changes in attitude are measured with IMU, while changes in position are estimated with IMU and wheel odometry (Biesiadecki and Maimone Citation2006).
In cases where the rover experiences slippage, caused by traversing on loose soil terrain or against steep slopes (particularly when in craters), the on-board visual odometry (VO) technique was applied. VO is also used whenever a highly accurate rover position is desirable. In general, VO acquires consecutive Navcam stereo pairs within a traverse segment between two rover locations, when Navcam or Pancam panoramas were taken on separate sols. Finally, the bundle-adjustment (BA) technique was used to build an image network containing all panorama and traversing images (along with any available VO results) to achieve a highly accurate localization of rover positions along the entire traverse. BA was conducted on the ground (Li et al. Citation2005).
4.1.1. Visual odometry
The camera-based visual odometry can be used to correct errors in the wheel odometry-based estimates caused by wheel slippage. Visual odometry processing was performed on both MER rovers using mast-mounted Navcam imagery. To ensure that enough features can be tracked, at least 60% overlap between adjacent images is recommended; therefore all visual odometry drives were split into several small steps. During each step the rover was typically commanded to drive no more than 75 cm in a straight line or curved arc and, when turning in place, was commanded to change heading by no more than 18° per step. Although visual odometry processing could have been beneficial during all rover motion, each step required over 2 minutes of processing time on MER’s 20 MHz RAD6000 CPU. Therefore, it was only commanded during relatively short drives (less than 10 m) occurring either on steep slopes (typically more than 10°), or in situations where a wheel is being dragged (digging a trench or conserving drive motor lifetime on Spirit’s right front wheel). The on-board IMU exhibited a very small drift rate (usually less than 3° per hour of operation) and maintained attitude knowledge very well. Therefore, from January through August 2004, only visual odometry was typically used to update rover positions. shows two views of a sample trajectory taken by Opportunity during Sols 188 through 191 (Li et al. Citation2005).
Figure 7. Two views of a sample trajectory correction by visual odometry.
4.1.2. Bundle adjustment for MER localization
To make sure the rover is on the right direction in a blind drive, bundle adjustment is employed to refine the position information of the MER. The bundle adjustment method for rover localization takes a global approach by building an image network of the landing site. Starting at Sol 1 after landing, the accumulated Pancam and Navcam images will be used to progressively build up an image network as the rover traverses the landing site () (Li et al. Citation2004). This method builds an image network containing all panoramas and traversing images along the traverse to achieve a high-accuracy solution of rover positions along the entire traverse.
Figure 8. Illustration of a rover traverse and the network with Pancam and Navcam images for bundle adjustment.
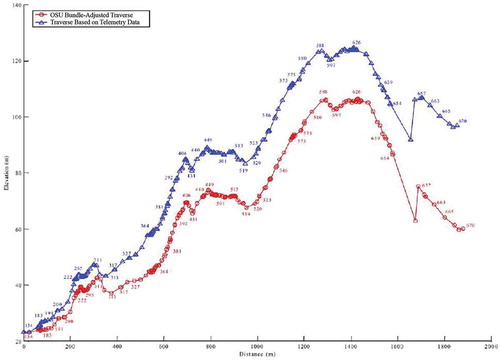
In addition to the rover traverse map, a vertical profile was generated and expanded as the rover travelled. shows a local vertical profile of the Spirit traverse from Sol 154 to Sol 670. The horizontal axis of the figure is the distance travelled and the vertical axis depicts elevation. Note that the scales in the horizontal and vertical axes are different. Again, the blue line illustrates the profile computed from telemetry, while the red line shows the BA result. The accumulated elevation difference is 36.6 m over a travelled distance of 1.85 km, which may be mainly attributable to wheel slippage and IMU drift.
Figure 9. Vertical profile of the Spirit rover traverse (Sol 154 to Sol 670).
4.2. Techniques employed for MSL localization
4.2.1. Primary modes of navigation during curiosity’s traverse
A very significant part of Curiosity’s mission is its ability to traverse long distances. Similar to Spirit and Opportunity, Curiosity offers three primary modes of navigation when she traverses Mars (Grotzinger et al. Citation2012).
The first one is the blind drive. Based on high-quality images from the engineering rover cameras and orbiting sensors, the rover traverse planner can determine a safe path, free of obstacles or hazards, and command the rover to traverse a certain distance along that path. The length is usually limited by the visibility of distant terrain and the rover’s ability to resolve hazards. In this mode, wheel odometry is used to measure the distance travelled by the rover (Grotzinger et al. Citation2012).
The second mode is auto-drive that selects a path on its own by using hazard avoidance. This requires the rover to frequently stop and acquire images with the Hazcams. The rover then analyses these images for potential hazards and selects a safe path. The on-board algorithm is designed to detect path safety and determine how much the path corresponds to the desired direction of traverse (Grotzinger et al. Citation2012). Visual odometry may be used to provide a more accurate measurement of distances.
The final drive mode combines both of the above modes. The visual odometry analysis may be performed on the order of every half-vehicle length when it is desired to perform a highly precise approach to a target and when the rover is traversing terrain where slippage is a significant concern (Grotzinger et al. Citation2012).
These modes are significantly different in the amount of time needed to accomplish the processing tasks. From a speed perspective, the blind-drive mode is fastest, followed by hazard avoidance with slip check, and then hazard avoidance with visual odometry. For comparison purposes, typical rates on a flat sandy surface are ~140 m/h for blind drive, ~45 m/h for hazard avoidance or ~20 m/h for hazard avoidance with visual odometry (Grotzinger et al. Citation2012).
In addition to MSL rover navigation on the surface of Mars, the rover’s attitude control system is responsible for maintaining an on-board estimate of the rover’s orientation, which is used by ground analysts for interpreting both the science and engineering data. The rover’s IMU is used to provide absolute tilt estimates relative to gravity as well as to propagate attitude during driving using gyros. Overall rover attitude parameters are determined from the position of the Sun using Navcam data, similar to the process used in MER (Grotzinger et al. Citation2012).
4.2.2. Localization for curiosity
4.2.2.1. Concurrent HiRISE imagery for MSL localization
The HiRISE images with 0.3 m ground resolution offer the highest resolution orbital imagery on Mars (Li et al. Citation2011b). They provide an unprecedented capability to visualize a landing site from an overhead view. Curiosity along with the tracks left by the wheels can create an area of over 10 pixels on a HiRISE image and can be effectively identified.
A sequence of HiRISE images taken when the Mars Reconnaissance Orbiter (MRO) flies over the landing site region can be used to identify rover tracks and determine the rover locations at the times of HiRISE imaging. This process may be supported by 3D stereo anaglyphs with a pair of cross track HiRISE stereo images and locations computed by the photogrammetric processing of the HiRISE images. In the first image shows the Curiosity rover at her initial landing position. The other images show the impact sites from the descent stage: the backshell and parachute and the heat shield. However, MRO on which the HiRISE camera is mounted is on a sun-synchronous orbit (Graf et al. Citation2005), and it will take some time before the orbiter can revisit the Curiosity traversing region. This method will not provide a continuous rover traverse, but can serve as a technique to confirm or correct rover positions in an infrequent interval (Li et al. Citation2011a).
4.2.2.2. Comparison of rover images with HiRISE images
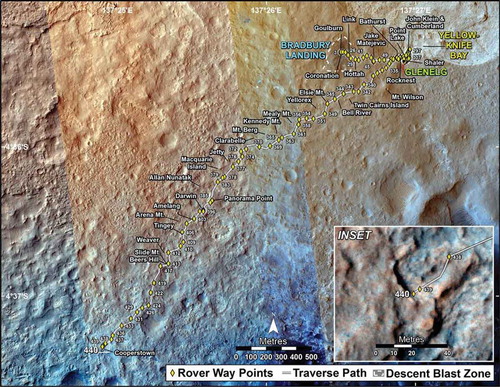
HiRISE images have been collected at the MSL landing site and employed to generate DTMs and orthoimages that can be used a base map for plotting the rover traverse. After each drive Navcam images are orthographically projected to build a Navcam orthoimage parorama (or a partial panorama). The landmarks appearing in both the Navcam and HiRISE orthoimages are compared and matched. The rover position is determined on the HiRISE orthoimage. The accuracy of the rover positions therefore will be influenced by a number of factors such as, but not limited to, the quality of the orbital parameters and instrument pointing information, camera calibration error, spacecraft time error and matching error between the orbital and rover images. Since MOLA data are used to correct the scale factor, rover positions computed in this way have a consistent scale factor and a relatively even rover position accuracy (Li et al. Citation2011a). This rover localization method has been successfully employed to support MSL science planning and rover operations (Parker et al. Citation2012, Citation2013). illustrates the Curiosity traverse up until Sol 440.
Figure 10. Curiosity traverse map (through Sol 440) (http:// mars.jpl.nasa.gov/msl/mission/timeline).
4.2.2.3. Potential bundle adjustment for curiosity localization
Bundle adjustment (BA) has the advantage over the above methods that rover positions can be estimated wherever Navcam or Mastcam images are collected and integrated into an image network. That way detailed traverse points that may not be comparable to features in the orbital images can be localized at a high accuracy. Furthermore, improved rover positions and image orientation information can be estimated by BA. Integration of orbital images in BA is also possible (Li et al. Citation2008, Citation2011a, Citation2011b). To implement this method for Curiosity localization, the current Navcam and Mastcam images should be examined to determine how to build the image network for BA. In the future operations additional rover localization images appropriate for BA should be collected. Some of these images may be collected with combined objectives with other science investigations.
5. Conclusions
This paper discusses different methods for prelanding mapping, initial lander/rover localization and continued traverse mapping. Review of lander localization of Spirit and Opportunity through matching of geological landmarks appearing in orbital MOC images and rover images was given. The MSL mission enjoyed the advanced HiRISE imaging capability through additional HiRISE images where the Curiosity rover along with the parachute and heat field was pictured. Rover localization along the Spirit and Opportunity traverses has been performed by all three methods: direct imaging by HiRISE, landmark comparison between orthoimages of the rover images and HiRISE images, and bundle adjustment. Currently, Curiosity localization has been successfully conducted using the first two methods. Potential of the bundle-adjusted Curiosity traverse is yet to be tested. In general, Curiosity is equipped with identical or even more advanced scientific and engineering cameras compared with the twin rovers in the MER mission; furthermore, HiRISE images offer a direct way of identifying the rover location on high-resolution satellite images, and thus, higher accuracy in the localization and navigation during Curiosity’s traverse is expected.
Acknowledgements
Many thanks to Dr Tan Lu and Dr Hui Lin for reviewing my paper, your comments are greatly appreciated. This paper is a part of the Master thesis of the author.
References
- Bell, J. F. III, S. W. Squyres, K. E. Herkenhoff, J. N. Maki, H. M. Arneson, D. Brown, S. A. Collins, et al. 2003. “Mars Exploration Rover Athena Panoramic Camera (Pancam) Investigation.” Journal of Geophysical Research 108 (E12): 8063. doi:10.1029/2003JE002070.
- Biesiadecki, J. J., and M. W. Maimone. 2006. “The Mars Exploration Rover Surface Mobility Flight Software: Driving Ambition.” Aerospace Conference, Big Sky, MT, March 4–11. IEEE. doi:10.1109/AERO.2006.1655723.
- Bogue, R. 2012. “Mars Curiosity: Sensors on the Red Planet.” Sensor Review 32 (3): 187–193. doi:10.1108/02602281211233151.
- Burkhart, P. D., and J. Casoliva. 2012. “MSL DSENDS EDL Analysis and Operations.” 23rd International Symposium on Space Flight Dynamics (ISSFD), Pasadena, CA, October 29–November 2. California Institute of Technology. http://hdl.handle.net/2014/43274
- Di, K., F. Xu, J. Wang, S. Agarwal, E. Brodyagina, R. Li, and L. Matthies. 2008. “Photogrammetric Processing of Rover Imagery of the 2003 Mars Exploration Rover Mission.” ISPRS Journal of Photogrammetry & Remote Sensing 63: 181–201.
- Golombek, M., and T. J. Parker. 2004. Lander Localization, MER Project Memorandum. Pasadena, CA: Jet Propulsion Laboratory, National Aeronautics and Space Administration.
- Graf, J. E., R. W. Zurek, H. J. Eisen, B. Jai, M. D. Johnston, and R. DePaula. 2005. “The Mars Reconnaissance Orbiter Mission.” Acta Astronautica 57: 566–578. doi:10.1016/j.actaastro.2005.03.043.
- Grant, J. A., M. P. Golombek, J. P. Grotzinger, S. A. Wilson, M. M. Watkins, A. R. Vasavada, J. L. Griffes, and T. J. Parker. 2011. “The Science Process for Selecting the Landing Site for the 2011 Mars Science Laboratory.” Planetary and Space Science 59 (11–12): 1114–1127. doi:10.1016/j.pss.2010.06.016.
- Grotzinger, J. P., J. Crisp, A. R. Vasavada, R. C. Anderson, C. J. Baker, R. Barry, D. F. Blake, et al. 2012. “Mars Science Laboratory Mission and Science Investigation.” Space Science Reviews 170 (1–4): 5–56. doi:10.1007/s11214-012-9892-2.
- Guinn, J. R., and T. A. Ely. 2004. “Preliminary Results of Mars Exploration Rover In-Situ Radio Navigation.” In Presented at the 14th Space Flight Mechanics Meeting, AAS/AIAA (pp. AAS 04–270), Maui, HI, February 8. Pasadena, CA: Jet Propulsion Laboratory, National Aeronautics and Space Administration.
- Herkenhoff, K. E., S. W. Squyres, R. Arvidson, D. S. Bass, J. F. Bell III, P. Bertelsen, B. L. Ehlmann, et al. 2004. “Evidence from Opportunity’s Microscopic Imager for Water on Meridiani Planum.” Science 306 (5702): 1727–1730. doi:10.1126/science.1105286.
- Kim, J. R., and J.-P. Muller. 2009. “Multi-resolution Topographic Data Extraction from Martian Stereo Imagery.” Planetary and Space Science 57: 2095–2112. doi:10.1016/j.pss.2009.09.024.
- Kirk, R. L., E. Howington-Kraus, M. R. Rosiek, J. A. Anderson, B. A. Archinal, K. J. Becker, D. A. Cook. et al. 2008. “Ultrahigh Resolution Topographic Mapping of Mars with MRO HiRISE Stereo Images: Meter-scale Slopes of Candidate Phoenix Landing Sites.” Journal of Geophysical Research 113 (E3): E00A24. doi:10.1029/2007JE003000.
- Leshin, L. A., P. R. Mahaffy, C. R. Webster, M. Cabane, P. Coll, P. G. Conrad, P. D. Archer Jr., et al. 2013. “Volatile, Isotope, and Organic Analysis of Martian Fines with the Mars Curiosity Rover.” Science 341 (6153). doi:10.1126/science.1238937.
- Li, R., B. A. Archinal, R. E. Arvidson, J. Bell, P. Christensen, L. Crumpler, D. J. Des Marais, et al. 2006. “Spirit Rover Localization and Topographic Mapping at the Landing Site of Gusev Crater, Mars.” Journal of Geophysical Research 111 (E2): E02S06. doi:10.1029/2005JE002483.
- Li, R., R. E. Arvidson, K. Di, M. Golombek, J. Guinn, A. Johnson, M. Maimone, et al. 2007. “Opportunity Rover Localization and Topographic Mapping at the Landing Site of Meridiani Planum, Mars.” Journal of Geophysical Research 112: E02S90.
- Li, R., K. Di, L. H. Matthies, R. E. Arvidson, W. M. Folkner, and B. A. Archinal. 2004. “Rover Localization and Landing-Site Mapping Technology for the 2003 Mars Exploration Rover Mission.” Photogrammetric Engineering and Remote Sensing 70 (1): 77–90. doi:10.14358/PERS.70.1.77.
- Li, R., S. He, Y. Chen, M. Tang, P. Tang, K. Di, L. Matthies, et al. 2011a. “MER Spirit Rover Localization: Comparison of Ground Image- and Orbital Image-Based Methods and Science Applications.” Journal of Geophysical Research 116: E00F16.
- Li, R., J. Hwangbo, Y. Chen, and K. Di. 2011b. “Rigorous Photogrammetric Processing of HiRISE Stereo Imagery for Mars Topographic Mapping.” IEEE Transactions on Geoscience and Remote Sensing 49 (7): 2558–2572. doi:10.1109/TGRS.2011.2107522.
- Li, R., S. W. Squyres, R. E. Arvidson, B. A. Archinal, J. Bell, Y. Cheng, L. Crumpler, et al. 2005. “Initial Results of Rover Localization and Topographic Mapping for the 2003 Mars Exploration Rover Mission.” Photogrammetric Engineering and Remote Sensing 71 (10): 1129–1142. doi:10.14358/PERS.71.10.1129.
- Li, R., B. Wu, K. Di, A. Angelova, R. E. Arvidson, I.-C. Lee, M. Maimone, et al. 2008. “Characterization of Traverse Slippage Experienced by Spirit Rover on Husband Hill at Gusev Crater.” Journal of Geophysical Research 113: E12S35.
- Maki, J. N., J. F. Bell III, K. E. Herkenhoff, S. W. Squyres, A. Kiely, M. Klimesh, M. Schwochert, et al. 2003. “Mars Exploration Rover Engineering Cameras.” Journal of Geophysical Research 108 (E12): 8071. doi:10.1029/2003JE002077.
- Martin-Mur, T. J., G. L. Kruizinga, D. P. Burkhart, M. C. Wong, and F. Abilleira. 2012. “Mars Science Laboratory Navigation Results.” In Presented at 23rd International Symposium on Space Flight Dynamics, Pasadena, CA, October 29–November 2. JPL Technical Report. Pasadena, CA: Jet Propulsion Laboratory, National Aeronautics and Space Administration.
- NASA History Program Office. 2012, March 23. “Chronology of Mars Exploration.” National Aeronautics and Space Administration. Accessed April 25, 2012. http://history.nasa.gov/marschro.htm
- NASA JPL. 2012. “MSL Science Corner: Mast Camera (Mastcam).” In MSL Science Corner, edited by A. R. Vasavada and M. Davis. Accessed October 2012. http://msl-scicorner.jpl.nasa.gov/Instruments/Mastcam/
- Parker, T. J., F. J. Calef, M. P. Golombek, and T. M. Hare. 2012. “High-Resolution Basemaps for Localization, Mission Planning, and Geologic Mapping at Meridiani Planum and Gale Crater.” Abstract no. 2535, 43th LPI Lunar and Planetary Science Conference, The Woodlands, TX, March 19–23.
- Parker, T. J., M. C. Malin, F. J. Calef, R. G. Deen, H. E. Gengl, M. P. Golombek, J. R. Hall, O. Pariser, M. Powell, R. S. Sletten, and the MSL Science Team. 2013. “Localization and ‘Contextualization’ of Curiosity in Gale Crater, and Other Landed Mars Missions.” Abstract and poster presented at the 44th LPI Lunar and Planetary Science Conference, The Woodlands, TX, March 18–22.
- Parker, T. J., M. C. Malin, M. Golombek, T. Duxbury, A. Johnson, J. Guinn, J. McElrath, et al. 2004. “Localization, Localization, Localization.” Abstract No. 2189. 35th LPI Lunar and Planetary Science Conference, The Woodlands, TX, March 15–19.
- Shan, J., J.-S. Yoon, D. S. Lee, R. L. Kirk, G. A. Neumann, and C. H. Acton. 2005. “Photogrammetric Analysis of the Mars Global Surveyor Mapping Data.” Photogrammetric Engineering and Remote Sensing 71 (1): 97–108. doi:10.14358/PERS.71.1.97.
- Squyres, S. W., R. E. Arvidson, E. T. Baumgartner, J. F. Bell III, P. R. Christensen, S. Gorevan, K. E. Herkenhoff, et al. 2003. “Athena Mars Rover Science Investigation.” Journal of Geophysical Research 108 (E12): 8062. doi:10.1029/2003JE002121.
- Squyres, S. W., R. E. Arvidson, J. F. Bell III, F. Calef III, B. C. Clark, B. A. Cohen, L. A. Crumpler, et al. 2012. “Ancient Impact and Aqueous Processes at Endeavour Crater, Mars.” Science 336 (6081): 570–576. doi:10.1126/science.1220476.
- Thomson, B. J., N. T. Bridges, R. Milliken, A. Baldridge, S. J. Hook, J. K. Crowley, G. M. Marion, C. R. De Souza Filho, A. J. Brown, and C. M. Weitz. 2011. “Constraints on the Origin and Evolution of the Layered Mound in Gale Crater, Mars using Mars Reconnaissance Orbiter Data.” Icarus 214 (2): 413–432. doi:10.1016/j.icarus.2011.05.002.