
Abstract
The built environment (BE) has emerged as one of the ‘first causes’ of chronic disease, capable of explaining its socio-spatial variation. There is an increasing need for objective, detailed and precise measurements of attributes of BE that may influence our lifestyle, behaviour and hence physical and mental health.
In this paper, we report the UK Biobank Urban Morphometric Platform (UKBUMP), the first ever very large sample size high resolution spatial database of urban morphological metrics (morphometrics), being developed for half-a-million participants of the UK Biobank Prospective study spatially distributed across 22 UK cities. Large-scale objective assessment of the BE was conducted employing state-of-the-art spatial and network analyses upon multiple national-level spatial data-sets.
Prospective large-scale objective assessment of the BE enables the development of BE-health modelling studies that have the potential to identify causal pathways from specific attributes of the BE to various complex chronic health outcomes as well as well-being. The UKBUMP will act as a national resource, providing a platform for evidence-based healthy city planning and interventions for the first half of the twenty-first century.
1. The impending challenge
Health is a result of a complex interplay between contextual socio-economic, built and natural environmental as well as individual- and population-level factors; and this complexity is tricky to unravel (Marmot Citation2010; Rydin Citation2012; Rydin et al. Citation2012; Sarkar, Webster, and Gallacher Citation2014). With increasing urbanization scale and density, the built environment (BE) has emerged as one of the ‘first causes’ of chronic diseases, capable of explaining their socio-spatial variations.
Although, there has been a growing body of international evidence linking BE to health and well-being, there has been increasing consensus that most BE–health studies are plagued by significant conceptual and methodological challenges. Most studies and reports lack sufficient robustness and reliability to address causality (Diez Roux Citation2004a, Citation2004b). A majority of studies are small in size and hence unable to decipher disease aetiology or garner sufficient social support and political will towards generalizing specific findings to larger population and regions (Gallacher Citation2007). This constrains translation into convincing urban planning and public health policies. Being cross-sectional in design, most studies conducted thus far fail to capture time-related effects. Lack of prospective longitudinal data on health outcomes and attributes of BE means that the impacts of sustained exposures over time (Ben-Shlomo and Kuh Citation2002) to specific configurations of the BE as well as the effects of urban regeneration and retrofitting cannot be evaluated with any degree of precision. Many studies, especially from urban planning researchers, have more of a qualitative flavour, and many well-designed quantitative studies lack sufficiently sophisticated objective measures of BE attributes. Study design and subjective measurements hinder the transfer of knowledge into practice. Another bottleneck in BE-health studies arises from the lack of standard definition of the ‘functional neighbourhood’ (i.e. the precise area around an individual’s home or workplace considered appropriate for measuring BE attributes that might impact individual health). Studies have employed many kinds of census-defined boundaries as a proxy frame for neighbourhood BE effects and suffer from arbitrariness in the selection of the areal unit of analysis. This aggravates the modifiable areal unit problem (Kwan Citation2012a, Citation2009; Clark and Scott Citation2014) besetting these studies. Census-based aggregates are not related to behavioural patterns and cannot accurately capture the health-defining socio-economic, political, cultural, environmental and institutional processes active within them. Aggregate-level analyses are often misleading in guiding specific policy on account of ecological fallacy and on account of the detail that they obscure (Diez-Roux Citation1998; Pearce Citation2000; Robinson Citation2011). From a public health planning perspective, many BE-health models fail to statistically adjust for potentially confounding compositional socio-demographic, lifestyle and morbidity variables and consequently lack reliability in predicting strength and significance of associations. In the light of insufficient and sometimes conflicting evidence, it becomes almost impossible to formulate specific urban planning and management policies to guide targeted health interventions.
With these weaknesses of previous studies in mind, we embarked on a large-scale research project that emphasises (a) individual not aggregate health data; (b) objective not subjective BE metrics; (c) large N studies; (d) network distance measurements and (e) longitudinal panel data.
In this paper, we report the development of a seminal UK-wide baseline spatial database that will function as a platform for evidence-based healthy city planning and interventions for the first half of the twenty-first century. The platform will facilitate the construction of suite of models that will explicitly decipher the health impacts from the genetic to micro BE scales for half-a-million Britons.
2. The transformative idea and its operationalization
2.1. Conceptual framework and hypothesis
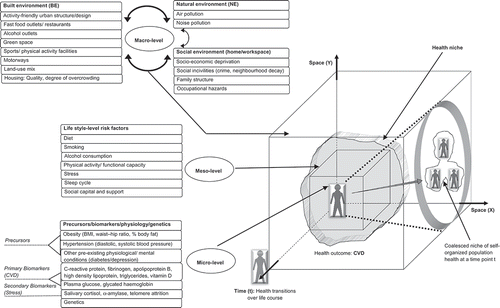
We introduce the urban health niche paradigm, as a holistic and multidisciplinary approach to studying healthy city dynamics. We conceptualize the urban system as a supra-organism with its component spatial road networks as the vascular system channelling the positive and negative externalities of urban agglomeration to individuals. The benefits and costs of co-habitation in a city are transmitted in economic, social, environmental and health domains and we view these as flowing through the principal channel of urban communication: the road network. An individual in the urban system and the production of his/her health at a given moment of time is conceptualized by a ubiquitous urban health niche – a hypothetical hypervolume encompassing the epidemiologic triad of person, place and time. The urban health niche is, in essence, a spatio-temporal manifestation of the causal agents and processes functioning at the micro-, meso- and macro-level urban scales at which the health defining processes function. Details of our model are elaborated elsewhere (Sarkar, Webster, and Gallacher Citation2014). As an example, illustrates the potential pathways through which gene-environment may interact to produce a functional niche for cardiovascular diseases in a city. This conceptual model forms the descriptive and prescriptive basis for guiding multidisciplinary empirical research by specifying a data model across multiple and multilevel health-defining factors active throughout the human life course. Together, the conceptual and empirical data models provide a basis for multilevel urban planning and health policies and intervention strategies. Such a bottom-up planning model (in the sense of being guided by individual effects and outcomes) allows us to analyse the multiple-level spatio-temporal health determinants that exist at the different levels of a city’s functional and organizational hierarchies. This, we suggest, should allow for a much greater accuracy of evidence-based policy-making and detailed urban plan making than has hitherto been possible. It also makes it possible to devise health-promoting intervention strategies at both individual and population levels, with appropriate levels of confidence placed on the anticipated results.
Figure 1. Gene, environment and the corresponding urban health niche for cardiovascular disease.
With this conceptual model and associated suite of empirical models, we wish to examine whether, and to what degree, spatial configurational attributes at the levels of household, surrounding neighbourhood, city and overall region, have an impact upon an individual’s lifestyle, behaviour and health. The association between the structure of configured urban space (layout of roads, open/green spaces, location of health promoting/inhibiting facilities and so on) and individual behaviour is becoming better understood, but there have been too few studies of a size capable of delivering reliable generalisations (Sarkar, Webster, and Gallacher Citation2014). We hypothesize that the configuration and design of urban space around the dwelling locations of half-a-million UK Biobank (UKB) cohort members affects the quality of physical, social, economic and BEs and configure the neighbourhood physical and social activity space in a way that affects measurable health outcomes. Urban configuration includes land-use density, distribution and mix; accessibility to health promoting/inhibiting resources; community severance; congestion and pollution; employment density and mix; social capital and so on. The quality and extent of local environmental exposures influences individual physical activity behaviour, lifestyle and social interactions, general well-being and consequently, specific health outcomes including weight outcomes, stress levels, cardio-metabolic and mental health risks. With such a large study and wide range of objectively measured data about both an individual’s health and the configuration of the BE around an individual’s home, we can unpack these complex relationships in a way that has never been done before and put a health ‘impact’ measure on a large number of urban planning variables (such as housing density, street pattern, green space accessibility, land-use mix, and so on).
2.2. Methodology
2.2.1. The pilot project
Based on our health niche methodology and a systematic meta-analysis of literature connecting BE and health, we were able, in a pilot study, to model and operationalize a high resolution and sophisticated geographic information system (GIS) database of health promoting/inhibiting BE morphological metrics (morphometrics) for a small city with unusually good public health data (Sarkar, Webster, and Gallacher Citation2014). State-of-the-art spatial and network analyses were performed upon diverse spatial datasets to investigate fine-scale associations between urban configuration and individual health in Caerphilly, South Wales, using health data from the Caerphilly Prospective Study, one of the longest standing epidemiological prospective cohorts, set up in 1979. Linking individual-level health data to corresponding urban morphometrics measured at multiple spatial scales enabled development of a series of multilevel cross-sectional and longitudinal models to decipher fine-scale associations between BE configuration and individual-level obesity and psychological health outcomes (Sarkar, Gallacher, and Webster Citation2013a, Citation2013b). These studies provided an opportunity to optimize and refine our geocoding, spatial modelling and data linkage operations enabling scaling-up and replication of the project across the entire UK.
2.2.2. Whose BE are we measuring and whose health are we studying? – the UKB
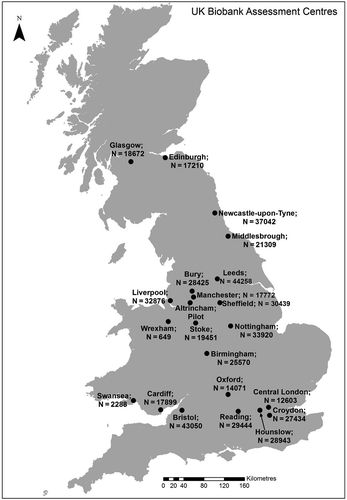
The UKBFootnote1 is the flagship large-scale prospective cohort study of 503,325 participants aged 40–69 years, registered with the National Health Service and residing within 25 miles of one of the 22 assessment centres across major cities of Scotland, England and Wales (see ). The spatial scale of 25 miles encompasses well beyond the urban fringes of major cities of UK so that a fair proportion of UKB cohort participants also reside in rural areas. The participants, recruited over the period 2006–2010, provided extensive baseline data on socio-demographics, lifestyle (including diet and physical activity), medical history, anthropometrics and biological samples (blood, urine and saliva) and hospital-related outcomes. Measurements on biomarkers of cardio-metabolic diseases are currently ongoing and so are the repeat assessments for the second phase (UK Biobank Citation2007; Allen et al. Citation2012). The objective of the UKB is to investigate the genetic, lifestyle and environmental causes of a range of diseases. Our research adds a BE dimension to this path-breaking national study, enabling capacity to investigate health effects of various attributes of BE.
Figure 2. Spatial locations of 22 UKB assessment centres with number of participants.
2.2.3. The UK Biobank Urban Morphometric Platform (UKBUMP) – nationwide health niche database for the UKB
UKBUMP is, therefore, a high resolution spatial database of morphometrics being developed for half-a-million UKB participants across 22 cities of the UKB Prospective cohort. The aim is to generate robust evidence of the links between attributes of BE and health and well-being, thereby functioning as a nationwide resource for evidence-based healthy city planning and public health interventions. Morphometrics generation involved a series of sophisticated spatial and network analyses performed upon diverse UK-wide spatial databases. These included UK Ordnance Survey Mastermap (OSM) and AddressBase Premium databases, UKMap, UK Land Registry, colour infrared imageries, digital terrain models (DTMs), National Public Transport Access Node, among others. The resultant health niche database led to the modelling and compilation of more than 750 health-specific individual-level urban morphometrics linked to each of the half a million subjects in the geocoded UKB health database. Sarkar, Gallacher, and Webster (Citation2014) reports the Welsh part of the study.
The OSM Topography Layer contains information on detailed surface features of the landscape, categorized under nine themes including building footprints, while the AddressBase Premium data provide the most detailed view of an address and its life cycle. It comprises of local authority, Ordnance Survey and Royal Mail addresses, current (approved) addresses, and alternatives for current addresses (reflecting differences in versions of addresses in current use), provisional addresses (proposed planning developments) and historic information for each address, where available, plus objects without postal address and cross references to the OS MasterMap layer’s TOpographic IDentifiers. The licence for the UK-wide AddressBase Premium data procured from UK Ordnance survey comprised approximately 36 million valid address point features with an uncompressed file size of 29 GB. The component layers of the AddressBase Premium data were joined together through the unique field – Unique Property Reference Number (UPRN). Thereafter, the geo-referenced grid coordinates; land-use classifications and full address for each valid address point surveyed were extracted. The same land-use classification scheme as employed by the Ordnance Survey AddressBase Premium has been used in UKBUMP. The polygon-based OSM Topography Layer and AddressBase Premium were connected together through spatial GIS queries to provide us with exact dwelling footprints and point locations. The OSM Integrated Transport Network (ITN) layer provides a topologically structured representation of the road network with respect to geometry of road links, road type (motorway, A road, alleyway, etc.), junctions, grade separation, road names and numbers and information about the nature of road that the link represents (single carriageway, dual carriageway, slip road, etc.). These formed the basis for the development of land-use and street network morphometrics. All land-use addresses within 10-km buffer of a polygon enveloping all geocoded UKB dwelling locations in an assessment centre were extracted from the AddressBase Premium data.
To operationalize our research, dwelling addresses of anonymized UKB respondents were geocoded in British Coordinate System up to an accuracy of ±1.0 m by matching with the Ordnance Survey AddressBase database. The aim is to create an objective assessment of the BE around the immediate neighbourhood of the half million participants of the cohort. This results in the modelling and compilation of corresponding individual-level spatial database of BE and their eventual linkage with the UKB health datasets. Given the existing complexities associated in delineating neighbourhoods for conducting BE-health studies (Kwan Citation2012a, Citation2012b), we created BE measures for neighbourhoods around a UKB subject’s home at five spatial scales: of 500, 1000, 1500, 2000 m and Lower Super Output Areas (LSOAs) of residence for the development of land-use morphometrics. The buffer sizes were selected based on the scientific literature on evidences of effects of various attributes of BE on specific physical and mental health outcomes as well as physical activity behaviour. Network neighbourhoods were created at each scale using vehicle-accessed street catchments delineated around each UKB dwelling address by ArcGIS 10.2 Network Analyst. The LSOAFootnote2 within which a dwelling is situated is has also been used.
Land-use densities of more than 200 health promoting/inhibiting land-use destinations were measured within census-defined LSOAs and within 500, 1000, 1500 and 2000 m street catchments of each UKB respondent’s dwelling. Destination accessibility was operationalized in terms of street network distance to nearest health promoting/inhibiting destinations for more than 35 destination types (clinics, general practitioner (GP) surgeries, parks, etc.). This was done with the origin-destination cost matrix algorithm within ArcGIS 10.2 Network Analyst.
Physical accessibility of street network was modelled through spatial Design Network Analysis (sDNA). sDNA is a sophisticated technique of urban network analysis that has evolved from conventional network analyses and employs street network link as the fundamental unit of computation (Chiaradia, Crispin, and Webster Citation2012; Sarkar, Webster, and Gallacher Citation2014). The OSM ITN was subjected to automated cleaning in sDNA Prepare Tool and subsequent modelling produced a suite of 20 different indices of street network accessibility. These measure centrality, detour, shape and efficiency, link characteristics of urban morphology captured at micro (neighbourhood)-, meso (city)- and macro (regional)-level encompassing 19 different catchment radii (400–50,000 m). These are generated in sDNA for all links in the urban road network covering the entire UKB cohort members and the metrics for a street links containing a UKB respondent’s dwelling were added to the respondent’s BE profile.
Physical environment measures comprised greenness and terrain. Greenness was expressed in terms of 0.5 m × 0.5 m grid resolution Normalized Difference Vegetation Index (NDVI), generated from 0.5 m Blue Sky colour infrared imagery. They were aggregated to 500 m Euclidean buffer of each UKB respondent’s dwelling. Terrain was derived from 5 m resolution Blue Sky DTM through slope analysis in ArGIS 10.2 Spatial Analyst. Slope and its variability (in degrees) were aggregated to 500 and 1000 m Euclidean buffer of each UKB respondent’s dwelling.
A foodscape data layer consisted of accessibility variables to detailed food environments for three UKB centres within Greater London Authority comprising more than 50,000 participants. UKMAP, one of the most detailed and feature-rich databases for London was employed for preparing the detailed GIS layer of food outlets. Densities of 19 different typologies of food outlets were measured within census-defined LSOAs and 500, 1000-m Euclidean and street catchment buffers of each UKB respondent’s dwelling. Analyses of street network distance to nearest were also conducted for each typology of food outlets.
Among the other data layers, the Cities Revealed database formed the source of building class GIS data. Building class were extracted for the area of interest and the building footprints were subsequently linked with the geocoded UKB participants’ residences through a spatial query so that each UKB participant’s dwellings fell within one of the 6 building age categories and 12 building type categories. Area-level deprivation was expressed in terms of composite index of multiple deprivation (IMD) (Welsh, Scottish and English versions) and their domain scores at the LSOA neighbourhood level of each UKB respondent’s dwelling. The composite Welsh Index of Multiple Deprivation (WIMD) score comprises from eight unitless indicators of disadvantage (so-called domain indices) for income, employment, health, education, access to services, community safety, housing and physical environment having domain weights of 23.5%, 23.5%, 14%, 14%, 10%, 5%, 5% and 5%, respectively (Welsh Government Citation2011). The Scottish IMD is composed of the first seven domain indices of WIMD (The Scottish Government Citation2012). The corresponding English version called the Index of Deprivation (Communities and Local Government Citation2011) is also measured across seven distinct domains of income, employment, health deprivation and disability, education skills and training (children and young people and skills sub-domains), barriers to housing and services (geographical barriers and wider barriers sub-domains), living environment (indoor and outdoor sub-domains), and crime. It has two supplementary indices; namely Income Deprivation Affecting Children Index and Income Deprivation Affecting Older People Index. A property price database (only for three UKB assessment centres of Wales) was constructed by geocoding land registry data and linking to UKB addresses.
Given the extensive spatial extent encompassing several thousand square kilometres, spatial modelling of each set of morphometrics involved several weeks of intensive uninterrupted geocomputations for each of the UKB assessment areas. Some of the geoprocessing required development of a series of scripts in Python to enable automation. The complete list of BE morphological metrics in UKBUMP is summarized in .
Table 1. Description of BE morphological metrics of the UK Biobank Urban Morphometric Platform (UKBUMP).
3. Discussion and conclusion
The baseline UKBUMP, a nationwide urban morphometric database for half-a-million Britons of the UKB prospective cohort will provide a national resource that can be accessed by urban planning and public health research communities for evidence-informed interventions. UKBUMP is housed within the centralized UKB data repository, hosted at Oxford University and will be made open-access on completion of the developmental phase of the project (anticipated to be June 2016). As per UKB’s access protocols,Footnote3 data will be available for researchers without any exclusive/preferential access and with extensive safeguards in place to ensure anonymity and confidentiality of participants’ data and samples (UK Biobank Citation2011). The four-step procedure requires the researchers to register, submit a preliminary application, a main application upon approval of the former and subsequently sign a material transfer agreement for an approved research project. We hope that the empirical studies supported by this platform will help achieve a step-change in our understanding of associations and causality in the links between BE, behaviour, health and well-being. Such evidence is needed for more effective cross-professional sharing of knowledge and innovations between the disciplines of urban planning and public health (Webster Citation2014; Sarkar, Gallacher, and Webster Citation2014).
Traditionally, national-level health surveys such as the Centre for Disease Control and Prevention’s Behavioural Risk factor Surveillance SystemFootnote4 (the largest telephonic interview, with more than 400,000 US adults), Canadian Community Health SurveyFootnote5 (a cross sectional survey of 65,000 participants in 110 health regions across Canada) and Dutch National Survey of General Practice (Westert et al. Citation2005) can provide large-scale evidence of socio-spatial distribution of health. However, most BE-health studies based on these survey data tend to be at the aggregated level of census-based neighbourhood units and are cross-sectional in nature. In recent years, large-scale prospective cohort studies have emerged that comprise centralized individual-level data infrastructures and have the potential to model an evidence-base of health impacts of spatio-temporal risk exposures. The European Prospective Investigation into Cancer and NutritionFootnote6 is a classic example with more than half a million participants recruited across 10 European countries and followed for 15 years. Other examples include The Japan Collaborative Cohort Study for Evaluation of Cancer Risk (Ohno, Tamakoshi, and Group Citation2001), a cohort study 110,792 participants from 45 communities of Japan and followed-up for 20 years; China Kadoorie Biobank,Footnote7 a cohort of 510,000 adults from 10 geographically defined regions of China, and the Hong Kong (HK) FAMILY Cohort, a prospective cohort of 46,001 participants in Hong Kong (Leung et al. Citation2015). To our knowledge none of these large-scale epidemiological cohorts presently have dedicated individual-level linked BE data infrastructures (we are currently replicating our UKBUMP methodology with the HK FAMILY Cohort. There have been several classic studies specific on environment-health (although at a much smaller scale) such as Multi-Ethnic Study of AtherosclerosisFootnote8 (medical research study on the characteristics and risk factors of CVD involving N = 6814 men and women from six communities) and the Neighbourhood Quality of Life StudyFootnote9 (National Institute of Health funded study on environmental correlates of physical activity for 2200 participants of King County, WA and Baltimore, MD) in the USA. Other studies include the Belgian Environmental Physical Activity Study in Europe (Van Dyck et al. Citation2010) and the Physical Activity in Localities and Community Environments study in Australia (Owen et al. Citation2007). UKBUMP will be the first BE-health study to model and automate detailed and objective individual-level measures of BE and link them to an existing national-level prospective health cohort. Our vision is to replicate the methodology to other existing large-scale prospective health cohorts and thereby open up avenues for cross-country BE-health studies.
The very large sample size in the UKB cohort is representative of the UK-wide population and will lead to a step-change in rigour via significant increments in explanatory power of the models as well as causal inference (Collins Citation2012; Manolio et al. Citation2012). Prospective health datasets of the UKB cohort further compliments causal inference enabling the measurement of health impacts of sustained exposure to specific stable attributes of the BE over the life course. More specifically, in any prospective epidemiological cohort studies, it is expected that both prevalence rates of a specific chronic disease as well as frequency and distribution of risk exposures are rare per unit time of follow-up. A large sample size and increased time span of follow-up in essence helps achieve optimized accumulation of person-time experience. In other words, a large sample size is synonymous with statistical power with significant increments in robustness and reliability of associations of disease prevalence with risk exposures. Assessment of a large population with different contextual exposures will enable the establishment of generalizable associations of BE risk exposures with behaviour and chronic disease.
Our current efforts will establish the baseline phase. Follow-up, updates and linkage of dynamic BE records over time will help develop a longitudinal BE database linked to subsequent waves of UKB. So the aetiology of a specific disease can be established with confidence via longitudinal modelling.
The large spatial extent of the study area implies significant contextual heterogeneity. This opens up opportunities to construct and test specific causal hypothesis upon sub-samples of the data. One example we plan to work on in the first phase of analysis will be to test the specific health impacts of varied exposures to BE risk factors in rural and urban sub-sets of the UKB participants and at different population densities.
Large-scale automation of objective and precise measures of individual-level BE morphometrics mean that BE metrics can be updated periodically, helping to unravel the black box of causality and identifying pathways through which BE in conjunction with the social and natural environment, acts as a fundamental determinant of individual behaviour, physical and mental health, both directly and indirectly.
With extensive multi-scale health datasets, detailed measures of BE and statistical adjustments for confounders, UKBUMP has the potential to demonstrate the value of big data spatial modelling, automation and data linkage in the domain of health technology. Big data modelling performed upon multiple interlinked national-level spatial datasets is not only cost effective but is also objective and unbiased compared to conventional survey-based measures that are often prone to the evaluator’s/participants’ subjective perceptions of the BE. Measurement of BE at multiple spatial scales (5 neighbourhoods for land-use morphometrics and 19 radii encompassing micro- via meso- to macro-scales for urban network morphometrics) enable the analyst to explore hypotheses about size and scale of functional neighbourhoods within which the various health-defining processes are active. Densities of health promoting/inhibiting services have been measured at street catchments ranging from 500 to 2000 m as well as within the socially homogeneous census-defined LSOAs. This permits hypothesis testing about the sensitivity of models to areal unit definition. Similarly, physical accessibility metrics based on a graph-theoretic model of the road network and measured at multiple catchments ranging from 400–50,000 m, enables us to decipher the effects of differential accessibility at multiple spatial scales ranging from micro- (neighbourhood) to meso- (city) up to macro- (regional) scales. The inclusion of more conventional spatial accessibility metrics also allows the analyst to compare the efficacy of network and straight-line measures in epidemiology models.
Other strengths of UKBUMP as a research platform for health geography and spatial epidemiology include currency, accuracy and resolution of data. The UK Ordnance Survey, the flagship national mapping agency of Britain, enabled easy access to standardized clean UK-wide spatial data for the project at a level of building footprints (as opposed to land parcels). The OSM and AddressBase products are updated every six-week interval. Both Ordnance Survey AddressBase as well as UKMAP ensures geocoding accuracy of up to ±1 m. The use of high resolution colour infrared image (50 cm) for NDVI calculations meant accurate delineation of objective urban greenness. The slope metrics were derived from a 5 m DTM. Standardized automation for generating morphometrics ensured validity and reliability of the metrics developed. Data access to multiple agencies was facilitated by a set of licences procured over the duration of the project, with various legal arrangements put in place for secondary and derivative data use.
Among the challenges faced in this project, the extensive spatial scale of means intensive geoprocessing and computation lasting several weeks at a time to develop specific components of the platform for any single UKB collection centre. As with any interdisciplinary large-scale research project, other challenges included issues of logistics such as procuring licences for sustained use of large-scale spatial data from multiple national-level agencies as well as effective coordination between our partners and collaborators. Sustained funding is another challenge. As of now we have been funded to develop the baseline BE platform for only the first wave of the UKB study. This included an UK Economic and Social Research Council (ESRC) Transformative Research Grant of £250,000 and a UKB Grant of £50,000 towards spatial analyses and individual-level morphometric data development for UKBUMP. Grants for the first wave of studies to use the data came from the ESRC and The University of Hong Kong (UDF and PDF grant).
To enable reliable life-course studies of BE and health, prospective data on health and socio-demographic variables must be complimented with retrospective spatial data on the built and natural environment compiled and integrated at individual and neighbourhood levels. In this regard, we will seek future funding opportunities to enable us to update and develop the UKBUMP platform for subsequent waves of UKB study. The first wave of the UKB study ranged between 2006 and 2010 when baseline data were collected. Spatial data employed in the development of UKBUMP were collected as close as possible to the end of the baseline wave to avoid temporal mismatch.
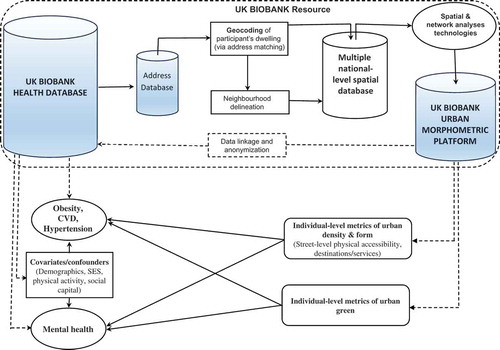
A series of preliminary proof of concept and validation studies, approved by the UKB, are currently ongoing to identify specific associations between attributes of urban design and configuration and specific outcomes of behaviour, health risks, health and well-being after adjusting for a range of individual-level covariates including prevalent disease. provides illustrative flow diagram of specific applications of the UKBUMP database for large-scale BE–health research. Each experiment will support a specific cause–effects hypothesis, thereby explicitly identifying associations and causal pathways from BE to health. These include association between:
Multi-scalar BE morphometrics (physical accessibility to service destinations, green space and street network accessibility) with physical activity, body mass index, mental health and well-being.
BE morphometrics of physical accessibility to service destinations and cardiovascular risks.
Physical access to unhealthy food environments, diet and prevalence of obesity and cardiovascular risks.
Individual and neighbourhood wealth (captured by household income and property price) and cardiovascular risks.
Green space and respiratory health.
Individual mental and physical health and urban settlement policy such as settlement size, density, regeneration and municipal expenditure.
Figure 3. Illustration of potential applications of UKBUMP database in BE–health studies.
Statistical methods in these studies comprise conventional ordinary regression, logistic regression, Cox regression; hierarchical multilevel models exploring variances within space and time (Goldstein Citation2003) as well as spatial models exploring spatial autocorrelations including geographically weighted regression (Brunsdon, Fotheringham, and Charlton Citation1998; Fotheringham, Brunsdon, and Charlton Citation2003) and local indicators of spatial autocorrelation (Anselin Citation1995). As repeat assessment data on health become available over the course of the UKB project, longitudinal BE–health models will be developed to measure the impacts of sustained exposure to specific stable and variable attributes of the BE. These will have the potential to capture the sustained health-effects of urban migration and planning interventions over a person’s life course (including the influences of urban regeneration and retrofitting projects, infrastructure development projects such as the HS2, as well as fluctuations in property price and wealth-influencing economic cycles). Prospective studies of urban migration, neighbourhood-level churn in property prices and individual health outcomes are planned. As data on genetic biomarkers become available for UKBiobank subjects, gene-environment studies such as associations between biomarkers of physiological and psychological stress and neighbourhood contexts, including individual and neighbourhood wealth and access to urban green will tested to causal evidence. The large-scale evidences produced from these studies will be generalizable and hence have significant policy relevance for guiding urban and public health policies as well as devising holistic and efficient preventive intervention mechanisms for health promotion. Large-scale evidence of impacts of urban form and density upon unhealthy activity behaviours will inform public health policy directed at fighting chronic diseases including obesity and cardio-metabolic risks. As an example, the repeated diet recall questionnaire in the UKB when combined with our spatial database of accessibility to food outlets (for London) will inform national-level food policy via city-wide (N ~ 50,000) evidence of differential exposures to healthy/unhealthy food. Clinicians, nutritionists and health economists will have the opportunity to use the data to model potential reductions in mortality from chronic disease associated with unhealthy neighbourhood foodscapes. The data allow identification of the spatial scales at which urban form, density and accessibility influence-specific health outcomes, providing evidence to urban designers. Health economists will be able to use the data to monetize healthy urban configuration and design by modelling reduced health costs accruing over a period of time among people living in activity-friendly communities. UKBUMP thus offers the possibility of fine-tuning existing urban policies with respect to density, mix, master planning and zoning, density and distribution of urban green, active travel. Looking at the associations and causal links the other way around, UKBUMP could be used in Bayesian model to explore the discriminating power of BE configuration in clinicians’ diagnosis and prognosis.
Responding to the urgent need of rebuilding bridges between the disciplines of urban planning and public health and epidemiology, UKBUMP was created by a strong multidisciplinary collaborative partnership, include the core research team (The University of Hong Kong HKUrbanLab, Cardiff University Medical School and School of City and Regional Planning, Oxford University Department of Psychiatry, University of Cambridge Department of Land Economy); the central UKB based in Oxford University; national-level spatial data providers including UK Ordnance Survey and MIMAS; local authorities as well as research collaborators in multiple partner universities such as The University of Cambridge Centre for Diet and Activity Research. The project would not have been feasible without the pooling of expertise in such an intensive interdisciplinary collaboration.
Disclosure statement
No potential conflict of interest was reported by the authors.
Acknowledgements
The research has been conducted using the UK Biobank Resource. The authors wish to thank UK Ordnance Survey for supplying the OS Mastermap and AddressBase Premium datasets, MIMAS (University of Manchester) for providing access to CIR and DTM data-sets and The GeoInformation Group for supplying the UK Map datasets. The authors also thank the Royal Town Planning Institute for bestowing on this project the RTPI Award for Excellence in Spatial Planning Research, 2014.
Additional information
Funding
Notes
2. UK Office of National Statistics defines LSOAs as relatively stable, compact geographical units with reasonable degrees of homogeneity in shape and social composition.
References
- Allen, N., C. Sudlow, P. Downey, T. Peakman, J. Danesh, P. Elliott, J. Gallacher, et al. 2012. “UK Biobank: Current Status and What It Means for Epidemiology.” Health Policy and Technology 1 (3): 123–126. doi:10.1016/j.hlpt.2012.07.003.
- Anselin, L. 1995. “Local Indicators of Spatial Association—Lisa.” Geographical Analysis 27 (2): 93–115. doi:10.1111/j.1538-4632.1995.tb00338.x.
- Ben-Shlomo, Y., and D. Kuh. 2002. “A Life Course Approach to Chronic Disease Epidemiology: Conceptual Models, Empirical Challenges and Interdisciplinary Perspectives.” International Journal of Epidemiology 31 (2): 285–293. doi:10.1093/ije/31.2.285.
- Brunsdon, C., S. Fotheringham, and M. Charlton. 1998. “Geographically Weighted Regression.” Journal of the Royal Statistical Society: Series D (The Statistician) 47 (3): 431–443.
- Chiaradia, A. J., C. Crispin, and C. Webster. 2012. “sDNA: A Software for Spatial Design Network Analysis. Specifications.” Accessed June 15, 2014. http://www.cardiff.ac.uk/sdna/
- Clark, A., and D. Scott. 2014. “Understanding the Impact of the Modifiable Areal Unit Problem on the Relationship between Active Travel and the Built Environment.” Urban Studies 51 (2): 284–299. doi:10.1177/0042098013489742.
- Collins, R. 2012. “What Makes UK Biobank Special?” The Lancet 379 (9822): 1173–1174. doi:10.1016/S0140-6736(12)60404-8.
- Communities and Local Government. 2011. “The English Indices of Deprivation 2010.” Accessed June 26, 2014. https://www.gov.uk/government/uploads/system/uploads/attachment_data/file/6871/1871208.pdf
- Diez Roux, A. V. 2004a. “Estimating Neighborhood Health Effects: The Challenges of Causal Inference in a Complex World.” Social Science and Medicine 58 (10): 1953–1960. doi:10.1016/S0277-9536(03)00414-3.
- Diez Roux, A. V. 2004b. “The Study of Group-Level Factors in Epidemiology: Rethinking Variables, Study Designs, and Analytical Approaches.” Epidemiologic Reviews 26 (1): 104–111. doi:10.1093/epirev/mxh006.
- Diez-Roux, A. V. 1998. “Bringing Context Back into Epidemiology: Variables and Fallacies in Multilevel Analysis.” American Journal of Public Health 88 (2): 216–222. doi:10.2105/AJPH.88.2.216.
- Fotheringham, A. S., C. Brunsdon, and M. Charlton. 2003. Geographically Weighted Regression: The Analysis of Spatially Varying Relationships. Chichester: John Wiley & Sons.
- Gallacher, J. E. J. 2007. “The Case for Large Scale Fungible Cohorts.” The European Journal of Public Health 17 (6): 548–549. doi:10.1093/eurpub/ckm086.
- Goldstein, H. 2003. Multilevel Statistical Models. London: Edward Arnold.
- Kwan, M.-P. 2009. “From Place-Based to People-Based Exposure Measures.” Social Science & Medicine 69 (9): 1311–1313. doi:10.1016/j.socscimed.2009.07.013.
- Kwan, M.-P. 2012a. “How GIS Can Help Address the Uncertain Geographic Context Problem in Social Science Research.” Annals of GIS 18 (4): 245–255. doi:10.1080/19475683.2012.727867.
- Kwan, M.-P. 2012b. “The Uncertain Geographic Context Problem.” Annals of the Association of American Geographers 102 (5): 958–968. doi:10.1080/00045608.2012.687349.
- Leung, G. M., M. Y. Ni, P. T. K. Wong, P. H. Lee, B. H. Y. Chan, S. M. Stewart, C. M. Schooling, et al. 2015. “Cohort Profile: FAMILY Cohort.” International Journal of Epidemiology. doi:10.1093/ije/dyu257.
- Manolio, T. A., B. K. Weis, C. C. Cowie, R. N. Hoover, K. Hudson, B. S. Kramer, C. Berg, et al. 2012. “New Models for Large Prospective Studies: Is There a Better Way?” American Journal of Epidemiology 175 (9): 859–866. doi:10.1093/aje/kwr453.
- Marmot Review. 2010. Fair Society, Healthy Lives: Strategic Review of Health Inequalities in England Post 2010. London: Institute of Health Equity.
- Ohno, Y., and A. Tamakoshi, JACC Study Group. 2001. “Japan Collaborative Cohort Study for Evaluation of Cancer Risk Sponsored by Monbusho (JACC Study).” Journal of Epidemiology 11 (4): 144–150. doi:10.2188/jea.11.144.
- Owen, N., E. Cerin, E. Leslie, L. Dutoit, N. Coffee, L. D. Frank, A. E. Bauman, G. Hugo, B. E. Saelens, and J. F. Sallis. 2007. “Neighborhood Walkability and the Walking Behavior of Australian Adults.” American Journal of Preventive Medicine 33 (5): 387–395. doi:10.1016/j.amepre.2007.07.025.
- Pearce, N. 2000. “The Ecological Fallacy Strikes Back.” Journal of Epidemiology and Community Health 54 (5): 326–327. doi:10.1136/jech.54.5.326.
- Robinson, W. S. 2011. “Ecological Correlations and the Behavior of Individuals (Reprinted from American Sociological Review, 15, 351–357).” International Journal of Epidemiology 40 (4): 1134. doi:10.1093/ije/dyr082.
- Rydin, Y. 2012. “Healthy Cities and Planning.” Town Planning Review (Editorial View) 83 (4): xiii–xviii. doi:10.3828/tpr.2012.24.
- Rydin, Y., A. Bleahu, M. Davies, J. D. Dávila, S. Friel, G. De Grandis, N. Groce, et al. 2012. “Shaping Cities for Health: Complexity and the Planning of Urban Environments in the 21st Century.” The Lancet 379 (9831): 2079–2108. doi:10.1016/S0140-6736(12)60435-8.
- Sarkar, C., J. Gallacher, and C. Webster. 2013a. “Urban Built Environment Configuration and Psychological Distress in Older Men: Results from the Caerphilly Study.” BMC Public Health 13 (1): 695. doi:10.1186/1471-2458-13-695.
- Sarkar, C., J. Gallacher, and C. Webster. 2013b. “Built Environment Configuration and Change in Body Mass Index: The Caerphilly Prospective Study (Caps).” Health and Place 19: 33–44. doi:10.1016/j.healthplace.2012.10.001.
- Sarkar, C., J. Gallacher, and C. Webster. 2014. “Morphometric Analysis of the Built Environment in UK Biobank: Data Analyses and Specification Manual.” Prepared by Cardiff University for UK Biobank, University of Oxford. Accessed May 20, 2014. https://biobank.ctsu.ox.ac.uk/crystal/docs/ard-1195_UKBBuiltEnvWales.pdf
- Sarkar, C., C. Webster, and J. Gallacher. 2014. Healthy Cities: Public Health Through Urban Planning. Cheltenham: Edward Elgar Publishing.
- The Scottish Government. 2012. “Scottish Index of Multiple Deprivation 2012: A National Statistics Publication for Scotland.” Accessed June 30, 2014. http://simd.scotland.gov.uk/publication-2012/
- UK Biobank. 2007. “UK Biobank: Protocol for a Large-Scale Prospective Epidemiological Resource.” Accessed May 12, 2014. http://www.ukbiobank.ac.uk/wp-content/uploads/2011/11/UK-Biobank-Protocol.pdf
- UK Biobank. 2011. “Access Procedures: Application and Review Procedures for Access to the UK Biobank Resource.” Accessed May 30, 2014. http://www.ukbiobank.ac.uk/wp-content/uploads/2012/09/Access-Procedures-2011.pdf
- Van Dyck, D., G. Cardon, J. F. Benedicte Deforche, S. Neville Owen, and Ilse De Bourdeaudhuij. 2010. “Neighborhood SES and Walkability are Related to Physical Activity Behavior in Belgian Adults.” Preventive Medicine 50 (Supplement): S74–S79. doi:10.1016/j.ypmed.2009.07.027.
- Webster, C. 2014. “Built Environment – Health Associations: Establishing the Evidence.” Plenary Lecture Delivered at the 11 International Conference on Urban Health, Manchester, March 5–7.
- Welsh Government. 2011. Welsh Index of Multiple Deprivation 2011: Summary Report (WG-13264). Cardiff: Welsh Government. Accessed June 28, 2014. http://gov.wales/docs/statistics/2011/110831wimd11summaryen.pdf
- Westert, G., F. Schellevis, D. D. De Bakker, P. Gronnewegen, J. Bensing, and J. Van der Zee. 2005. “Monitoring Health Inequalities through General Practice: The Second Dutch National Survey of General Practice.” The European Journal of Public Health 15: 59–65. doi:10.1093/eurpub/cki116.