
ABSTRACT
The large-scale land conversions to urban impervious surfaces, loss of lakes and occupation of floodplains, have resulted in many problems like urban heat island, depletion of the ground water and more importantly flash floods. The impervious surfaces of urbanization led to accelerated run-off and reduced recharge. Currently, around 280 locations are vulnerable to flash floods in the Bangalore city of India. The dumping of solid waste, laying of cables in the channels, under-potential culverts and allotment of the floodplain for housing purposes has developed vulnerability to frequent flooding. Increased urbanization with intensified vertical growth of the city has led to the liquid waste disposal along the storm water drains making the run-off models unpredictable. The breach of lake embankments and overflowing lakes at the initial monsoon rains is the popular phenomenon as the lakes are silted and saturated with sewage. Efforts of revival of some lakes and desilting storm water drains have not improved the overall circumstance. Floods are reported even in short rainfall of 30 mm per hour. Adoption of the dual piping system to carry the wastewater and the rainwater would make restoration more meaningful. Multiple criteria evaluation of spatial layers in GIS environs provides a better assessment of vulnerable flash flood regions. For strategic plans, results from this investigation intuit in building a self-sufficient eco-friendly sustainable smart city that conserves the rainwater and avoid flooding in low-lying regions. The outcomes of the study guide in developing proper structures to the present urban situation, thereby implementing sustainable alternative development.
Introduction
Floods can have a monumental impact on human societies. In 2000, 37% of Asia’s population lived in cities and the proportion is projected to reach more than 50% by 2025. Unfortunately, the majority of megacities in Asia occupy hazard-prone land. In the period 1994 to 2004 alone, Asia accounted for one-third of 1562 flood catastrophes. Urbanization in developing countries doubled from less than 25% in 1970 to more than 50% in 2006(Al-Momani and Shawaqfah Citation2013). Recently, the problem is further escalated by low squatter settlements.
Sudden downpour of rain in the existing catchment area causes flash floods. These kinds of floods tend to remain from 4 hours to 4 days. The height of the flood varies from 4 to 10 feet. Flash floods occur within minutes due to extremely high-intensity rainfall and are distinct from the general floods occurring due to rainfall events of longer duration. Flash floods come in small catchment areas as compared to extensive floods in large river basins. Slow-moving weather patterns (convective rains) cause flash floods that generate intense rainfall over the small area. Important contributing factors include urban topography: the water accumulated in a little area without getting absorbed in the soil. During such an intense event, almost all the precipitation is converted into surface run-off. The excess run-off, if not routed efficiently in time, flooding occurs (Shelton Citation2009; Suprit, Kalla, and Vijith Citation2010). Due to the fast catchment response and very short lead time of flash floods, coordination of hydro-meteorological forecasting and response becomes a challenge, and hence predetermined local information is invaluable. Moreover with the growing urbanization, the impervious surfaces also increase, thereby rendering populations vulnerable to water inundation. The natural streams and man-made drainage fails to cope with the run-offs subsequent to a heavy rainfall event. (Youssef, Pradhan, and Hassan Citation2011; Srivastava et al. Citation2012). Although flood hazards are natural phenomena, damage and loss from floods are mostly the consequences of urbanization without corresponding infrastructural restructuring (Brooks Citation2003; Daniel et al. Citation2012).
Methods of identifying flood-prone areas help in the adoption of conservation and disaster management policies. Complex models require extensive data and parameterization along with individual expertize in this discipline. For this research, however, drainage, gradient, impervious and land transformation data is used for analysing vulnerable areas of flash floods. Mapping of a flash flood index will be advantageous to urban and infrastructure planners, risk managers and disaster response or emergency teams during extreme and intense rainfall events. Flash floods are extremely dangerous due to their unpredictability and rapid discharge over a localized area. The growth of urban impervious surfaces jeopardizes more population being vulnerable to water inundation. One of the methods of identifying the flash flood locations is post incidence study. Natural and man-made flow direction of storm water drains are often misaligned, making the storm water management infrastructure and modelling of run-off difficult (Youssef, Pradhan, and Hassan Citation2011; Miller et al. Citation2012).
Increased urbanization with intensified vertical growth of the city, the liquid waste disposal along the storm water drains made the run-off models unpredictable. Determining catchment characteristics using the previously observed data sets provide insight into water streams through the catchment. In addition, impervious surfaces, vegetation and soil type within the catchment influence rainfall run-off and drainage patterns, and such surfaces can be readily inferred from remote sensing images. The steepness of the slope contributes to the amount and velocity of run-off that may be further affected by man-made structures such as drains and road networks. Urban development may produce changes in hydrological characteristics by the blocking out of natural flow paths potentially constituting excessive run-off in other areas within the catchment. Flood hazards being natural phenomena; damage and loss from floods are mostly the consequences of urbanization without corresponding infrastructural restructuring (Brooks Citation2003; Daniel et al. Citation2012).
A flash flood index generated by integrating spatial and hydrological data and model results will identify potential areas prone to flash floods. Flash flood index combined with population and property location, mitigation and risk management decisions can be focused on overall safety. Papaioannou, Vasiliades and Loukas (Citation2014) estimated potential flood mapping-prone areas of Xerias river basin using multi-criteria evaluation (MCE). The overlay results obtained from the MCE methodology against historical flood events and flood inundation modelling verified the credibility of the method. The MCE could be applied in flood hazard estimation at areas with limited available information, and in areas where preliminary flood hazard evaluation is required for flood mapping purposes using hydrologic and hydraulic modelling. Kubal et al. (Citation2009) applied integrated urban flood risk assessment adapting a multi-criteria approach to determine the urban flood risk of Leipzig, German. Nosrati and Jabbari (Citation2000) in investigations of the parameters effective in flooding concluded that due to faster run-off and high slope and low permeability of surface layer of the earth and less vegetation, the area had great potential of flooding. Arianpour and Jamali (Citation2015) determined flood hazard zonation using spatial multi-criteria evaluation (SMCE) in GIS (case study: Omidieh-Khuzestan). Flood risk assessment is an important component in the planning stage. Assessing flood risk plays a crucial role in helping decision-makers to take appropriate measures that alleviate and reduce the adverse impact of floods. The structural measures are often insufficient to reduce the flood risk to the required level. The non-structural measures play a relevant role in taking precautionary measures in real time demanding early flood forecasting for rescue operations (Al-Momani and Shawaqfah Citation2013; Toth, Montanari, and Brath Citation1999). The objective of this research is to create a vulnerability map using the topographical layers by MCE within the city limits of Bangalore and categorize the flooded locations with vulnerability assessment.
Study area
Bangalore, the fifth largest and fastest growing city in India, has a decadal population growth of 39% (with 8,749,944 population as per 2011 census). The average elevation of Bangalore is 920 m above the mean sea level. The Bangalore geographically located in the southern part of the Deccan plateau lies equidistant from the Arabian Sea and Bay of Bengal. The average annual rainfall is about 931 mm with 60 rainy days (Source: Indian Meteorological Department). It lies in the rain-shadow region. The only source of water for this area is rainfall; highest rainfall occurs during the south-western monsoon during September. Bangalore lacks perennial river in this area. The rulers of Mysore Kingdom and the local people constructed dams along the first- and second-order streams, thereby arresting the rainwater at a higher elevation and utilized this water for domestic and agriculture use (Harini Nagendra Citation2010). These lakes compensated the absence of perennial rivers in the region. By infiltration and reduced run-off, the hydrological cycle was retarded. Due to unplanned urbanization, most of the lakes in the higher altitudes of first- and second-order streams are lost or encroached (Tippaiah Citation2009). The impervious surfaces increased the run-off and drastically reduced the infiltration, thereby accelerating the hydrological cycle. The city enjoys a pleasant climate throughout the year. The summer temperature ranges from 18°C to 38°C. The winter temperature ranges from 12°C to 25°C. The study area, as shown in , consists of a total geographical area of 742 km2 and lies between 77°26ʹ E–77°48ʹ E longitude and 12°49ʹ N–13°10ʹ N latitude, covering in Survey of India toposheets 57G/8,12,16, 57H/5,9,13 on 1:50,000 scale.
Figure 1. Study area Bruhat Bangalore Mahanagara Palike (BBMP).
History of Bangalore urban floods
Inundating in Bangalore is not a new event. History of Bangalore flooding is more than a century old. The first recorded incident of urban flooding occurred specifically a century ago. It was on Saturday 28 September 1912, Bangalore saw hefty rains at central business district near the fort area of Bangalore. Houses in Siddikatte (City Market), Ranasinghpet and Gundopant streets were collectively flooded. The waters entered buildings, leaving people stranded in knee-deep water. The Municipality then apprehended that the entire storm water drains infrastructure of the city is inadequate. The overflowing drains inundated roads and low-lying areas. The floods receded after 6 days on Wednesday 2nd October 1912 after heavy rains lashed Bangalore. The Municipality decided to help people rebuild their houses and even offered sites at high places. Bangalore then, the Pettah area, had a population of one lakh, and it extended over an area of 25 km2. The Cantonment or the Civil and Military Station has spread over a larger area. The incidence of flood focused on the act of filling the moat around the old fort area and transformation of one of the lakes (Siddikatte) for housing purpose. The rains continue to plunge Bangalore into misery centuries later also. The absence of integrated approach in mitigating urban floods by the administrative body of Bruhat Bangalore Mahanagara Palike (BBMP) succeeded in flooding of low-lying floodplain areas in every monsoon. Lakes in Bangalore city have decreased in its spatial extent by 17% from 1960 to 2012 (Ramaprasad and Narayanan Citation2014). Even now, in the name of development and demand for land, lakes are transformed for urban infrastructure and floodplain is occupied, the unforgettable lessons are never accounted. The sources of these first series of incidences mentioned above in this article are from the records, chronicles and books of civic agencies. The transformation of forest and agricultural lands to impervious surfaces has resulted in faster run-off and reduced recharge. The dumping of solid waste, laying of cables in the channels, under-capacity culverts and unplanned land transformation add to the cause. Allotment of the floodplain for housing purposes has posed a threat of frequent flooding (Ramachandra and Pradeep Citation2009). The situation is becoming grim day by day. This paper aims at identifying the vulnerable locations of flash flood-affected areas and thereby identifying sites for restoring the hydrological cycle by spatial applications.
The growing city has several obstacles like the traffic bottleneck, the air and water pollution, of the late, depletion of ground water and wastewater management. The increase of impervious surfaces in contrast to the loss of lakes has led to faster run-off and caused urban floods. Many times the outcry is seen only for solid waste management. There are many problems associated with the liquid waste in its disposal either to lakes or to storm water drains. The absence of recycling system techniques in individual residences led to more liquid waste generation. The untreated water flowing in storm water drains are polluting the lakes and contaminating the ground water. Bangalore witnessed its fastest growth due to software industries along with many escalating problems during its growth. The demand for land and water increased tremendously. Many localities and illegal layouts without the proper road and drainage networks were constructed keeping in view of day’s requirements. The floods in Bangalore are familiar phenomena due to large-scale land-use changes leading to flash floods in low-lying areas.
The Karnataka Housing Board and Bangalore Development Authority failed to provide residential sites by integrating urban development for the fastest growing city. As a result, many private players, land owners, developed their land in piecemeal, sold their properties by making individual layouts, violated the required standards such as width of roads and drains and also encroached the lakebeds marshy areas and storm water drains. The growth of informal settlements in cities across the world is owing to large rural–urban migrations. The migrants are often too poor to afford proper housing in the serviced parts of the city, therefore, settle on risk-prone land (Barry and Ruther Citation2005; Musungu, Motala, and Smit Citation2012).
The migration of agricultural workers to industrial areas and the loss of lakes for cultivation for agriculture made them convert the agricultural lands to residential layouts and industrial estates. The dumping of solid waste and building debris along the lakebeds has silted the canals and lakes tremendously. Deviations to the natural course of streams are done to regularize the layout shapes. The untreated water let into lakes reduced its capacity and also polluted them. On Sunday, 24 October 2005, flooding had worsened due to unauthorized developments along the three lakes. Choked drains led to residential areas being inundated, and traffic was severely affected. Thousands of office-goers stranded in the city’s waterlogged streets. Schools in the city were closed, and several apartment complexes inundated. Water entered few office buildings, including one of the offices of software company WIPRO. The flood left hundreds of persons dispossessed and ailed to various health problems and environmental challenges (Gupta and Nair Citation2011). On Friday, 26 September 2014, the rain whopped 89.6 mm rainfall within 19:20 hours–20:30 hours. Many low-lying areas were flooded, among these the Kino theatre railway underpass completely submerged. Due to the lack of the integrated map of flood-affected areas, the civic administrations were reporting different figures at various times. In a report by Rohit B R in DNAnalysis on Thursday, 17 June 2010, Mayor S K Nataraj addressed as 150 critical areas of flooding in BBMP limits. In a report by Prabhu Mallikarjunan on Friday, 28 June 2013, in The New Indian Express that, The Bruhat Bangalore Mahanagara Palike has identified 1077 areas in Bangalore as ‘flood prone’ and 85% of them have been categorized as ‘critical’ as per BBMP chief engineer (Storm Water Drains) H C Ananthaswamy. However, in reality 5.4 km2 of urban development has taken place in high-risk flood-risk zone. Many more areas will add to it due to urban impervious surfaces and the increased liquid waste disposal along the natural drains with increased vertical growth.
Materials
The Survey of India maps, Bhuvan web portal, open street maps, handheld GPS was utilized to identify these locations and prepare the flood-affected area’s map of BBMP. explains the sources of data used for mapping the MCE. The advantage of modern remote sensing and LiDAR technology is the characterization of the land use. Several spatial layers exist that characterizes vegetation classes and other land use. Such spatial layers can provide an appraisal of roughness liable for flow impediment (Miller et al. Citation2012).
Table 1. Data source.
Software used
Arc Info version 9.3 software with 3D analyst and spatial analyst extensions is used to prepare map of flood-affected areas. Model builder is used to write codes for MCE. MCE of base layers of streams, lakes, slope, impervious surfaces and vegetable garden (low aquifer areas) by applying weighted overlay method to determine the potential vulnerable flood zone. Erdas 9.3 software is used for land-use classification. Paleontological Statistics Software (PAST) software is used to calculate the interquartile rainfall dispersion analysis.
Methodology
MCE is used to analyse a series of land-use layers as shown in with a view to ranking them from the most preferable to the least preferred flood zones using a structured approach. The result of MCE is often a set of weighted overlays of the various alternatives. The weights indicate the preference of the alternatives relative to each other. Weights are applied depending upon its significance on urban floods and to extract the vulnerable zones (Jankowski, Andrienko, and Andrienko Citation2001; Kourgialas and Karatzas Citation2011; Stewart and Scott Citation1995) have used the methods highlighted by Malczewski (Citation1999) when calculating weights in MCE (Kevin Musungu, Motala, and Smit Citation2012; Malczewski Citation1999).
Figure 2. Workflow diagram.
The slope is widely used as a topographic attribute for monitoring land-use classes together with other drainage factors (Lee and Heaney Citation2003; Miller et al. Citation2012) and the same is generated by the Cartosat digital elevation model (DEM). The slope is determined from the DEM (CartoSat) using 3D Analyst. Slope gradients lesser than 0.01 are considered as plain areas and are expected to reduce run-off and increase silts. with the gradient less the 0.01 from the slope map. The function weighted overlay is applied in the influence of 75:25 between slope and streams to obtain the floodplain areas. Single isolated cells having areas of 900 m2 are excluded to get clustered plain areas. The vegetable gardens, marshy lands and grasslands were extracted from the old topographical maps of Survey of India as these were the potential zones of aquifers at ground level having small infiltration and were more vulnerable to flooding. The drainage map was created from the topographical maps and contours were generated from the DEM.
The Euclidean distances are calculated with cell size of 5 m and reclassified into four classes for each subject based on its effect on floods. The existing lakes are classified in reverse order as they had the retention and in filtering capacity. Weighted overlay was performed for the floodplain, urban impervious, vegetable gardens and streams in the ratio of 23:3:4:70, respectively to determine the flood zone. The weighted overlay of lost lakes determines the effect of lake encroachments on the floods; the same being derived from weights of 85:15:10, for lost lakes, encroached and existing lakes, respectively. The function weighted overlay between the effect of lakes and flood zone in the influence of 15:85 is applied to determine the final MCE of flood zones. The flood points were extracted with zonal values to determine the vulnerability assessment.
Urban flash floods
Stream strategies
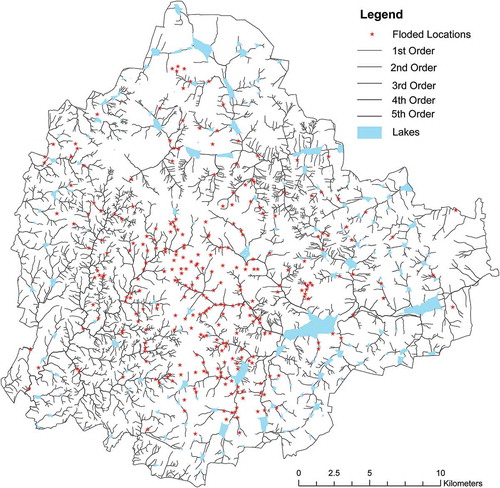
Bangalore is having a well-developed natural drainage system defined in three-valley system namely, the Koramangala–Challaghatta valley, Hebbal valley and Vrishabavathi valley; the Vrishabavathi river later joins with Cauvery river. The Koramangala, Challaghatta and Hebbal valleys later join the Ponnaiyar (South Pennar or Dakshina Pinakini) river.. The above flow data shows that around 90% of the length of streams lies in first and second order as depicted in and . The first- and second-order streams will be dry during non-monsoon season. The catchment area increases towards downhill in geometric progression. In this rolling terrain with diversifying slope at different locations, the silts are deposited in the drainage at the gentle slope areas. The dumping of solid waste and encroachments of drains causes floods in Bangalore’s low-lying areas. The situation becomes intense when the precipitation is heavy and the preparedness is poor.
Table 2. Table showing percentage of different stream orders.
Figure 3. Map showing flood-affected areas with streams.
Slope statistics
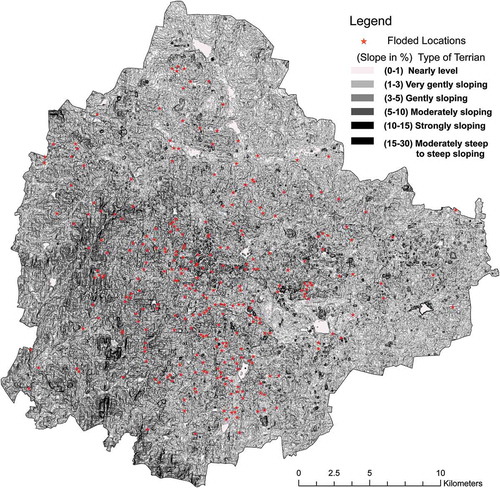
In the canopy of trees and buildings, the DEM values will vary but, in general, the DEM values can be used to find the average slope and to find the floodplains. Slope obtained from LiDAR technology can help to find the accurate floodplain but the covered drainages in urban areas make even the LiDAR technology complicated. Detailed 3D maps generated by total stations with drainage width and depths can give better results in small catchments. The slopes are classified based on NRSA guidelines (Binay and Uday Citation2010).The topography of Bangalore is rolling type with terrain slopes varying from 0 to 16°, as shown in and . The average slope of the region is 1.5°, whereas 13% area lies below 0.5° of slope. Floodplains are obtained by extracting stream-side areas having slope less than 0.5°. The eastern side of Bangalore, that is, Madiwala tank and Bellandur tank (Koramangala–Challaghatta valley) is gentle, whereas towards West along the Vrishabavathi valley is steeper.
Table 3. Table showing distribution of slopes based on IMSD, NRSA 1995 guidelines.
Figure 4. Map showing flood-affected areas with a slope.
Occupation of floodplains
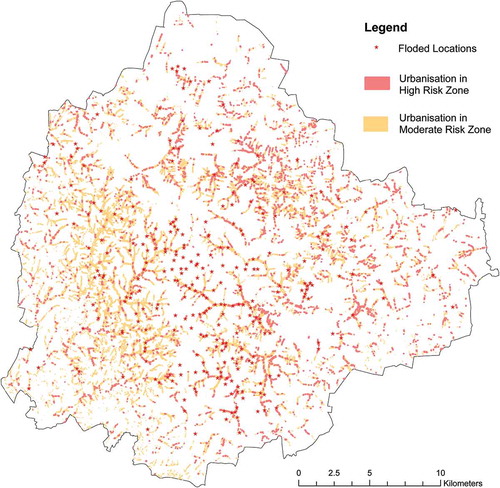
Occupation of high-risk floodplains shows 37 critically flooded locations, and 134 flooded locations lie in moderate-risk floodplains as witnessed in . The unplanned growth of the city along the floodplains is the primary reason for urban flash floods here. The increase of impervious surfaces accelerates the rate of run-off with increasing quantum of water flow, thereby many areas may also add to floodplain in coming days. The use of storm water drains for wastewater discharge and with the vertical growth of the city, the disposal of sewage is also increasing day by day. The overlay analysis of floodplain and the impervious surfaces shows that already 5.4 km2 of urban development has taken place in high-risk flood-risk zone. Moreover, 65.1 km2 of urban development have been done in moderate flood-risk area as presented in .
Figure 5. Map showing flood-affected points with floodplains.
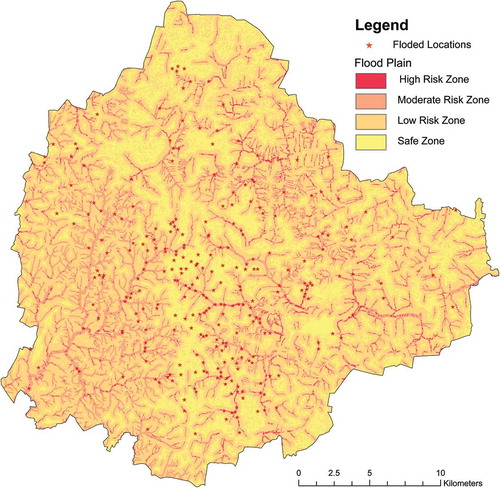
Figure 6. Map showing flood-affected points with urban developments in floodplains.
Impact losses of lakes in the catchment area
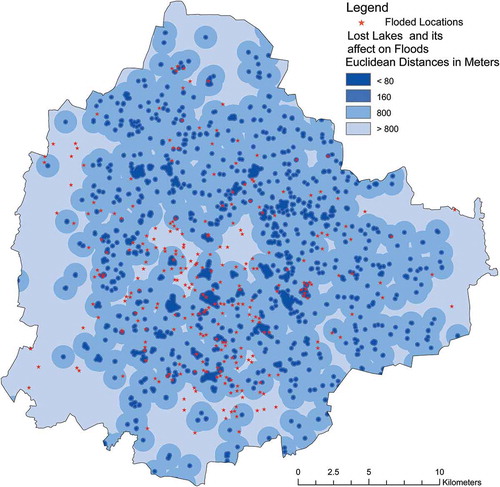
The loss of lakes is highly influencing on 36 flooded locations and moderately influencing on 30 flooded locations as shown in . The lakes, if would not have lost many locations, could have been saved from floods. The lakes behaved as the natural sink tanks for the ground water recharge and also maintained humidity by evaporation. With the rainwater harvesting techniques, 60% of rain can be restored, and this will substantially decrease the flood risk in low-lying areas and also increase the ground water recharge.
Figure 7. Map showing flood-affected points with lost lake database.
The construction of building, roads, pavements and parking lots facilities and infrastructure to inhabit growing projected population has led to higher levels of impervious surfaces. The fraction of impervious cover within the gross watershed area defines the degree of imperviousness (Krebs, Rimpiläinen, & Salminen, Citation2013). The increases of impervious surfaces extracted from the satellite imageries are shown in . The imperviousness is among the most significant land-cover modifications affecting stream condition in urban areas. Land-cover modifications alter the watershed hydrology and affect both, surface and subsurface water bodies. These changes decreased forested stream buffer and wetland areas that provide capacity for retention and purification (Brabec, Schulte, and Richards Citation2002). The impacts included increased stress on stream hydrology, channel morphology and water quality. The stream ecology imposed changes in storm water quality and quantity and changes in the eco-hydrological diversity of watersheds (Booth and Jackson Citation1997). Further impacts include reduced infiltration, higher peak discharge in streams, increased surface run-off, shorter travel period and extreme pollutant loads influencing both the surface water quantity and quality (Lee and Heaney Citation2003). Besides surface waters, imperviousness also affects groundwater bodies. Impacts include problems in water supply and reduced low-flow volumes in streams caused by a reduction of the groundwater recharge rate (Jr CL and Gibbons Citation1996; Haase Citation2009).
Figure 8: Map showing flood-affected points with the impervious surfaces.
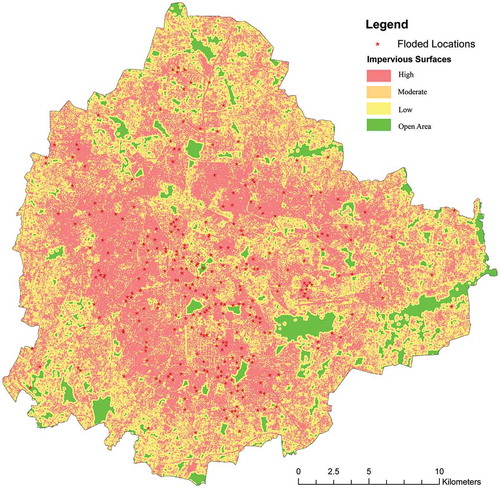
The impacts of land-cover modifications on water bodies can be analysed using the percent of imperviousness. It is a necessary indicator of stream status (Schueler Citation1994) and can be used as an index to address the relation to urban floods. Even threshold values are always controversial that direct run-off doubles at a degree of imperviousness around 20% compared to unsurfaced land. Also, evapotranspiration rates apparently declined, and groundwater recharge slightly reduced at the same level of imperviousness (Krebs, Rimpilainen, & Salminen, Citation2013).
Rainfall analysis
Rainfall is an important element of urban flood modelling of a region especially a city like Bangalore, where a large number of people have occupied floodplains. The amount of rainfall does not show equal distribution in time and space. It varies from dense to scanty in different parts. Urban floods occur in small catchments, and its rapidness is highly unpredictable in urban areas.
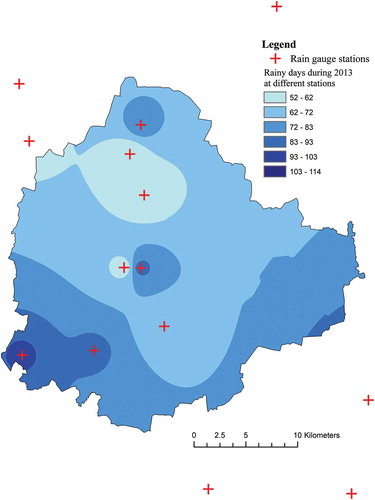
The average annual rainfall of a place does not give sufficient information regarding its capacity to support any decision-making process. The daily rainfall from 1904 to 2013 of Bangalore city collected from District Statistical Office of Bangalore was used for the study as mentioned in . The spatial variability of 2013 rainfall is calculated by inverse distance weighted (IDW) method from ARC info software. The maps show the periodical and spatial variability among the 17 stations plotted.
The box plot and whisker plots for one rain gauge station for 1904–2013 are plotted to know the variability. The box plot in illustrates that the middle clustered long tails zero skewness indicates that the rainfall pattern has not changed over the years. The variability shows two peaks one in May and one in September. The floods during the April–May are due to high-intensity torrential rains, silts in storm water drains and unpreparedness. The negligence in its maintenance enhances the vulnerability. The floods during August and September are due to prolonged high-intensity long-duration precipitation and saturated ground for water penetration and accumulated silts along the storm water drains. and depict the spatial and temporal variations in the rainfall, respectively. With the small catchments response and rapidness, it is hard to depict the urban flood models with barely precipitation models. Urban floods are entirely reliant on the variation in the urban land-use pattern, as there is no discriminated change in rainfall pattern. However, the current urban floods can be linked with the decline of lakes and rise in urban impervious surfaces.
Figure 9. Box plot showing the rainfall dispersion from 1904 to 2013.
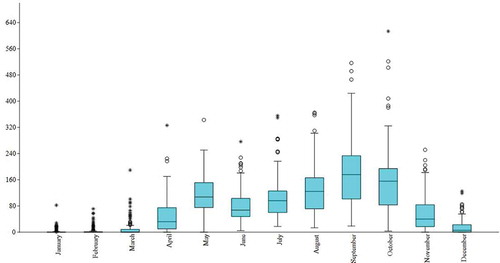
Figure 10. Map showing the spatial variability of rainfall.
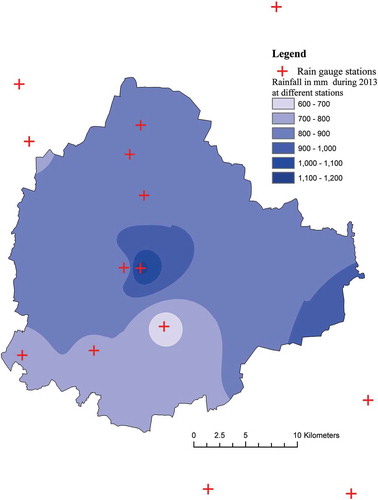
Figure 11. Map showing the variability of rainy days.
Categories of Bangalore urban flood
Flood locations in different zones
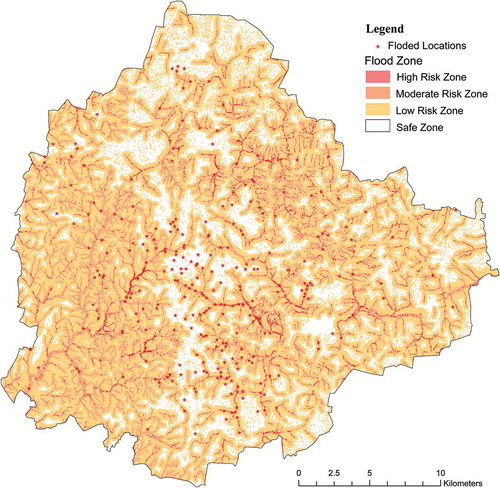
Periodically, from and , it can be analysed and interpreted that flooding at 49 locations in the high-risk zone is because of the occupation of the floodplain and is the natural phenomenon. These areas are to be devoid of further developments. The 136 sites in moderate-risk zones are because of urban land transformations and its effects like impervious surfaces and faster run-off. Flooding at 68 locations at low-risk zone is because of drainage congestion by solid waste dumping or use of storm water drains for wastewater disposal. Flooding at 27 locations at safe zones is because of engineer flaws like under-capacity bridges and culvert and improper maintenance of drains in subways. The loss of lakes and large-scale land transformation in the upper catchment is one of the reasons for floods. The floods are common during torrential rains in the floodplain occupied regions of high aquifer such as the vegetable gardens and marshy lands.
Table 4. Zone-wise flood locations.
Figure 12. Flood zone map.
The research article ‘Urban floods, in the context of India’ analysed the problem and recommended a regular maintenance of drainage system. In the cases of a sudden downpour of rain in short durations, Bangalore drainage will not support even 30 mm rainfall in 1 hour. The problems of urban floods will get aggravated in the future as climate models are projecting an increase in rainfall with the decrease in rainy days (Apte Citation2010; Manasi and Smitha Citation2012). This increase in high-intensity rainfall events results in a further rise in peak discharge in many parts of Bangalore.
The increased impervious surfaces like the buildings, roadways, pavements due to the massive land transformation of agrarian and forest land in cities incapacitated percolation. The sorry state of urban floods is otherwise the drainage obstruction, due to cabling, alignment of underground sewage water system in the storm water drains, dumping of solid waste in drains and encroachment of streams. In the undulating terrain, the slope varies. Consequently, the floodplains face inundation due to the reduced rate of flow. Lake storage capacity is reduced mainly due to silt and encroachments. Increased stream bends are standard due to the diversion of streams in layouts. Unplanned construction of subways with under-capacity storm water drains aggravates the problem. Bridges with narrow width and heights have a significant flaw in design and structure with no option to remove storm water. The structures that are meant to carry storm water carries sewage water, creating criminal waste of natural resource by allowing the storm water to combine with sewage.
Discussion
With the growing population/housing activities, there is a wastewater discharge of 80–85% of water supplied (Krishna Raja Sagara dam, Thippagondanahalli and underground water). This discharge is increasing day by day with the horizontal and vertical growth of the city. The natural streams used to vary in its shape as per the topography. The width and depth of streams depended upon the slope of the area. Due to urbanization, the sidewalls were constructed uniformly without considering the natural gradient rate of flow and amount of wastewater and the rainwater flowing at a particular location along the natural streams. Major reasons of urban floods are construction along the low-lying lands/tank beds and grasslands and absence of a scientific method of controlled discharge of tank water by sluices outlets.
Due to the sudden downpour, the breach of lake bunds caused floods in low-lying areas. Three lakes (Arekere Lake, Amani kere, Gangaiah Chetty lake) in 2013 breached their bunds due to heavy rains and Nagavara, Netravati layout in Krishna Raja Puram and Vysya Bank colony, were flooded. Considering the other factors, it is noticed that the lakes are silted heavily without space for the rainwater and many lakes are fed with sewage water and are filled before the commencement of rainy season. Two people lost their lives by falling in construction pits. Many school children lost their books in school hours due to wetting of their books. Many workers lost their earnings in these rainy days. There was also loss of provisions grocery and household articles due to flooding.
The submergence of subways/underpasses, roads becoming rivers, is a common phenomenon. Flood incidences at higher sloppy ground strongly correlate with under-capacity drainage system and its irregular maintenance. Slow-moving traffic/accidents were due to potholes and open manholes. Tree falls and collapses of buildings and compound walls are frequent in every rainfall. Deaths were due to flooding in the Caluvas and falling into open ditches. The growing Bangalore city is not able to cope with the 30-mm rainfall in 1 hour. Many incidences of floods are reported, in short, heavy rainfalls.
Recommendations
Flyover constructions are preferable over subways for road and rail crossings. Reconstruction of storm water drains based on the regular discharge of sewage anticipating a 20-year growth of Bangalore including a rainfall of 148 mm (that is recorded the highest rainfall in 44 years). Desilting of all the lakes. Construction of sluices at all the existing lakes. Silt arrester constructions at entry and exit levels of all the lakes. Rainwater harvesting in open wells in the open areas of upper catchment areas. Redesigning of storm water drains by the dual piping system to exclusively recharge the ground water. Compensating the design of impervious surfaces by substantial previous wells. Redesigning culverts and bridges subways to accommodate 45 mm rainfall in 1 hour. Avoiding unwanted bends in the storm water drain and in case of unavoidable situations, a wider bend. Contour-based canals construction from flood-affected areas to nearby lakes and open wells. Preparedness of emergency services in the flood-affected areas. GIS mapping the areas vulnerable to flooding. Closures of schools and colleges during the heavy rain days. Suspending repair, construction and digging works in rainy days. Repair of roads before the commencement of monsoon.
Conclusions
Heavy rainfall over a short period and subsequent faster run-off in urban impervious surfaces is the principal factor behind flash floods that often occur over a small catchment area. Modelling the flash floods and its quantitative determination requires finer scales of details in hydrological, meteorological parameters, perhaps such details in micro scale when added to the present model can bring it closer to reality. However, the non-availability of adequate weather stations to measure the micro weather conditions at less spatial frequency has handicapped for quantification studies. The flood vulnerability model generated through morphometric and topographic layers namely slope, vegetation, urban impervious surface, lakes and streams with suitable weights to fit the scenario determined the flood-risk zones. Flood frequency correlation was evaluated by the MCE model. The spatial examination of 280 flood locations from the year 2011–2013 was perfectly in compliance with the model. Moreover, 18% (49 sites) of occurrences lie on highest-risk zone. The high-risk zone has the highest vulnerability (high-current and long-duration floods) and damage incurred will be more. Around 49% (136 sites) lie in the moderate-risk zone. The moderate-risk zone floods vulnerability is high and duration and currents will be comparatively less. About 24% (68 sites) of flood points lie in low-risk zones, and 9% (27 points) of flooded locations lie in safe zones. This model suits for proper understanding and design of remedial measures according to flood zones. The highest-risk zone attributes the anthropogenic occupancy of floodplains. Mitigation and flood management techniques should be at the place to evade devastation. The high-risk zones are due to condensed urbanization without proper drains. The moderate-risk zones are due to dumping of solid waste in drains and alteration to stream morphology. The flood in low-risk zone is due to the faulty construction of medians and under-capacity culverts and drains. This model exemplifies and enables improved understanding of flash flood for local planning in Government departments. It also creates a useful framework that contributes to understanding the stream and channel response to rainfall events. The flood zone mapping can aid in identifying the locations for large-scale rainwater harvesting and also to rusticate further land transformation in floodplains and to reserve these areas for meadows and parks.
Disclosure statement
No potential conflict of interest was reported by the authors.
Related Research Data
References
- Al-Momani, A. H., and M. Shawaqfah. 2013. “Assessment and Management of Flood Risks at the City of Tabuk, Saudi Arabia.” The Holistic Approach to Environment 3 (1): 15–31.
- Apte, N. Y. 2010. Urban Floods in Context of India, 1–14. Vol. 1. New Delhi, India: India Meteorological Department.
- Arianpour, M., and A. A. Jamali. 2015. “Flood Hazard Zonation Using Spatial Multicriteria Evaluation (SMCE) in GIS (Case Study: Omidieh-Khuzestan).” European Online Journal of Natural and Social Sciences 4 (1): 39–49.
- Barry, M., and H. Ruther. 2005. “Data Collection Techniques for Informal Settlement Upgrades in Cape Town, South Africa.” URISA Journal 17 (1): 43–52.
- Binay, K., and K. Uday. 2010. “Integrated Approach Using RS and GIS Techniques for Mapping of Ground Water Prospects in Lower Sanjai Watershed, Jharkhand.” International Journal of Geomatics and Geosciences 1 (3): 587–598.
- Booth, D. B., and C. R. Jackson. 1997. “Urbanization of Aquatic Systems: Degradation Thresholds, Stormwater Detection, and the Limits of Mitigation.” Journal of the American Water Resources Association 33 (5): 1077–1090. doi:10.1111/jawr.1997.33.issue-5.
- Brabec, E., S. Schulte, and P. L. Richards. 2002. “Impervious Surfaces and Water Quality: A Review of Current Literature and Its Implications for Watershed Planning.” Journal of Planning Literature 16 (4): 499–514. doi:10.1177/088541202400903563.
- Brooks, N. 2003. “Vulnerability, Risk and Adaptation: A Conceptual Framework.” Tyndal Center for Climate Change Research working Paper 38, 1–20.
- Daniel, D. I., O. Augustina, A. Anthony, and A. J. Kayode. 2012. “Evaluation of the Relationships between Urban Infrastructure and Flood Disaster in Gombe Metropolis.” Journal of Sustainable Development 5 (7): 12. doi:10.5539/jsd.v5n7p137.
- Gupta, A. K., and S. S. Nair. 2011. “Urban Floods in Bangalore and Chennai: Risk Management Challenges and Lessons for Sustainable Urban Ecology.” Current Science 100 (11): 1638–1645.
- Haase, D. 2009. “Effects of Urbanisation on the Water Balance - A Long-Term Trajectory.” Environmental Impact Assessment Review 29 (4): 211–219. doi:10.1016/j.eiar.2009.01.002.
- Jankowski, P., N. Andrienko, and G. Andrienko. 2001. “Map-Centred Exploratory Approach to Multiple Criteria Spatial Decision Making.” International Journal of Geographical Information Science 15 (2): 101–127. doi:10.1080/13658810010005525.
- Jr CL, A., and C. J. Gibbons. 1996. “Impervious Surface Coverage: The Emergence of a Key Environmental Indicator.” Journal of the American Planning Association 62 (2): 243−258.
- Kourgialas, N. N., and G. P. Karatzas. 2011. “Flood Management and a GIS Modelling Method to Assess Flood-Hazard Areas—A Case Study.” Hydrological Sciences Journal 56 (2): 212–225. doi:10.1080/02626667.2011.555836.
- Krebs, G., U.-M. Rimpilainen, and O. Salminen. 2013. “How Does Imperviousness Develop and Affect Runoff Generation in an Urbanizing Watershed?” Fennia 191 (2): 143–159.
- Kubal, C., D. Haase, V. Meyer, and S. Scheuer. 2009. “Integrated Urban Flood Risk Assessment – Adapting a Multicriteria Approach to a City.” Natural Hazards and Earth System Sciences 9: 1881–1895. doi:10.5194/nhess-9-1881-2009.
- Lee, J. G., and J. P. Heaney. 2003. “Estimation of Urban Imperviousness and Its Impacts on Storm Water Systems.” Journal of Water Resources Planning and Management 129 (5): 419–426. doi:10.1061/(ASCE)0733-9496(2003)129:5(419).
- Malczewski, J. 1999. GIS and Multi-criteria Decision Analysis. New York, NY: John Wiley and Sons.
- Manasi, S., and K. C. Smitha. 2012. “Floods in Bangalore: No Respect for Water Bodies and Water Courses.” In Agony of Floods: Flood Induced Water Conflicts in India, edited by J. K. Eklavya Prasad, J. Suhas Paranjape, and S. Vispute, 183. Pune, India: Forum for Policy Dialogue on Water Conflicts in India.
- Miller, D. P., D. McGarry, H. Fairweather, and S. K. Srivastava. 2012. “Review and framework development for addressing flash flood potential using GIS assisted spatial-hydrologic modelling.” Paper presented at the The Queensland surveying and spatial conference, Brisbane convention and exhibition centre. www.sssi.org.au/qssc
- Musungu, K., S. Motala, and J. Smit. 2012. “Using Multi-criteria Evaluation and GIS for Flood Risk Analysis in Informal Settlements of Cape Town: The Case of Graveyard Pond.” South African Journal of Geomatics 1 (1): 77–91.
- Nagendra, H. 2010. “Maps, lakes and citizens.” Paper presented at the Seminar, New Delhi. http://www.india-seminar.com/2010/613/613_harini_nagendra.htm
- Nosrati, M., and I. Jabbari. 2000. “Zonation flood watershed Qavrud.” Master’s thesis, University of Kermanshah, Qavrud.
- Papaioannou, G., L. Vasiliades, and A. Loukas. 2014. “Multi-Criteria Analysis Framework for Potential Flood Prone Areas Mapping.” Water Resources Management 1: 1–20.
- Ramachandra, T. V., and P. M. Pradeep. 2009. “Urban Floods: Case Study of Bangalore.” Journal of the National Institute of Disaster Management 3 (2): 1–98.
- Ramaprasad, N. N., and P. Narayanan. 2014. “Detection of Decline in the Extent of Lakes in Bangalore City Using Geospatial Techniques.” International Journal of Applied and Natural Sciences 4 (3): 9–20.
- Schueler, T. R. 1994. “The Importance of Imperviousness.” Watershed Protection Techniques 1 (3): 100–111.
- Shelton, M. L. 2009. Hydroclimatology: Perspectives and Applications. Cambridge, UK: University Press.
- Srivastava, S. K., D. P. Miller, D. McGarry, T. Clewett, and G. Duffey. 2012. “Spatial Hydrological Framework to Study Catchments Response to Heavy Rainfall Related Hazards in the Sunshine Coast Region.” Paper presented at the The Queensland Surveying and Spatial Science Conference, Brisbane.
- Stewart, T. J., and L. Scott. 1995. “A Scenario-Based Framework for Multicriteria Decision Analysis in Water Resources Planning.” Water Resources Research 31 (11): 2835–2843. doi:10.1029/95WR01901.
- Suprit, K., A. Kalla, and V. Vijith. 2010. A GRASS-GIS-Based Methodology for Flash Flood Risk Assessment in Goa, 1–74. Dona Paula, Goa: National Institute of Oceanography (CSIR).
- Tippaiah, P. 2009. Vanishing Lakes: A Study of Bangalore City. Bangalore: Institute of Social and Economic Change.
- Toth, E., A. Montanari, and A. Brath. 1999. “Real-Time Flood Forecasting via Combined Use of Conceptual and Stochastic Models.” Physical Chemical Earth 24 (7): 793–798. doi:10.1016/S1464-1909(99)00082-9.
- Youssef, A. M., B. Pradhan, and A. M. Hassan. 2011. “Flash Flood Risk Estimation along the St. Katherine Road, Southern Sinai, Egypt Using GIS Based Morphometry and Satellite Imagery.” Environmental Earth Sciences 62 (3): 611–623. doi:10.1007/s12665-010-0551-1.