
ABSTRACT
This article studies the correlation between ideological opinions and economic development in China at the city and provincial levels, using online survey data with IP information. We assume that more economically developed regions in the southeast are more liberal, as predicted by the modernization theory. We map the ideological opinions reflected by Chinese Political Compass. We find that (1) at the city level, economic development does not necessarily lead to liberal ideology as shown by the spatial autocorrelation; (2) at the provincial level, there is a significant positive correlation between the net export value and liberal ideology. Other development indicators (e.g. income per capita and number of educational institutions) are not statistically relevant.
Introduction
Ideological opinions in our study refer to people’s opinions on contemporary political, economic and sociocultural issues. In this article, we collected 1300 ideological opinions, randomly selected from a pool of about 20,000 online entries in 2007 and 2008, through an online political opinion survey called the ‘Chinese Political Compass’ (CPC). CPC was set up in 2007 and has been collecting entries coming with IP information at the city level in China. We chose online survey rather than onsite survey data such as the Asian Barometer Survey (Chu et al. Citation2008), as the Internet provides new means for expressing political and ideological opinions. It has been the case not only in liberal countries such as the US (Xenos and Moy Citation2007) and Belgium (Kenski and Stroud Citation2006) but also in authoritarian states such as China where these data are prone to be distorted by political pressures (Chen Citation2014; Shen et al. Citation2009; Zhou Citation2009; Zhang and Zhao Citation2006; Sinton Citation2001). Moreover, the IP addresses that came with the responses allowed us to study the spatial patterns of ideological opinions, which will further extend the understanding of the political geography of China. We were generally interested in exploring the relationship between the indexes of objective economic development (as reflected by census statistics), and people’s subjective opinions on economic, social and political affairs. In particular, we found that at the city level, economic development does not necessarily correlate to liberal ideology, while at the provincial level, net export value is positively correlated with liberal ideology.
By so doing, we contributed to the literature of ‘modernization theory’ in political geography. The ‘modernization theory’ generally proposed a positive correlation between economic development and democracy (Lipset Citation1959). Many geographers have critiqued the theory and showed the complicated spatial correlation between democracy and economic development (Shin and Agnew Citation2008; O’Loughlin et al. Citation1998; O’Loughlin Citation1990). Based on these works, we illustrated how this theory should be studied at a local scale, rather than abruptly treating China as a whole. The relationship between democracy and economic development remains a question in China, the world’s second largest economy. Despite its rapid economic growth, the Chinese polity has remained authoritarian, triggering a debate about whether or not China is an exception of the modernization theory (Fukuyama Citation2012; Shi and Lu Citation2010). Instead of addressing the direct causation between democratization and socio-economic development, in this article, we focused on a specific part of the theory– that is, the relationship between Internet users’ opinions towards liberal democracy and economic indexes from National Bureau of Statistics of China.Footnote1
Background
Geographic approaches to the modernization theory
Although the scholarly interest in the relationship between economic base and ideology dates back to Marx and Weber, the current tradition of the modernization theory started with Lerner (Citation1958) and Lipset (Citation1959). The theory generally argues that the level of democracy is positively related to a number of socio-economic requisites, among which income level, education, urbanization and social wealth are the most important. Since the beginning, many scholars have questioned the simplified causation between economic development and democracy, pointing to the importance of institutions and public opinions (O’Donnell Citation2010; Welzel and Inglehart Citation2008; Przeworski and Limongi Citation1997; Lipset Citation1994). As Diamond (Citation1999) argued, in addition to economic development, people’s ‘behavioural and attitudinal embrace of democratic principles’ (p. 20) were also important for surviving democracy in the Third World. Recent research also showed that democracy was in fact understood quite differently in different cultures. For example, based on the international Asian Barometer Surveys between 2001 and 2008, Chu et al. (Citation2008) found that Asian people generally understood democracy different from the Europeans. They also found that many Asians privileged economic benefits over democracy.
One limitation with this group of research is that most of these studies are conducted at the national level. Although they intended to reveal the national differences, very few studied the spatially different opinions within one country. Therefore, with its vast territory, the case of China offers an opportunity to study the modernization theory and how it varies within a country. In this article, we argue that the Chinese Internet users living in different places have different articulation of political, economic and sociocultural values.
In particular, we respond to the modernization theory by drawing upon two traditions in political geography. On the one hand, many geographers questioned the teleology of capitalist mode of production in the modernization theory (Hart Citation2002; O’Loughlin Citation1990). For example, O’Loughlin, Flint, and Anselin (Citation1994) showed that although Huntington’s three waves of democratization did happen at the global scale, the process of democratization has been contingent upon very specific historical and regional incidents in Africa and Eastern Europe. Therefore, they argued that a global democracy was by no means necessary. Engaging with the broader debate about ‘multiple modernities’, many geographers also problematized the neo-liberal, developmental paths to capitalist democracy advocated by the IMF and World Bank (for a more recent debate, see Barnett and Bridge Citation2013). In this article, we do not intend to make another critique on the capitalism–liberalism nexus. Instead, we ask empirically whether or not the liberal-democratic beliefs, whatever form it may take, is privileged by the Chinese people over other demands.
On the other hand, geographers also pointed out the spatially complicated correlation between ideological opinions and economic development, a tradition deeply rooted in electoral geography. For example, O’Loughlin, Flint, and Anselin (Citation1994) were among the first to use spatial statistics to analyse the correlation between local economic indexes and Nazi votes in Germany in 1930. More recently, geographers also pointed to an economic geography of voting, in which the voter’s economic status, ideological belief and local cultural atmosphere all contribute to the electoral turnout (Shin and Agnew Citation2008). However, these researches mainly focus on elections in western democracies, while very few have studied the ideological opinions in non-democratic countries. In particular, very few geographers have collected Chinese people’s ideological opinions with spatial information. In this article, we show that Internet surveys have potentials to offer a new perspective to study the ideological opinions in China.
Online surveys as a tool to study ideology
While online surveys have been proven by researcher to provide reliable and valid data since 2000s (Evans and Mathur Citation2005; Couper Citation2000), similar to conventional surveys, they have pros and cons as well.
Among many of its pros, online surveys give researchers the possibility to conduct large-scale data collection with a low budget as compared to traditional surveys (Hooghe Liesbet et al. Citation2010; Evans and Mathur Citation2005; Couper Citation2000). In particular, surveys have been proven to be efficient to study people’s ideological opinions. As illustrated by the 2002 and 2006 Chapel Hill expert surveys on party positioning, surveys provided valid and reliable data (Hooghe et al. Citation2010). Hooghe and other researchers used Likert scales to collect experts’ responses on European political party positioning issues. A sample question from the Chapel Hill expert surveys would make a statement first, and ask the participant to respond by choosing a number between 0 and 10 to identify his/her position with regard to that statement. In our study, we used the CPC, which is also a Likert-scale-based survey. Overall, Likert scales are effective in reflecting the continuous ideology underlying the questions (Allen and Seaman Citation2007).
On the other hand, online surveys also come with a number of disadvantages. The most crucial problem with online survey is sampling bias, which has concerned researchers since the early 2000s. In early times, Internet coverage was still limited in the US. For example, in the review paper of online surveys, Couper (Citation2000) found that 53% people were using Internet at home or work. Thus, he was concerned with the coverage error, which was defined as ‘the mismatch between the target population and the frame population’ (Couper Citation2000, p. 466). Researchers also found that the Internet population was skewed by the upscale male population (Evans and Mathur Citation2005). However, this skewness may be controlled through filter questions. For example, Smith and others (Citation2016) found that data collected from Amazon’s Mechanical Turk showed better respondent integrity in attention filter questions.
Another issue with online survey is that, when using online surveys to study ideological opinions, participants’ responses might be influenced by the way in which the survey was designed. For example, if the question is sensitive or makes the participant feel uneasy, there might be a bias. A study involving Internet news reading obtained similar results: threatening images (and to a lesser degree, innocuous images) resulted in more frequent selection of the accompanying news stories and increased reading times in an open-ended news reading task (Knobloch et al. Citation2003).
However, as Wright (Citation2005) pointed out, all of these problems also apply to conventional surveys, sometimes at even higher degrees. Given the fact that China has reported the Internet coverage as 90.1% in 2015 (CNNIC, Citation2015), the coverage error should not be considered as a major threat to the representativeness of online surveys. The CPC has also developed a number of ways to control the quality of the sample, which are discussed in the later section about the limitation of the data set.
Learning ideological opinions in China through online surveys
Chinese people’s ideological opinions are difficult to collect through traditional surveys due to the political environment (Carlson et al. Citation2010; Shi and Lou Citation2010; Tang Citation2005). Online surveys thus provide a possible bypass to collect politically sensitive data with locational information, as anonymity of the online surveys may encourage participants to freely express their political views. This advantage resonates with a parallel debate about the use of Internet in China. As Chen (Citation2014, p. 4) noted, the Chinese government ‘has invested enormous computational and human resources for censorship as well as for influencing public opinion’. Even though more critiques on the government via Chinese Internet do not necessarily lead to any large-scale civil movement, scholars found that the Internet did help people exchange their ideological opinions to a certain extent (Hsieh and Li Citation2014; Huang and Sun Citation2014; Tong and Zuo Citation2014).
Unlike the conventional surveys, CPC offers a new lens to study ideological opinions in China. Since the data set was made public by the creators in 2015, there has been a few of analyses about it. Wu (Citation2013) has explored the potentials of the CPC data by investigating the ideological polarization among Chinese Internet users from 2008 to 2011. She argued that online surveys would reduce the political fear of respondents and convey more authentic information. Therefore, for collecting ideological opinions, response rates through CPC may be higher than through conventional surveys. In particular, Wu studied the temporal pattern of the data and found an increasing number of people shifting their ideology from nationalism to cultural liberalism. However, it is not clear in her research whether the shift is overall or spatially concentrated in certain parts of China. For this article, we contribute a spatial perspective to the ideological polarization.Footnote2
Methods
Data collection process
This article uses the data of the CPC self-assessment (as of 9 November 2016, Zhongguo zhengzhi zuobiao ceshi, http://zuobiao.me/), which is a website developed by a group of students at Peking University in 2007. The data set we used in this article is a random subset containing 1300 entries from an original data set of over 20,000 from 2007 to 2008.
We collected the geographic information in two steps: (1) this CPC is an anonymous online survey, in which all participants take the survey voluntarily, and provide their geographical location information via secured IP information. Participants were informed before they start the survey in the consent form that, their results will be shared with researchers in an aggregated, anonymous form; (2) to convert the partial IP information into geographic coordinates, we used ‘Tencent IP Database’ (http://ip.qq.com/help.shtml), which is a database voluntarily constructed by Internet users. When the users log into Tencent QQ, the most popular Instant Messaging software in China, they are asked to provide their current locational information voluntarily, as to which city/what part of the city they are at. This geographical information is recorded by Tencent together with the IP in the database. By June 2014, the Tencent IP Database had 444,828 records in its database geocoding IP addresses to geographic locations. This volunteered database is believed to be more complete and accurate than other IP address lookup tools with regard to Chinese IPs (Tencent IP share project, Citation2016). We use the voluntary Tencent IP database and convert participants’ partial IPs to cities.
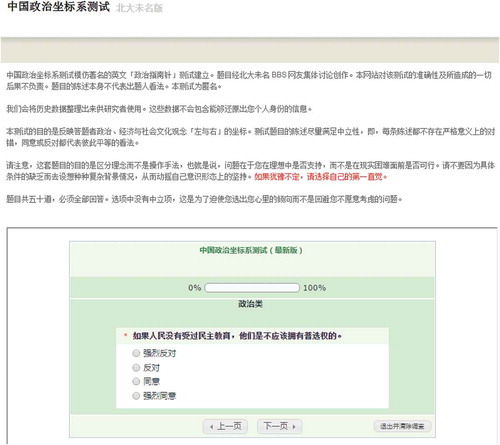
The CPC includes three sets of questions: the political, economic and sociocultural dimensions. The political dimension is measured by 20 questions: the negative responses indicate Authoritarianism, and the positive responses indicate Libertarianism. The economic dimension is measured by 20 questions as well: the negative responses indicate Communism and Collectivism, and the positive responses indicate neo-liberalism in economy. The sociocultural dimension is measured by 10 questions: the negative responses indicate Conservatism, and the positive ones indicate Liberalism. shows a typical question in the political dimension. Responses are coded based on four options in a range [−2, 2]: strongly disagree = − 2, disagree = − 1, agree = 1 and strongly agree = 2. Each dimension is then assigned the mean value of all of its questions.
Figure 1. User interface of Chinese Political Compass as of 3 April 2015, Chinese Political Compass, http://zuobiao.me/.
Above exemplifies a typical question in political coordinate. It asks: ‘If people never received any education on democracy, they should not have universal suffrage.’ The four answers are strongly disagree, disagree, agree and strongly agree. On top, the website developer states the rationale of eliminating a neutral option as ‘pushing you to think what you truly believe without an option of avoiding thinking.’
We are aware that there have been debates about the very terminologies in geography discipline. For example, there has never been a consistent definition for neo-liberalism (Brenner, Peck, and Theodore Citation2010). It is thus beyond our scope to engage with these debates in this article. We treat these terminologies with their face value. Because CPC is created by Chinese for Chinese, we treat it as a self-referential system without investigating the semantically ambiguous meanings in western academia. This is thus consistent with our hypothesis that Chinese Internet users may take ideologies different than people in the west.
The contents of the self-reported measures were modified from the original English version Political Compass (Citation2016) according to Chinese culture and so better reflected the ideology of the Chinese people. The modifications were performed collaboratively through online discussions on Peking University’s online discussion forum. People who contributed to the improvement were mainly registered Peking University students. This adaptation is essential for our study, as the original political compass was officially excused as ‘culturally biased’ and ‘being promoted in western democracies’ only (as of 11 November 2016, Political compass, http://www.politicalcompass.org/faq). By the end of 2011, the number of CPC self-assessments ranged from 70,000 to 160,000 annually (Wu Citation2013). For further details of CPC, please refer to the Appendix.
Ethical concerns
Responses to the CPC were recorded together with the first three segments of their IP addresses. We convert the partial IP addresses into geographic locations and further identified as cities according to the Tencent IP database. Some locations host more participants than others: for example, 188 participants were in Beijing, while only 3 were in Haikou, Hainan province. The IP addresses only indicate where the participant was while he/she was taking the online survey. Since CPC is web-based rather than mobile-based, we assume the majority of our participants did the CPC in their residential city.
As researchers, we fully understand that the information we collected is sensitive, since it is about people’s ideological views in an authoritarian country. We also realize that it is possible that in the future the Chinese government may force either us or the administrator of CPC to reveal the data. The first three segments of IP can only be traced down to the city level. Given the size of the Chinese cities and the size of our sample, even in extreme cases such as a city with less than five responses, participants’ locations are still technically not traceable. Moreover, as many recent studies have already shown, the contemporary political environment in China actually allows a certain degree of ideological dissents on Internet such as those on Weibo (microblogging), provided they were not prominent on news media and no actual organization was mobilized (Chan et al. Citation2012).
Limitations of the data set
Due to the fact that CPC was initially posted on the online forums of major Chinese universities, it can be expected that the sample is biased to young, university-educated, Internet users. Other issues may also involve the self-selection effect. One concern of our study is that people who participate in such online surveys tend to be more liberal so they choose Internet to reflect their thoughts. Or people who wish to express their political thoughts are more politically extreme than the general population. Due to all these reasons, we do not argue that the sample is enough to characterize anything about the Chinese population.
That being said, we still believe in the value of the CPC data set for two reasons. First, the creators of CPC were certainly aware of the potential problems with online survey and made efforts to control the quality of the survey. One of the solutions was to ask multiple questions about similar issues to get the true opinion from the respondent. For example, in the political dimension of CPC, one question (P6) asks ‘Imitating the Western-style freedom of speech will cause social disorder in China.’ The next question (P7) asks ‘Religious workers should be allowed to preach publicly in non-religious space.’ (See Appendix.) In essence, both questions ask about the freedom of speech but because they are being asked in two different ways, it is more likely to have an authentic answer from the respondent. Second, we believe that for the rarity of people’s ideological records in China, CPC is valuable even with the sampling bias. Compared to the publically funded, internationally collaborative Asian Barometer Survey, CPC offers probably the only other viable alternative to glimpse on the ideological opinions in China, with much less cost and time.
Data aggregation
Our analysis was based on two levels of data aggregation. First, we conduct Global Moran’s I and Anselin Local Moran’s I using the data set aggregated to the city level. That is, each city received the mean value of its data points. Global Moran’s I is a single value that represents the entire geographic area. It can be regarded as an average for the entire area (Moran, Citation1950). Anselin Local Moran’s I is a local indicator of spatial association, which shows whether one single observation’s value is similar to its neighbouring observations’ values within the distance threshold (Anselin Citation1995). It is a powerful tool to reveal local spatial clusters, or hot spots, which indicate local patterns of spatial association (Anselin Citation1995). Our assumption is that people who live nearby will share similar ideological opinions. Second, our correlations are carried out based on aggregated data at provincial level. Again, each province receives the mean value of the data points within that province. Since many western cities have no or very few data points compared to eastern cities, we run correlations at provincial level to minimize the problem of sampling bias.
Results and analysis
Cluster analysis at the city level
At the first stage of the statistical analysis, we examined the spatial autocorrelation of the CPC dimensions of the cities. The spatial autocorrelation at the global level was examined by Global Moran’s I. We find that there are no general clustering trends for political, economic and sociocultural dimensions (see ). The results show that on average people who live in the same area do not necessarily share the same ideological opinions.
Table 1. Global Moran’s I analysis on the political, economic and sociocultural view distribution.
Though there is no spatial autocorrelation of people’s ideological opinions at the global level, we see patterns when we look at the three dimensions of the Compass at individual cities. After calculating the Anselin Local Moran’s I for three dimensions separately, we find some clusters and outliers as shown in –. The conceptualization of spatial relationships was defined as fixed Euclidean distance. We define the threshold distance as 240 km, for China’s highway speed limit is 120 km/h, and we use 2-h driving distance as the threshold.Footnote3
Figure 2. Political dimension clusters and outliers.
Figure 3. Economic dimension clusters and outliers.
Figure 4. Sociocultural dimension clusters and outliers.
In the city-level cluster and outlier analysis (Anselin Local Moran’s I) results (–), squares show the locations where high values are clustered together; triangles, the low values; circles, where high and low values are mixed as outliers; and grey dots, no significant pattern. We are more interested in the clusters where the High–High (square) and Low–Low (triangle) clustering occur.
In , high value means Libertarianism, while low value means Authoritarianism. The High–High cluster appears in the city of Harbin in the northeastern corner, while the Low–Low clusters are across central and southern provinces. These provinces not only include poorer cities in Henan and Hubei but also include more developed cities in Guangdong and Fujian. The percentage of extreme political opinions is 1.57% for High–High clusters, and 5.74% for Low–Low clusters. These numbers show that extremists are rare; but there are more extreme Authoritarians than extreme Libertarians overall.
In , high value means economic neo-liberalism, while low value means collectivism. The two High–High clusters represent the cities in the west and the north, including Lanzhou, Chengdu, Changchun and Harbin, while the Low–Low clusters are again across central and eastern provinces with diverse levels of economic prosperity such as Beijing and Shanxi. The percentage of extreme economic opinions is 1.23% for High–High clusters, and 6.32% for Low–Low clusters. Again, there are more extreme collectivists than extreme neo-liberalists in economy.
In , low sociocultural values indicate Conservatism, and high values indicate Liberalism. The Compass defines Liberalism in China as the reception of western pop culture such as more liberal sex relationships, and Conservatism as a set of the traditional cultural practices, such as herbal therapy. Ironically, the three clusters of Conservatism are all found in Zhejiang and Fujian provinces, where economy is considered more developed in China. This part of the country province is also famous for its private small- and medium-sized enterprises, where the more developed economy does not lead to sociocultural liberalism. In contrast, the High–High clusters are mainly less developed cities in inland provinces such as Henan and Gansu. The percentage of extreme sociocultural opinions is 2.42% for High–High clusters, and 0.48% for Low–Low clusters. Unlike political and economic extremists, sociocultural extremists are mostly liberalists.
Overall speaking, the relationship between local economic development and Internet users’ ideological opinions seems to be heterogeneous. In all the three dimensions, the more liberal cities are not concentrated in the most developed southeast China.
Correlation analysis at the provincial level
To look at the relationships between socio-economic factors and people’s ideological opinions, we use the aggregated values of three dimensions at the provincial level. To test the correlation between ideological opinions and the actual level of socio-economic development, we explore the National Statistics of 2008 for 21 Chinese provinces (Hainan and Taiwan are excluded for insufficient data), three Autonomous Regions (excluding Xizang and Xinjiang for insufficient data) and the four municipalities (Beijing, Tianjin, Shanghai and Chongqing). All the variables are explained in .
Table 2. Explanation on variables in the correlation analysis.
As students of the modernization theory proposed, there are ‘social prerequisites for democracy’ (Lipset Citation1959, Citation1994) such as education levels and a diversified economy. Inspired by this work, we develop two hypotheses. The primary hypothesis is that the economic structure not only determines people’s economic views but also has a significant impact on their political and sociocultural views. For example, the higher the proportion of agriculture in the economy has, the more culturally conservative the province is. This is because provinces which mainly rely on agriculture are usually inland, and less developed as compared to the rest of the country. Share of secondary and tertiary sectors may also predict people’s political views, such that liberal provinces may have a high percentage of service and a low percentage of manufacturing in the economy.
The second general hypothesis is that the level of development of a province can be indicated by socio-economic status. Thus, in addition to income per capita, Engel’s coefficient per capita, and provincial revenue, we also choose the three indicators of social prerequisites: the number of healthcare institutions, of entertainment institutions and of education and research institutions.
The descriptive statistics for the provincial data are provided in . The results show that for the nation as a whole, political opinions are only slightly prone to libertarianism (0.04), while both economic opinions are slightly prone to collectivism (−0.02). The more significant tendency is in the sociocultural opinions which lean towards conservatism (0.12).
Table 3. Descriptive statistics of variables.
Then we run the bivariate analysis and calculate the Pearson’s r correlations between variable pairs. Though Pearson’s r calculation does not require both variables to be normal, we still ran the test of normality to have a better understanding of the variables. shows the correlation results.
Table 4. Correlation results, n = 28.
At the provincial level, the political dimension, the sociocultural dimension and the economic dimension are significantly correlated with each other, with the Pearson correlation at the significant level of 0.01: political–sociocultural 0.799, political–economic 0.902, sociocultural–economic 0.682. This means that if a province is politically liberal, it is also economically and culturally liberal. This is accordant with the modernization theory. However, the significant correlation only means these factors are related with each other, and correlation does not mean causation.
Moreover, it also reveals that people’s political, sociocultural and economic views are significantly influenced by the normalized net exports of that area. The higher net exports a province/municipality has, the more liberal people in this area tend to be, as indicated by the positive and strong correlations.
Other factors unfortunately are not significantly correlated with people’s ideological opinions in China. One phenomenon which surprises us is that the number of education and research institutions per province is not significantly correlated with any of the dimensions. One possible explanation is that the participants of the CPC are mainly college students, and college students in less developed provinces are rather different from local residents. This result means that college students do not represent the majority very well in those areas.
Conclusions and discussions
In this article, we study the ideological opinions and its correlation with local economic indexes across scales in China. First, we show that there is an ideological heterogeneity across China. In general, there is no uniform correlation between local economic development and Internet users’ ideological opinions. However, we also show that there are many outliers at the city level in terms of the relationship between political, economic and sociocultural ideologies. In particular, local economic structures likely determine the particular articulation of ideological opinions, i.e. Harbin’s economic neo-liberalism plus political libertarianism and Zhejiang and Fujian’s sociocultural Conservatism. It actually conforms what people believe to be a political pragmatism in China. Shi and Lou (Citation2010) argue that influenced by Confucianism, the concept of democracy understood by the Chinese people is in fact a modern version of Mencius’s Min-ben, which does not require the ruler to represent the people but requires the ruler to govern for the people. Less concerned with the institutional and procedural settings of liberal democracy, the Chinese people privilege the effectiveness of the government to bring welfare to everyone.
Meanwhile, this article contributes to the literature of modernization theory in two ways. First, we revive the interest of modernization theory in geography, in particular with the case of China. Political geographers have developed a methodology of spatial statistics to study ideological attitudes, upon which our research heavily relies (Shin and Agnew Citation2008; O’Loughlin, Flint, and Anselin Citation1994). However, very few geographers have applied the lessons of electoral geography to a non-European/American, undemocratic country, not to mention the ideological opinions of the Chinese people.
Second, we contribute to the recent literature that tries to appreciate the internal complexities of the Chinese politics at sub-national scales. Even though many scholars have indicated rural–urban, north–south differentiations in China (Shi and Lou Citation2010), few of them have focused on the spatial pattern of the ideological opinions in China. Similar to the case of Italy (Shin and Agnew Citation2008), we argue that the ideological opinions of the Chinese people also reflect a spatial heterogeneity which has not yet been captured by the existing China studies.
Limitations and future work
Despite the findings, we also notice a number of limitations in our research. One is the legal issue in the usage of online surveys. What legal norms should be applied to online data collection and data sharing is still under discussion by researchers (Scassa Citation2013; Chandler and Levitt Citation2011). Particularly when researchers collect sensitive data online, what legal terms the website owner should follow, and what risks each site should take deserves further discussion. Current issues of sensitive, politically related geographic information management in the United States were discussed by Crampton Roberts, and Poorthuis (Citation2013).
Other issues may also involve the sampling bias in online surveys. One concern of our study is that people who participate in such online political surveys tend to be more liberal so they choose Internet to reflect their thoughts. Or people who wish to express their political thoughts are more politically extreme than the general population. In the case of CPC, most participants were college students who were introduced to CPC on the school discussion forum and social networking websites. Hopefully the future mobile version of CPC will cover other parts of the population. The involvement of participants with more diverse socio-economic backgrounds may improve the accuracy of the CPC data.
Disclosure statement
No potential conflict of interest was reported by the authors.
Notes
1. Please beware that liberal ideology is a necessary but not sufficient factor for democratization. This article does not analyse the political democratization in China per se, which requires conditions including active political parties and many supporting institutions (Diamond Citation2008; Fukuyama Citation2011). These conditions are beyond our research scope.
2. After we submitted the first draft of this article on 31 January 2015, we noticed that Pan and Xu (Citationforthcoming) published a working paper on April 12 also using the data from CPC. Similar to our finding, Pan and Xu showed that Chinese Internet users’ ideological opinions were positively related to the structure of the economy rather than income level. However, our article is different in three ways. First, we discuss the results in the contexts of geographic information science (GIS) and political geography. Second, we study the city-level geography which shows a clear spatial heterogeneity. Finally, we carefully discuss the potential ethnical problems associated with the data.
3. We calculated the average distance among sampling cities within the same province for two provinces: Jiangsu and Zhejiang. Jiangsu was 262 km and Zhejiang 230 km. Therefore, we used 240 km (2-h driving distance) as the default cluster analysis.
References
- Allen, E., and C. A. Seaman. 2007. “Likert Scales and Data Analyses.” Quality Progress 40: 7.
- Anselin, L. 1995. “Local Indicators of Spatial Association—Lisa.” Geographical Analysis 27 (2): 93–115. doi:10.1111/j.1538-4632.1995.tb00338.x.
- Barnett, C., and G. Bridge. 2013. “Geographies of Radical Democracy: Agonistic Pragmatism and the Formation of Affected Interests.” Annals of the Association of American Geographers 103: 1022–1040. doi:10.1080/00045608.2012.660395.
- Brenner, N., J. Peck, and N. Theodore. 2010. “Variegated Neoliberalization: Geographies, Modalities, Pathways.” Global Networks 10: 182–222. doi:10.1111/j.1471-0374.2009.00277.x.
- Carlson, A., M. E. Gallagher, K. Lieberthal, and M. Manion. 2010. Contemporary Chinese Politics: New Sources, Methods, and Field Strategies. New York: Cambridge University Press.
- Chan, M., X. Wu, Y. Hao, R. Xi, and T. Jin. 2012. “Microblogging, Online Expression, and Political Efficacy among Young Chinese Citizens: The Moderating Role of Information and Entertainment Needs in the Use of Weibo.” Cyberpsychology, Behavior, and Social Networking 15: 345–349. doi:10.1089/cyber.2012.0109.
- Chandler, J. A., and K. Levitt. 2011. “Spatial Data Quality: The Duty to Warn Users of Risks Associated with using Spatial Data.” Alberta Law Review 49: 79.
- Chen, W. 2014. “Taking Stock, Moving Forward: The Internet, Social Networks and Civic Engagement in Chinese Societies.” Information, Communication & Society 17: 1–6. doi:10.1080/1369118X.2013.857425.
- Chu, Y.H., L. Diamond, A. J. Nathan, and D. C. Shin 2008. “Comparative Perspectives on Democratic Legitimacy in East Asia.” In How East Asians View Democracy, edited by Y.-H. Chu, L. Diamond, A. J. Nathan and D. C. Shin, 1-38. New York: Columbia University Press.
- CNNIC. Computer and Internet Access in China: 2015 [cited November 9th, 2016]. Available from http://tech.sina.com.cn/z/CNNIC37/.
- Couper, M. 2000. “Review: Web Surveys: A Review of Issues and Approaches.” The Public Opinion Quarterly 64 (4): 464–494. doi:10.1086/318641.
- Crampton, J. W., S. M. Roberts, and A. Poorthuis. 2013. “The New Political Economy of Geographical Intelligence.” Annals of the Association of American Geographers 104: 196–214. doi:10.1080/00045608.2013.843436.
- Diamond, L. 1999. Developing Democracy: Toward Consolidation. Baltimore: Johns Hopkins University Press.
- Diamond, L. 2008. The Spirit of Democracy: The Struggle to Build Free Societies Throughout the World. 1st ed. New York: Times Books/Henry Holt and Company.
- Evans, J., and A. Mathur. 2005. “The Value of Online Surveys.” Internet Research 15 (2): 195–219. doi:10.1108/10662240510590360.
- Fukuyama, F. 2011. The Origins of Political Order: From Prehuman Times to the French Revolution. 1st ed. New York: Farrar: Straus and Giroux.
- Fukuyama, F. 2012. “The Patterns of History.” Journal of Democracy 23: 14–26. doi:10.1353/jod.2012.0005.
- Hart, G. 2002. “Geography and Development: Development/S beyond Neoliberalism? Power, Culture, Political Economy.” Progress in Human Geography 26: 812–822. doi:10.1191/0309132502ph405pr.
- Hooghe, L., R. Bakker, A. Brigevich, C. De Vries, E. Edwards, G. Marks, J. Rovny, M. Steenbergen, and M. Vachudova. 2010. “Reliability and Validity of the 2002 and 2006 Chapel Hill Expert Surveys on Party Positioning.” European Journal of Political Research 49 (5): 687–703. doi:10.1111/ejpr.2010.49.issue-5.
- Hsieh, Y. P., and L. Meng-Hao. 2014. “Online Political Participation, Civic Talk, and Media Multiplexity: How Taiwanese Citizens Express Political Opinions on the Web.” Information, Communication & Society 17: 26–44. doi:10.1080/1369118X.2013.833278.
- Huang, R., and X. Sun. 2014. “Weibo Network, Information Diffusion and Implications for Collective Action in China.” Information, Communication & Society 17: 86–104. doi:10.1080/1369118X.2013.853817.
- Kenski, K., and N. J. Stroud. 2006. “Connections between Internet Use and Political Efficacy, Knowledge, and Participation.” Journal of Broadcasting & Electronic Media 50: 173–192. doi:10.1207/s15506878jobem5002_1.
- Knobloch, S., M. Hastall, D. Zillmann, and C. Callison. 2003. “Imagery Effects on the Selective Reading of Internet Newsmagazines.” Communication Research 30 (1): 3–29. doi:10.1177/0093650202239023.
- Lerner, D. 1958. The Passing of Traditional Society: Modernizing the Middle East. New York: Free Press.
- Lipset, S. M. 1959. “Some Social Requisites of Democracy: Economic Development and Political Legitimacy.” The American Political Science Review 53: 69–105. doi:10.2307/1951731.
- Lipset, S. M. 1994. “The Social Requisites of Democracy Revisited: 1993 Presidential Address.” American Sociological Review 59: 1–22. doi:10.2307/2096130.
- Mao, Y. 2015. Zhongguo Zhengzhi Zuobiao Ceshi [cited January 25 2015]. Available from http://zuobiao.me/.
- Moran, P. A. P. 1950. “Notes On Continuous Stochastic Phenomena.” Biometrika 37 (1): 17–23. doi:10.1093/biomet/37.1-2.17.
- O’Donnell, G. 2010. Democracy, Agency, and the State: Theory with Comparative Intent. Oxford; New York: Oxford University Press.
- O’Loughlin, J. 1990. “Political Geography: Attempting to Understand a Changing World Order.” Progress in Human Geography 14: 420–437. doi:10.1177/030913259001400306.
- O’Loughlin, J., C. Flint, and L. Anselin. 1994. “The Geography of the Nazi Vote: Context, Confession, and Class in the Reichstag Election of 1930.” Annals of the Association of American Geographers 84: 351–380. doi:10.1111/j.1467-8306.1994.tb01865.x.
- O’Loughlin, J., M. D. Ward, C. L. Lofdahl, J. S. Cohen, D. S. Brown, D. Reilly, K. S. Gleditsch, and M. Shin. 1998. “The Diffusion of Democracy, 1946-1994.” Annals of the Association of American Geographers 88: 545–574. doi:10.1111/0004-5608.00112.
- Pan, J., and Y. Xu. Forthcoming. “China’s Ideological Spectrum.” The Journal of Politics. doi:10.2139/ssrn.2593377
- Political Compass [ cited November 11, 2016]. Available from http://www.politicalcompass.org/faq.
- Przeworski, A., and F. Limongi. 1997. “Modernization: Theories and Facts.” World Politics 49: 155–183. doi:10.1353/wp.1997.0004.
- Scassa, T. 2013. “Legal Issues with Volunteered Geographic Information.” The Canadian Geographer/Le Géographe Canadien 57: 1–10. doi:10.1111/j.1541-0064.2012.00444.x.
- Shen, F., N. Wang, Z. Guo, and L. Guo. 2009. “Online Network Size, Efficacy, and Opinion Expression: Assessing the Impacts of Internet Use in China.” International Journal of Public Opinion Research 21: 451–476. doi:10.1093/ijpor/edp046.
- Shi, T., and L. Jie. 2010. “The Shadow of Confucianism.” Journal of Democracy 21: 123–130. doi:10.1353/jod.2010.0012.
- Shi, T., and D. Lou. 2010. “Subjective Evaluation of Changes in Civil Liberties and Political Rights in China.” Journal of Contemporary China 19: 175–199. doi:10.1080/10670560903335900.
- Shin, M., and J. Agnew. 2008. Berlusconi’s Italy: Mapping Contemporary Italian Politics. Philadelphia: Temple University Press.
- Sinton, J. E. 2001. “Accuracy and Reliability of China’s Energy Statistics.” China Economic Review 12 (4): 373–383.
- Smith, S. M., C. A. Roster, L. L. Golden, and G. Albaum. 2016. “A Multi-Group Analysis of Online Survey Respondent Data Quality: Comparing A Regular USA Consumer Panel to Mturk Samples.” Journal of Business Research 69 (8): 3139–3148. doi:10.1016/j.jbusres.2015.12.002.
- Tang, W. 2005. Public Opinion and Political Change in China. Stanford, CA: Stanford University Press.
- Tencent. Tencent IP Share Project, November 9th, 2016. Available from http://ip.qq.com/help.shtml.
- Tong, J., and L. Zuo. 2014. “Weibo Communication and Government Legitimacy in China: A Computer-Assisted Analysis of Weibo Messages on Two ‘Mass Incidents’†.” Information, Communication & Society 17: 66–85. doi:10.1080/1369118X.2013.839730.
- Welzel, C., and R. Inglehart. 2008. “The Role of Ordinary People in Democratization.” Journal of Democracy 19: 126–140. doi:10.1353/jod.2008.0009.
- Wright, K. B. 2005. “Researching Internet-Based Populations: Advantages and Disadvantages of Online Survey Research, Online Questionnaire Authoring Software Packages, and Web Survey Services.” Journal of Computer-Mediated Communication 10: 00. doi:10.1111/j.1083-6101.2005.tb00259.x.
- Wu, A. X. 2013. “Ideological Polarization over a China-As-Superpower Mindset: An Exploratory Charting of Belief System among Chinese Internet Users, 2008-2011.” International Journal of Communication 8: 2243–2272.
- Xenos, M., and P. Moy. 2007. “Direct and Differential Effects of the Internet on Political and Civic Engagement.” Journal of Communication 57: 704–718. doi:10.1111/j.1460-2466.2007.00364.x.
- Zhang, G., and Z. Zhao. 2006. “Reexamining China’s Fertility Puzzle: Data Collection and Quality over the Last Two Decades.” Population and Development Review 32: 293–321. doi:10.1111/padr.2006.32.issue-2.
- Zhongguo Zhengzhi Zuobiao Ceshi [ cited November 9, 2016]. Available from http://zuobiao.me/.
- Zhou, X. 2009. “The Political Blogosphere in China: A Content Analysis of the Blogs regarding the Dismissal of Shanghai Leader Chen Liangyu.” New Media & Society 11: 1003–1022. doi:10.1177/1461444809336552.
Appendix
Chinese Political Compass
The Chinese Political Compass is composed of three parts: The political dimension, the economic dimension and the sociocultural dimension. Each dimension is measured as the mean score of 10–20 self-report questions. A self-report question contains four response options: strongly disagree, disagree, agree and strongly agree. The response is designed on purpose not to include the ‘unsure’ or neutral option, so the person who takes the compass test is forced to face the questions being asked and choose a side (Mao Citation2015). The political dimension is measured by 20 questions; the negative political value indicates Authoritarianism, and the positive value indicates Libertarianism. The economic dimension is measured by 20 questions as well; the negative economic value indicates Communism and Collectivism, and the positive value indicates Neoliberalism in Economy. The sociocultural dimension is measured by 10 questions; the negative sociocultural value indicates Conservatism, and the positive value indicates Liberalism.
Following are the original CPC items in Chinese and the English translation. Most items were translated by Wu (Citation2013); the rest of the items marked with an asterisk were translated by the author Xiao of this article.
Political Dimension Items
P1-如果人民没有受过民主教育,他们是不应该拥有普选权的。
P1-If people did not receive education of democracy, they should not have the right of universal suffrage.
P2-人权高于主权。
P2-Human rights have precedence over national sovereignty.
P3-西方的多党制不适合中国国情。
P3-The multiparty system of the West does not suit the conditions of China.
P4-发生重大社会安全事件时,即使认为信息公开会导致骚乱的风险,政府仍应该开放信息传播。
P4-When severe incidents that affect social security happen, even if doing so may risk disturbances, the government should still ensure open communication of information.
P5-由高校自主考试招生比全国统一考试招生更好。
P5-Independent recruitment by universities is better than national standard exam.
P6-在中国照搬西方式的言论自由会导致社会失序。
P6-Imitating the Western-style freedom of speech will cause social disorder in China.
P7-应该容许宗教人士在非宗教场所公开传教。
*P7-Religious workers should be allowed to preach publicly in non-religious space.
P8-无论中小学生或大学生,都应参加由国家统一安排的军训。
P8-All students, no matter in elementary, secondary or higher education, should participate in military training arranged by the state.
P9-国家的统一和领土完整是社会的最高利益。
P9-The highest interest of society is national territorial integrity.
P10-国家有义务进行对外援助。
*P10-Foreign aids are part of the nation’s responsibility.
P11-哪怕经历了违反程序规定的审讯和取证过程,确实有罪的罪犯也应被处刑。
*P11-Though the procedures to investigate and obtain the evidence may be against regulations, confirmed criminals should be condemned.
P12-国家领导人及开国领袖的形象可以作为文艺作品的丑化对象。
P12- Images of national leaders and founding figures of the country can be teased in literary and artistic works.
P13-当法律未能充分制止罪恶行为时,人民群众有权自发对罪恶行为进行制裁。
P13-If with sufficient comprehensive strength, China has the right of any actions in order to protect its own interest.
P14-应当允许媒体代表某一特定阶层或利益集团发言。
*P14-Media should be allowed to speak for certain social classes or interest groups.
P15-如果国家综合实力许可,那么中国有权为了维护自己的利益而采取任何行动。
*P15-If allowed by the comprehensive strength, China has its right to take any action to protect its national interest.
P16-应该允许中国公民同时具有外国国籍。
P16-The Chinese citizen should be allowed to keep a foreign nationality simultaneously.
P17-条件允许的话应该武力统一台湾。
P17-If the conditions allow it, we should seek the reunification of Taiwan through military measures.
P18-国家应当采取措施培养和支持体育健儿在各种国际比赛场合为国争光。
P18-The nation state should take measures to train and support athletes to win national glory in various international games.
P19-律师即使明知被辩护人的犯罪事实也应当尽力为其进行辩护。
*P19-Even if the lawyer knows the defendant is guilty, he/she should try the best to defend the client.
P20-以美国为首的西方国家不可能真正容许中国崛起成为一流强国。
P20-The US-led Western countries will not really allow the rise of China as a first-rate strong nation.
Cultural–Sociological Dimension Items
S1-两个成年人之间自愿的性行为是其自由,无论其婚姻关系为何。
S1-Sex activities between two consensual adults are their freedom of choice, regardless of their marital status.
S2-不应公开谈论自己长辈的缺点。
*S2-Shortcomings of seniors should not be discussed in public.
S3-现代中国社会需要儒家思想。
S3-Contemporary Chinese society needs Confucius wisdom.
S4-判断艺术作品的价值的根本标准是看是不是受到人民大众喜爱。
*S4-The ultimate standard to judge an art work’s value is to see whether it is loved by the masses.
S5-即使有人口压力,国家和社会也无权干涉个人要不要孩子,要几个孩子。
S5-Even if there is population pressure, the nation state and society has no right to interfere with whether the individual wants children, and how many children she/he wants.
S6-周易八卦能够有效的解释很多事情。
S6-I Ching and the Eight Diagrams can provide effective explanations of many things.
S7-中国传统医学对人体健康的观念比现代主流医学更高明。
S7-The notion of human health in Chinese traditional medicine is superior to that in modern, mainstream medicine.
S8-汉字无需人为推行简化。
*S8-The usage of Simplified Chinese characters does not need to be pushed.
S9-应当将中国传统文化的经典作品作为儿童基础教育读物。
S9-We should use classics in traditional culture as major readings for children.
S10-如果是出于自愿,我会认可我的孩子和同性结成伴侣关系。
S10-If out of his or her freewill, I acknowledge the partnership my child has with his/her same sex partner.
Economic Dimension Items
E1-最低工资应由国家规定。
*E1-Minimum wages should be set by the nation.
E2-中国改革开放以来的经济发展的成果都被一小群人占有了,大多数人没得到什么好处。
E2-Fruits of China’s economic developments since the reform and opening up are taken by a minority. The majority of people do not receive much benefit.
E3-在重大工程项目的决策中,个人利益应该为社会利益让路。
E3-In the decision-making of large-scale engineering projects, societal interests take primacy over individual interests.
E4-浪费粮食也是个人的自由。
E4-It is the individual’s freedom to waste food.
E5-如果猪肉价格过高,政府应当干预。
E5-If the price of pork is too high, the government should intervene.
E6-应当对国外同类产品征收高额关税来保护国内民族工业。
E6-The tariff on imported products should be high to protect domestic industries.
E7-国有企业的利益属于国家利益。
*E7- The revenue of state-owned enterprises belongs to the national interest.
E8-试图控制房地产价格的行为会破坏经济发展。
E8-Attempts to control real estate prices will wreck economic development (negative).
E9-教育应当尽可能公立。
*E9- Education should be public whenever possible.
E10-改善低收入者生活的首要手段是国家给予财政补贴和扶持。
*E10- The major approach to improve the life quality of low-income people should be subsidy and support at the national level.
E11-有钱人理应获得更好的医疗服务。
*E11-Rich people deserve better medical services.
E12-高收入者应该公开自己的经济来源。
E12-The high-income population should make sources of their income public.
E13-靠运作资金赚钱的人对社会的贡献比不上靠劳动赚钱的人。
*E13-People who make money by capital operation do not make as much contribution to the society as those who make money by selling labour.
E14-与其让国有企业亏损破产,不如转卖给资本家。
*E14-Rather than allowing the bankruptcy of state-owned enterprises, it is better to sell them to capitalists.
E15-市场竞争中自然形成的垄断地位是无害的。
*E15-The monopoly formed naturally during market competition is harmless.
E16-那些关系到国家安全、以及其他重要国计民生的领域,必须全部由国有企业掌控。
E16-The realms that have greatly to do with national security, national economy and people’s livelihood must be in the charge of state-owned enterprises.
E17-资本积累的过程总是伴随着对普通劳动人民利益的伤害。
E17-The process of capital accumulation always accompanies harms done to the interests of ordinary working people.
E18-私人应当可以拥有和买卖土地。
*E18-Lands can be owned and traded by private owners.
E19-政府应当采用较高的粮食收购价格以增加农民收入。
E19-The government should purchase produce at a relatively high price in order to increase the farmers’ income.
E20-在华外国资本应享受和民族资本同样的待遇。
E20-Foreign capitals in China should enjoy the same treatment as domestic capitals (negative).