
ABSTRACT
Prediction of international water tides induced by gravitational centripetal forces of the Earth–Sun–Moon system is vital in various applications. Available methodologies and software that offer observation analysis and tide level prediction often support limited points of interest (mainly islands and ports), and they are mostly based on Harmonic Analysis algorithms. The present study proposes a geographical information system-based framework in order to store and retrieve tide information derived from co-tidal charts such as amplitude and phase charts. By retrieving the exact corresponding information of any point in Persian Gulf, the developed programme makes continuous tide prediction possible for every area of interest, including offshore locations, island boundaries, and alongside coasts of Persian Gulf’s states.
1. Introduction
Tidal prediction of oceans plays a significant role in various fields such as coastal development, military and commercial boating, recreational activities (e.g. swimming), hydrographic operations, hydrodynamic modelling researches, and so on. Fishermen estimate the state of concentration of different fish species based on the status of tidal currents and elevation of tide. Navigation in shallow water canals and estuaries depends vitally on the water depth changes induced by tidal oscillations. Intercostal route planning does also require tide and tidal currents information. Moreover, meteorologists and climatologists get better understanding of oceanographic changes and its relation to regional and global climate change by studying tidal oscillations. Tide prediction data are also one of the important elements in hydrodynamic modelling and Integrated Coastal Zone Management (Le Provost et al. Citation1998). Even though common algorithms just consider astronomical effects, and due to the complexity, neglect physical and meteorological effects like wind, storm, and tsunami, tide prediction provide useful understanding in many applications (Wyatt, Cabaniss, and Agnew Citation1982; Shum et al. Citation1997). Overall, it is fair to say that a thorough understanding of tides in each region leads to a better quality of life, especially for those inhabiting ashore.
Depending on the input data source(s), precision of observations, application, and the area within which prediction is being carried out, tide prediction approaches and methodologies vary to an extended level. Different studies have utilized different data sources, including tide gauges (Emery and Aubrey Citation2012), GRACE satellites observations (Han, Jekeli, and Shum Citation2004; Han, Shum, and Matsumoto Citation2005), and TOPEX/POSEIDON altimetry (Matsumoto, Takanezawa, and Ooe Citation2000). Moreover, different places may require different approaches of tide prediction. An example of this could be estuaries, wherein low water depth lead to tide-curve distortions, so, nondeterministic discharges may impede the prediction procedure (George and Simon Citation2015). Matte, Jay, and Zaron (Citation2013) adapted the classic harmonic prediction procedure for rivers.
In order to choose an appropriate tide prediction approach, many effective factors should be taken into account, and a wide range of researches have focused on the same subject. Among well-known algorithms implemented to predict tide level are Kalman Filter (Yen et al. Citation1996), Neural Network Models (Lee Citation2004), Harmonic Method (HM) (Doodson Citation1921; Schureman Citation1958; Godin Citation1972; Foreman Citation1979), Simplified Harmonic Method (SHM) (Whitcombe Citation1996), and Spectral Analysis (Vaníček Citation1971).
Due to the fact that increasing precision of observational tools demands solutions enabled by appropriate data management, some researches have focused on the precision of tide prediction. (Liu et al. Citation1985; Iz and Shum Citation2000; Iz Citation2006; Lyard et al. Citation2006).
Following the importance of more efficient data management, nowadays, geographical information system (GIS) is widely used as an alternative for classic analytical models. Applications of geographical information sciences and their capabilities in optimum location selection and spatial suitability analysis for the design, programming, and coastal management affairs have been evaluated in various studies (e.g. Shi, Jiang et al. Citation2010; Seenath, Wilson, and Miller Citation2016, Mathur and Udani Citation2015; Sun, Hua et al. Citation2015). Considering the literature, utilization of GIS in marine fields has enabled the capability of storage, manipulation, and visualization of maritime systems oriented to tracking, safe navigation, monitoring, traffic of the transportation, and the security (Claramunt et al. Citation2007).
The authors believe that one of the most noticeable gaps among tide prediction studies is lack of a seamless framework. This is due to the fact that most of the related works consider pointwise observations (such as NOAA tide serviceFootnote1) which lead to pointwise tide prediction information. The application tools also concentrate on point-based programme development in specific points-of-interest such as anchorage areas and ports (Najibi, Abedini, and Sheibani Citation2013). For example, Iranian National Cartographic Center (NCCFootnote2) has developed an online system which offer point-based tide prediction information to users. However, lack of seamless prediction can be felt in different disciplines. An overall preview of the available researches and developed software such as WXtideFootnote3 and T-Tide (Pawlowicz, Beardsley, and Lentz Citation2002), also, demonstrates the lack of continuous tide prediction that includes near-shore and offshore areas.
The present study investigates the capability of a GIS-integrated design for the pupose of tide prediction in a manner that covers the aforementioned shortcomings. The designed GIS-based components store and retrieve data in a unique database. The main objective is to simplify the access of the tidal components and parameters in a unique data storage and data retrieval system in order to continuously predict tide at any time and position within the Persian Gulf with a reliable accuracy and precision.
The provided framework is not limited by the near-shore boundaries, and supports both inshore and offshore tide prediction. As with most of the previous studies, the tide prediction is addresses based on astronomical effects, and meteorological parameters are not included in the calculations. The accuracy and precision of tide prediction is one of the main focuses in the study. Choosing simplified harmony method, which requires minimal constituents as inputs, the achieved precision is in the order of 1–2 dm which suffices for many applications.
The paper is organized as follows. Section 2 introduces the tide prediction methodology upon which our framework is based. Section 3 discusses in detail the proposed Seamless Tide Prediction (STP) approach and its implementation. Section 4 continues with evaluation and verification of the obtained results, and finally Section 5 presents the conclusions and remarks.
2. Methodology
This study uses SHM to calculate a series of mathematical terms corresponding to the harmonic constituents by which tidal prediction at a specific location is possible. The predictions at successive times are finally put together in order to model a time series. The process also provides times of high and low water events.
2.1. Harmonic method
The HM (originally developed by Doodson (Citation1921)) effectively investigates tide series as a set of cosine functions containing amplitudes and phases with respect to astronomical potential gravity (Admiralty Citation2015). A more thoroughly discussed investigation by Schureman (Citation1958) represents a better understanding of a spectrum of harmonics and middle parameters. Successive equations are summarized and an easy-to-follow procedure of HM for tide prediction is configured by researches that followed programming approaches rather than mechanical tools of tide prediction (Boon and Kiley Citation1978; Foreman Citation1979). According to Schureman (Citation1958), Godin (Citation1972), Boon and Kiley (Citation1978), and Foreman (Citation1979), the HM can be summarized as represented in Equation (1).
where
is the mean tide level with respect to the predefined vertical datum.
is equal to mean amplitude of ith constituent during a lunar node regression (18.6 years).
is an annual nodal factor to reduce mean amplitude
to the required amplitude for the prediction year in question.
is the angular speed corresponding to ith constituent.
is the local equilibrium phase argument of the ith constituent for the prediction year in question (from the astronomic event to t = 0).
is the phase lag from the astronomic event to the maximum amplitude of the corresponding constituent.
If the heights of the predicted time series are meant to be above the mean sea level (MSL), would be set to zero, but if the height datum is Chart Datum (CD) or any other datum rather than MSL, the parameter should be initialized with the appropriate value. In other words,
is the discrepancy between the model datum and the mean level. Choosing the appropriate datum is arbitrary and may change depending on the application of the prediction; however, it is common to use CD as the prediction reference plane because hydrographic soundings for international waters are usually represented above CD.
Multiplication of will result in the expected amplitude of ith constituent in the year of prediction. The conversion factor
, depends on the longitude of the node of the moon within an 18.6-year lunar cycle. The nodal factor varies from one year to the next, and also within the same year. In practice, the annual value of
is set to its median value throughout the year in question.
can be calculated using equations and astronomical parameters in .
Table 1. Nodal corrections of four main harmonic constituents (Meeus 1982, Doescher 1992).
is the equilibrium phase lag corresponding to ith constituent. The equilibrium phase of a constituent is the phase of an imaginary sine curve representing the so-called equilibrium tide in the absence of friction or other factors (Boon and Kiley Citation1978).
is the sentence of argument that changes uniformly, while
is the sentence of argument that changes gradually due to lunar node variation.
is the value of
at the initial time (i.e.
). The value of
can be calculated using equations and astronomical parameters in .
The value of varies from each constituent to another, and also changes for every initial epoch, and discrete longitude of the location that prediction is to be made. For other locations with different longitudes and time zones, the value of the quantity can be modified using Equation (2).
where
is the west longitude of the time meridian at the station in question.
is the west longitude of the station in which prediction is required to be made.
is a conditional function, as defined in Equation (3).
The diurnal, semidiurnal, or long-period status of the constituents is specified by Schureman (Citation1958).
Demonstrated in is the difference of phase lag and local equilibrium phase argument which is annotated as for each constituent.
Figure 1. Harmonic model arguments.
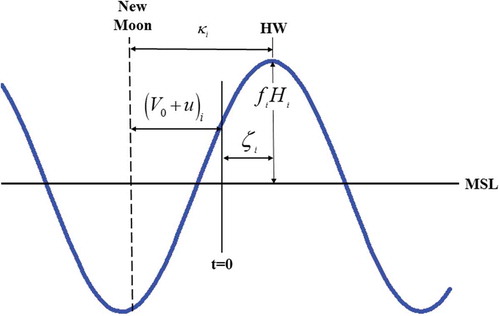
To simplify Equation (1), arguments can be aggregated in as illustrated in Equation (5). So, the parameters inside cosine function in Equation (1) can be rewritten as shown in Equation . Considering Equation (7), one can rearrange Equation (1) as Equation (8).
By differentiating Equation (8), high waters (HW) and low waters (LW) can be derived as given in Equation (9).
3. Implementation
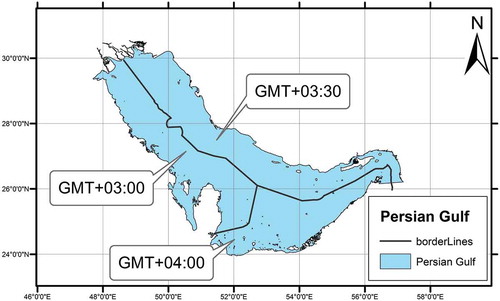
As shown in , in order to implement a seamless-continuous tide prediction framework, four main constituent charts, , known as co-tidal charts, are used. The co-tidal charts in this study are provided by Admiralty maps. From now on, we denote the proposed framework as STP for short. The amplitude charts which are offered by Admiralty agency require no preprocessing and can be used directly as inputs of the algorithm. Conversely, phase charts demand some considerations. As shown in , the Persian Gulf coastal states, which are separated by conventional marine borders, have various local times. Each local time has a unique difference with the Greenwich Mean Time (GMT). So, the first step to integrate phase charts is unifying the prediction times. Although charts are provided in UTC+04:00, the present study uses UTC+03:30 which is the local time of Iran.
Figure 2. GIS-based seamless tide prediction framework.
Figure 3. Local time differences of Persian Gulf states with respect to GMT.
A primary data collection protocol is undertaken in order to ensure the quality (such as precision and reliability) of the collected data. As mentioned above, the Admiralty’s phase charts preprocessing, islands’ exclusion, and temporal interoperability of the data among different countries of the Persian Gulf are performed initially. Moreover, we have used the most recent charts published by the Admiralty. The purpose of the data collection is to construct a continuous constituent database for the STP. The samples here can be considered as co-tidal contours extracted from charts. One potential challenge is whether the data are reliable with an acceptable confidence interval, of which the solution is the comparison of the sample data with the real tide observations. This solution is conducted in Section 4 of the present study.
In order to derive the appropriate in each location, Indian Spring Low Water formula is used (Equation (10)) which reduces the predictions to CD (Doodson and Warburg Citation1941).
Another important consideration is Persian Gulf’s islands, demonstrated in . Naturally, there is no tide inside the islands. So, the internal parts of the islands must be excluded from the STP system. In fact, if the user selects an island for tide prediction, the programme must be able to recognize the exclusions, and warn the users about invalid area selection. This point is considered in the GIS-based seamless programme for Persian Gulf tide prediction, implemented in the present study.
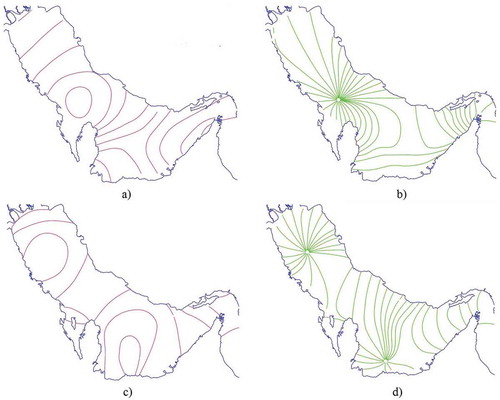
In digitizing process, co-phase and co-range curves of every constitute are drawn in a CAD programme with their values assigned. The third dimension, commonly known as elevation in CAD environment, is borrowed from the annotated amounts in hard copy charts. Besides, the boundary of each island is extracted as a side-product. illustrates samples of the digitized charts for S2 and . Automatic and semi-automatic digitizing tools available in some software (e.g ESRI ArcScan plugin) could help to improve the efficiency of this operation.
Figure 4. Digitized co-tidal charts corresponding to K1 and S2 in Persian Gulf. (a) K1 amplitude charts; (b) K1 phase charts; (c) S2 amplitude charts; (d) S2 phase charts.
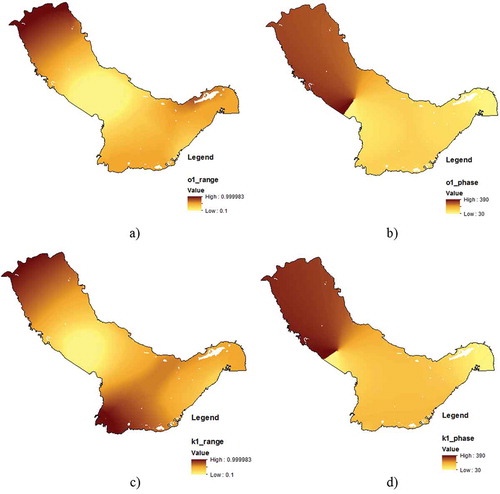
Using the digitized amplitude and phase charts, we have built triangular irregular networks (TINs) to store interpolated geo-referenced values. TIN could be used as a data structure in GIS in order to represent a surface morphology (e.g. land topography and sea bed). The initial points form the nodes of the triangles, and the edges of these triangles are the direct lines that connect the nodes, altogether forming a triangular network. We must create a TIN from each tidal constituent in order to have ubiquitous numbers corresponding to each position’s tidal characteristics within the Persian Gulf area. We have used Delaunay algorithm (Lee and Schachter Citation1980), one of the customary methods for triangulation and TIN generation in GIS, to build our TINs. Demonstrated in are samples of generated TINs for the eight main constitutes, including all amplitude and phase charts. Herein, the vertices of the generated triangular network are derived from the co-tidal lines. In the next step, the TINs, which are the main parts of the designed database, are converted to rasters. The resulted rasters are considered as inputs of tide prediction algorithm within the STP.
Figure 5. Triangular irregular network (TIN) of co-tidal charts of constituents K1 and O1 in Persian Gulf. (a) O1 co-range TIN in Persian Gulf; (b) O1 co-phase TIN in Persian Gulf; (c) K1 co-range TIN in Persian Gulf; (d) K1 co-phase TIN in Persian Gulf.
The STP framework proposed in this study consists of two main graphical user interfaces (GUIs) which are developed in MATLAB programming language. In the first GUI, user can click on the desired spot in which tide prediction is to be made. The primary GUI shows a map of the Persian Gulf within a latitude/longitude based coordinate system. The real-time position of the curser is also available on top of the map. The other GUI arises when the user clicks on the spot in question. Some considerations need to be taken into account in the secondary interface. User must specify the date, duration of the prediction, time interval between two successive predictions, and local or universal time definition (time reference); the programme calculates the predicted values, and visualizes them as an embedded continuous plot ().
Figure 6. Implemented graphical user interface (GUI) for tide prediction in Persian Gulf.
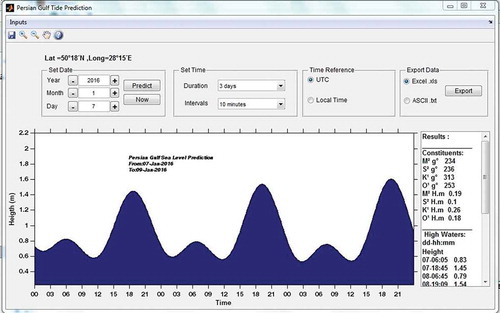
When the predictions are made, the results, including tidal constituents’ amplitudes and phases, times and heights of HW and LW will be represented in the GUI. Besides, it is possible to export prediction results in ASCII or Excel format. The overall procedure of the implementation is depicted in .
In our implementation, we assume that the Admiralty charts are acceptable and require no edition. Another working assumption of the prediction is that the meteorological parameters such as wind and pressure have no significant effect on the water level and can acceptably be ignored and excluded from the modelling. So, the effective parameters in the prediction are time and astronomical constituents of the location in question. One more premise is that the primary data are available and can be stored, retrieved, and visualized in a integrated GIS environment. As discussed earlier, this kind of prediction satisfies the requirements of a variety of applications such as safe navigation, fishing, and hydrodynamic modelling, while in the applications which need more precise tide, such as sediment estimation or dredging, this prediction cannot be included in the calculations and practically direct observations must be measured.
The only condition for the applicability of our framework elsewhere in the world is the availability of the continuous constituents as input data () in the location in which tide is required. These constituents are calculated and published by large institutes such as Admiralty for most parts of the international waters worldwide. If this data is missed in an area or it demands some improvement and data correction, the constituents be calculated using analysis of observed data in a hydrodynamic modelling by software such as MIKE. So, almost in any place of the ocean, the developed framework is applicable.
4. Evaluation and verification
In order to evaluate the proposed STP framework in the Persian Gulf, three main approaches are considered, including
comparison of constituents | |||||
comparison of STPs with other predictions | |||||
comparison of predictions with empirical observations | |||||
Within the following sections, the results of each evaluation method are discussed, respectively.
4.1. Comparison of constituents
In the first step of evaluation procedure, principal constituents of the points of interest, published by Admiralty (Citation2015), are extracted. These parameters include . The constituents are presented by Admiralty tide tables (ATT,Vol 3, part III) for some islands and ports of the Iran, such as Khowre-e Musa Bar, Jazireh ye Khark, Jazireh-ye-Lavan, Bandar-e Lengeh, Basa’idu, Jazirey-ye Hengam, and Jazireye Sirri. On the other hand, we have extracted corresponding constituents for the same locations using the proposed framework in order to compare it with the published values. illustrates the extracted constituents from both Amiralty tide tables and STP database.
Table 2. Constituents’ phases and amplitudes extracted from Admiralty book and database of the implemented programme.
Generally, statistical analysis of phase differences and amplitude differences is performed based on the standard deviation, as shown in Equation (11). Standard deviation, annotated by σ, illustrates the amount of dispersion of the data set. Hence, the closer the standard deviation gets to zero, the more concentrated the data set is. In case of normal distribution, 68.2% of data values are within 1 standard deviation of the mean, and 95% are within 1.78 standard deviation. As shown in Equation (12), the resulted standard deviation for amplitude and phase differences is about 3 cm and 5 s, respectively. Both values fall within an acceptable level of uncertainty, guaranteeing the reliability of the proposed structure.
4.2. Comparison of predictions
The purpose of the second evaluation is the comparison of two different sets of predicted tides which are the outputs of two different prediction systems. For this purpose, CD is considered to compare the results. NCC hydrographic department web page offers pointwise prediction in some Iranian ports and islands in Persian Gulf. The information is provided in half-hourly intervals. We have extracted tide prediction results for three spots on the Persian Gulf in 1 April 1 2016, and compared them graphically and numerically to . Visual comparison of the two prediction diagrams indicates a promising similarity. Numerical comparisons of the results for similar duration and interval (1 day and half-hourly) clarify that with the significance level of 95%, the maximum discrepancy between predicted elevations of the two systems is less than 21 cm (Equation (13)).
4.3. Comparison of predictions with empirical observations
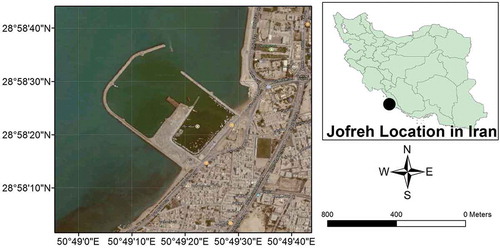
The purpose of this part of the evaluation is to compare predictions made by the proposed STP framework and the direct observations by an RBR tide gauge in one of the Persian Gulf’s ports. In order to do so, we use Jofreh Port in Bushehr province with the coordinates that is shown in .
Figure 7. Location of the Jofreh port near Bandar Bushehr, Persian Gulf, Iran (Google maps).
The observations at Jofreh Port (provided in appendix, Table S1) have been made in 10-min intervals and on 8 April 2015. So, we have exported the predictions using the proposed software within the same time intervals and on the same date. Shown in are observations and predictions. Using Equation (11), the corresponding differences have been calculated, and the consequent standard deviation equals 0.084 m (Equation (14)).
Figure 8. Comparison of tide observations and tide prediction results in Jofreh port.
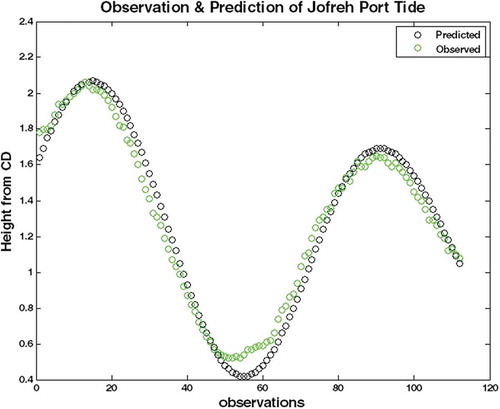
This shows that with the significance level of 95%, the maximum discrepancy between direct observations and predictions is less than 15 cm.
Table 3. Graphical comparison of the Tide prediction results made by the implemented programme in this study and the NCC web page.
According to the evaluations, Equations (12)– (14), the proposed algorithm shows promising results, and the reliability of seamless tidal database is proven. Loosely speaking, with the reliability of 95%, the difference between the STP results and the true value of tide level is about 20 cm. This amount of discrepancy is suitable for maritime affairs such as fishing and navigation.
5. Summary, conclusion, and remarks
The present study proposes a novel framework for STP within international waters. It mainly concentrates on a GIS-based system capable of more convenient storage and retrieval of the co-tidal charts in order to provide users with a tide prediction not only for ports and islands but also for every offshore location. With emphasis on the generality of the proposed framework, this research uses the Persian Gulf as the study area.
STP improves the quality of navigation in offshore regions. Moreover, the tide information is essential in hydrography, land suitability analysis (for marine structure establishment), hydrodynamic modelling, swimming condition evaluation, and even fishing. So, the proposed framework is useful for all the above-mentioned applications.
The presented GIS-based framework makes STP possible for every location of the Persian Gulf. Evaluations demonstrate that the predicted values are reliable because, with the significance level of 95%, the maximum discrepancy between predicted values and direct observations falls within an acceptable range. Such an accuracy satisfies the requirements of a variety of marine applications.
As justified in the previous sections, the developed model can be used for every location that the continuous constituents are available. So, for further studies, we are working on adding Oman Sea to the STP framework. In this process, we will also use the integrated co-tidal charts which are derived based on the available hydrodynamic models for Oman Sea. Moreover, intentions are to add tidal information collected from vital points throughout the ports and islands of Persian Gulf as another input to our framework. Integrating such a precise data set with the co-tidal charts, we are looking forward to see promising advances regarding the reliability of our predictions.
Disclosure statement
No potential conflict of interest was reported by the authors.
Supplementary materials
Supplemental data for this article can be accessed here.
Notes
References
- Admiralty. 2015. NP203 Admiralty Tide Tables (ATT) Volume 3, Indian Ocean (Including Tidal Stream Tables). 2015 ed. UK: Admiralty charts and Publications.
- Boon, J., and K. P. Kiley. 1978. “Harmonic Analysis and Tidal Prediction by the Method of Least Squares.” Special Report 186: 49.
- Claramunt, C., T. Devogele, S. Fournier, V. Noyon, M. Petit, and C. Ray. 2007. “Maritime GIS: From Monitoring to Simulation Systems.” In Information Fusion and Geographic Information Systems, 34–44. Berlin, Heidelberg: Springer.
- Doodson, A. T. 1921. “The Harmonic Development of the Tide-Generating Potential.” Proceedings of the Royal Society of London. Series A, Containing Papers of a Mathematical and Physical Character, The Royal Society, London, December 1, 305–329.
- Doodson, A. T., and H. D. Warburg. 1941. Admiralty Manual of Tides. London: HM Stationery Office.
- Emery, K. O., and D. G. Aubrey. 2012. Sea Levels, Land Levels, and Tide Gauges. New York: Springer Science & Business Media.
- Foreman, M. G. G. 1979. Manual for Tidal Heights Analysis and Prediction. Patricia Bay: Institute of Ocean Sciences.
- George, K., and B. Simon. 2015. “The Species Concordance Method of Tide Prediction in Estuaries.” The International Hydrographic Review 61 (1): 121–145.
- Godin, G. 1972. The Analysis of Tides. Toronto, ON: University of Toronto Press.
- Han, S.-C., C. Jekeli, and C. K. Shum. 2004. “Time-Variable Aliasing Effects of Ocean Tides, Atmosphere, and Continental Water Mass on Monthly Mean GRACE Gravity Field.” Journal of Geophysical Research: Solid Earth 109 (B4). doi:10.1029/2003JB002501.
- Han, S.-C., C. K. Shum, and K. Matsumoto. 2005. “GRACE Observations of M2 and S2 Ocean Tides Underneath the Filchner‐Ronne and Larsen Ice Shelves, Antarctica.” Geophysical Research Letters 32 (20). doi:10.1029/2005GL024296.
- Iz, H. B. 2006. “How Do Unmodeled Systematic Mean Sea Level Variations Affect Long-Term Sea Level Trend Estimates from Tide Gauge Data?” Journal of Geodesy 80 (1): 40–46. doi:10.1007/s00190-006-0028-x.
- Iz, H. B., and C. Shum. 2000. “Mean Sea Level Variation in the South China Sea from Four Decades of Tidal Records in Hong Kong.” Marine Geodesy 23 (4): 221–233. doi:10.1080/01490410050210481.
- Le Provost, C., F. Lyard, J. M. Molines, M. L. Genco, and F. Rabilloud. 1998. “A Hydrodynamic Ocean Tide Model Improved by Assimilating a Satellite Altimeter-Derived Data Set.” Journal of Geophysical Research: Oceans 103 (C3): 5513–5529. doi:10.1029/97JC01733.
- Lee, D. T., and B. J. Schachter. 1980. “Two Algorithms for Constructing a Delaunay Triangulation.” International Journal of Computer & Information Sciences 9 (3): 219–242. doi:10.1007/BF00977785.
- Lee, T.-L. 2004. “Back-Propagation Neural Network for Long-Term Tidal Predictions.” Ocean Engineering 31 (2): 225–238. doi:10.1016/S0029-8018(03)00115-X.
- Liu, H.-P., E. D. Sembera, R. E. Westerlund, J. B. Fletcher, P. Reasenberg, and D. C. Agnew. 1985. “Tidal Variation of Seismic Travel Times in a Massachusetts Granite Quarry.” Geophysical Research Letters 12 (5): 243–246. doi:10.1029/GL012i005p00243.
- Lyard, F., F. Lefevre, T. Letellier, and O. Francis. 2006. “Modelling the Global Ocean Tides: Modern Insights from FES2004.” Ocean Dynamics 56 (5–6): 394–415. doi:10.1007/s10236-006-0086-x.
- Mathur, D. K., and P. M. Udani. 2015. ”Tsunami Detection & Assessment Using Remote Sensing and GIS.“ International Journal of Engineering Research and General Science 3 (6): November–December.
- Matsumoto, K., T. Takanezawa, and M. Ooe. 2000. “Ocean Tide Models Developed by Assimilating TOPEX/POSEIDON Altimeter Data into Hydrodynamical Model: A Global Model and a Regional Model around Japan.” Journal of Oceanography 56 (5): 567–581. doi:10.1023/A:1011157212596.
- Matte, P., D. A. Jay, and E. D. Zaron. 2013. “Adaptation of Classical Tidal Harmonic Analysis to Nonstationary Tides, with Application to River Tides.” Journal of Atmospheric and Oceanic Technology 30 (3): 569–589. doi:10.1175/JTECH-D-12-00016.1.
- Najibi, N., A. Abedini, and R. A. Sheibani. 2013. “Harmonic Decomposition Tidal Analysis and Prediction Based on Astronomical Arguments and Nodal Corrections in Persian Gulf, Iran.” Research Journal of Environmental and Earth Sciences 5 (7): 381–392.
- Pawlowicz, R., B. Beardsley, and S. Lentz. 2002. “Classical Tidal Harmonic Analysis Including Error Estimates in MATLAB Using T_TIDE.” Computers & Geosciences 28 (8): 929–937. doi:10.1016/S0098-3004(02)00013-4.
- Schureman, P. 1958. Manual of Harmonic Analysis and Prediction of Tides. Washington, DC: US Government Printing Office.
- Seenath, A., M. Wilson, and K. Miller. 2016. “Hydrodynamic versus GIS Modelling for Coastal Flood Vulnerability Assessment: Which Is Better for Guiding Coastal Management?” Ocean & Coastal Management 120: 99–109. doi:10.1016/j.ocecoaman.2015.11.019.
- Shi, Z., X. Jiang, S. W. Yang, X. C. Jin, and J. M. Cheng. 2010. “The Spatial and Temporal Variation Characteristics and Potential Ecological Risk Assessment of Heavy Metal Pollution in Surface Sediments of Chaohu.” Journal of Agro-Environment Science 29 (5): 948–954.
- Shum, C., P. L. Woodworth, O. B. Andersen, G. D. Egbert, O. Francis, C. King, S. M. Klosk, et al. 1997. “Accuracy Assessment of Recent Ocean Tide Models.” Journal of Geophysical Research: Oceans 102 (C11): 25173–25194. doi:10.1029/97JC00445
- Sun, F., L. Hua, H. Li, Y. Wang, and Y. Chen. 2015. “Detecting and Analysis of Coast Changes of Xiamen Island by RS & GIS.” Spatial Data Mining and Geographical Knowledge Services (ICSDM), 2015 2nd IEEE International Conference On, IEEE, Fuzhou, China. doi:10.1109/ICSDM.2015.7298053
- Vaníček, P. 1971. “Further Development and Properties of the Spectral Analysis by Least-Squares.” Astrophysics and Space Science 12 (1): 10–33. doi:10.1007/BF00656134.
- Whitcombe, L. 1996. “A FORTRAN Program to Calculate Tidal Heights Using the Simplified Harmonic Method of Tidal Prediction.” Computers & Geosciences 22 (7): 817–821. doi:10.1016/0098-3004(95)00132-8.
- Wyatt, F., G. Cabaniss, and D. C. Agnew. 1982. “A Comparison of Tiltmeters at Tidal Frequencies.” Geophysical Research Letters 9 (7): 743–746. doi:10.1029/GL009i007p00743.
- Yen, P.-H., C.-D. Jan, Y.-P. Lee, and H.-F. Lee. 1996. “Application of Kalman Filter to Short-Term Tide Level Prediction.” Journal of Waterway, Port, Coastal, and Ocean Engineering 122 (5): 226–231. doi:10.1061/(ASCE)0733-950X(1996)122:5(226).