
ABSTRACT
In this study multi-hazard risk assessment is carried out in Arithang ward, one of the major wards within Gangtok Municipal Corporation, with the objectives of (a) landslide and earthquake hazard mapping of Gangtok city with analytical hierarchy process (b) vulnerability mapping in Arithang ward and (c) semiquantitative and semiqualitative risk analysis. Landslide hazard zonation (LHZ) depicts that very high and high hazard zone occupies 6% and 17% of the Gangtok city whereas 60% and 18% of area falls under medium and low hazard category respectively. With respect to seismic hazard susceptibility 13% and 22% of area falls under very high and high category respectively. Semiquantitative risk analysis reveals that majority of the residential buildings are concentrated in low earthquake and landslide hazard zone followed by 39% and 35% within medium class. Only 0.6% and 7% of residential buildings are found in high earthquake and landslide hazard zones. Bamboo and wood made buildings are found to cluster within very high class of landslide hazard. About 61% of multistoried buildings are placed within low zone of LHZ. Risk analysis reveals that buildings at the eastern and western part of Arithang ward come under high risk with respect to earthquake and landslide.
Introduction
Natural hazard is responsible for injuring/damaging population, infrastructure, lifelines and agricultural land. According to the multi-hazard map of the United Nations Development Programme (UNDP) (Map no 03), Sikkim state is found under very high zone with respect to earthquake and high zone with regard to landslides. Due to indiscriminate urbanization and construction on the slope of the hill become vulnerable to mankind. The Sikkim state suffers from five major kinds of natural disasters, namely earthquake, landslide, windstorm accompanied by heavy rainfall, flash floods and hailstorm. To reduce the impact of natural/anthropogenic hazard, it is important to execute multi-hazard risk analysis. Risk is the function of the hazard, vulnerability and the cost of the vulnerable elements. The probability of occurrence of the potentially damaging phenomenon within a specified period of time at given area is known as hazard (Varnes Citation1984). One of the spatial components of hazard analysis is susceptibility, which is assessed worldwide (Peng et al. Citation2015). Vulnerability analysis depends on intensity of the hazard and characteristics of the element at risk. Various researchers have identified different approaches of vulnerability assessment for hazard event (Li et al. Citation2010; Das et al. Citation2011; Papathoma-Kohle et al. Citation2011; Kappes, Papathoma-Kohle, and Keiler Citation2012). Quantitative vulnerability study at small scale is very much challenging in order to give accurate assessment for vulnerability measurement. Over the years, various techniques and models are developed for multi-hazard risk assessment throughout the world (Van Westen et al. Citation2002; Castellanos Abella and Van Westen Citation2007; Carpignano et al. Citation2009; Lari, Frattini, and Crosta Citation2009; Johnson, Depietri, and Breil Citation2016). Numerous software have been used to calculate multi-hazard risk like RISK-GIS (Granger et al. Citation1999), HAZUS (Schneider and Schauer Citation2006), CAPRA (Cardona et al. Citation2010), RiskScape (Schmidt et al. Citation2011) and MATRIX (Garcia-Garcia-Aristizabal, Marzocchi, and Ruocco Citation2013). Moreover, there are not so much research studies on hazard and risk analysis at small scale in developing countries like India. In East Sikkim, most of the research studies are restricted to susceptibility and hazard analysis (Bhasin et al. Citation2002; Anbarasu et al. Citation2010; Rawat et al. Citation2011; Rawat et al. Citation2012). There is no quantified multi-hazard risk assessment in the study area. Here, the vulnerability is mostly related to the buildings and structures at risk as well as how these buildings and structures were damaged by hazards, due to physical forces exerted by ground motion and water.
In ordered to address the above problems, the present study aims to develop multi-hazard risk map for Arithang ward of Gangtok city. At first, hazard map of whole Gangtok city is prepared with analytical hierarchy process (AHP) and next elements at risk are quantified and overall vulnerability is calculated for Arithang ward. Finally, a multi-hazard risk map is prepared by integrating the quantitative maps from property to life. The present study is intended to bridge the gap in the information relating to quantified vulnerability assessment by door-to-door survey including building footprint, construction material, floor and building use data, etc.
Study area
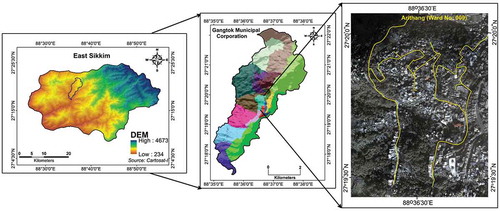
Gangtok is the municipal corporation city of East District in Sikkim state which covers 19.38 sq/km of the area. It consists of 17 wards (from 2015) () with a large population of about 1,00,286 (2011 census). It is located at an altitude of 5800 feet (1800 m) and lies between 27.3325°N latitude and 88.6140°E longitude. The eastern and western part of the city is flanked by streams, namely Rorochu and Ranikhola. The Census data of 2001 and 2011 show growth rate of 242%. However, it also observed that in the Sikkim state, urbanization is mostly Gangtok centric which reinforces the imbalanced urban structure of the city. The areas within Gangtok Municipal Corporation (GMC) show maximum population density in Mahatma Gandhi Marg (M.G.Marg), Deorali, Arithang and Diesel Power House ward (http://www.sikkimudhd.org/gmc.pdf). Ward no. 009 covers 0.353 km2 area with 9333 population which makes it suburb of Gangtok city (). Geologically, Arithang ward consists of lingtse granite gneiss, garnet mica schist with phyllite and some portion of coarse grained garnet mica schist. The commercial building is mostly found along National Highway 31A. This National Highway and Indira Bypass road demarcate the eastern and western ward boundary of Arithang. Mostly, buildings found in this ward are of reinforced cement concrete (RCC) type, but some slum buildings are of semi-concrete type. The total number of primary earners in this ward is 923, among this 612 and 63 are male and female earners, respectively. The study area for hazard and risk analysis is presented in .
Table 1. Ward-wise description of Gangtok city (highlighted portion shows the representative site for risk analysis).
Figure 1. Location map of the study area.
Materials and methods
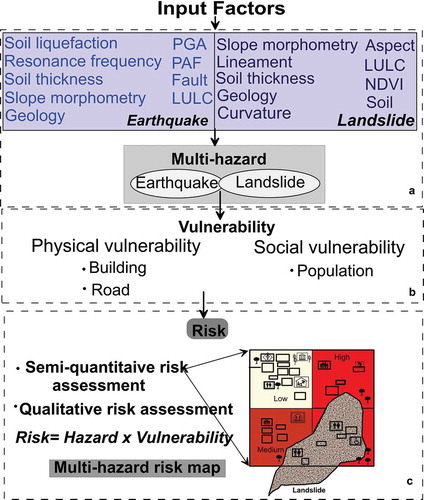
Entire research work was executed in three steps: (i) delineation of seismic and landslide hazard zone, (ii) calculation of vulnerability and (iii) multi-hazard risk assessment ().
Figure 2. Methodology used to carry out multi-hazard risk analysis (a) section represents the hazard analysis, (b) represents the vulnerability assessment, (c) shows the future approach for multi-hazard risk analysis.
Delineation of seismic and landslide hazard zone
In this research, AHP is used to demarcate seismic and landslide hazard zone. This process uses the hierarchical structure through pair-wise comparison based on judgement between two particular hazard elements and assigns weight along with consistency ratio (CR) (Yalcin Citation2008). The basic principles of AHP are (a) decomposition, (b) comparative judgement and (c) assigning normalized weight (Malczewski Citation1999). In the present study, AHP is used to calculate normalized weight for slope, aspect, curvature, geology, lineament, soil, soil thickness, land use/land cover, normalized differential index (NDVI) and water regime, and finally, the landslide hazard zonation (LHZ) is developed. Regarding earthquake governing factors, geology, fault, slope morphometry, soil thickness, land use/land cover, peak ground acceleration (PGA), peak amplification frequency (PAF), resonance frequency and soil liquefaction are considered in this analysis. All the input factors are prepared and modified in ArcGIS software. This AHP technique is used by many scientists in various geo-hazard studies (Moustafa Citation2015; Baghbani, Gholami, and Barani Citation2016). In this process, a matrix is developed on the basis of judgement between two hazard factors/criterion. In pair-wise comparison matrix (A), every factor/criterion (n) shows the significance of the factors to the other, and based on to Saaty’s numerical scale from 1 to 9 (Supplementary Table 1), relative importance is measured between two factors (Saaty Citation1990, Citation1998). Let ‘n’ elements to be compared, w1 ….. wn indicates the relative weight of wi with respect to wj by aij and form a square matrix A = (aij) of order n with the constraints that aij = 1/aji, for i ≠ j, and aji = 1, all i. The structure of matrix is are as follows (Equation (1)):
The pivotal step of AHP is to derive eigenvector/priority vector for each pair-wise comparison matrix (A). All the columns of ‘A’ are proportional to one another and consequently the weight vector is equal to any normalized column of ‘A’ if each entry aij of the matrix (A) exactly follows Equation (3). In linear algebra principle, eigenvector is known as Perron–Frobenius eigenvector, derived from homonymic theorem. Eigenvector (ω) is calculated by dividing the nth product of first row and sum of nth product. Multiplying the entries in each row of matrix and then nth root of that product gives a very good approximation to correct answer. The sum of nth root is used to normalize the eigenvector (ω) element by adding 1. The consistency of a matrix can be checked by calculating the principal eigen value (λmax), determined with the following formula (Equation (2)):
where λmax is the maximum eigen value determined from the priority matrix and n is the number of criterion of the comparison matrix. λmax is determined by multiplying on the right of the matrix of judgements by the eigenvector. This gives the λmax value, and if the mean of these values is less than the number of criterion/element (n), there has been an error in the calculation.
To calculate the satisfactory consistency level of a matrix, CR is determined by dividing the CI for the set of judgments by corresponding value of random matrix (RI). CR is the rescaled version of CI (Equation (3)).
RI is the established index by Saaty, where upper row shows the random matrix, and the lower matrix indicates corresponding index of consistency (Supplementary Table 2). CR less than 0.1 means weights given to factors are acceptable and if CR is >0.1 it means there is inconsistency and requires revision in scale of preference (Saaty Citation2008). Each assigned maps are prepared and integrated with weighted sum matrix process (Equation (4)). In this present study, we have used past landslide and earthquake data for the validation of the hazard potential zone models through success and prediction rate curve.
where Wj is the weight value of causative factor j, wij is the weight value of class i in causative factor j and n is the number of causative factors. The output map is reclassified into four classes using natural breaks/jenks. Finally, the landslide hazard map is validated with success and prediction rate curve and map comparison process is used to measure prediction variability of earthquake hazard map. AHP is a useful technique to solve the complex multi-attribute decision problems and it is easy to handle qualitative and quantitative data set as well.
Vulnerability (V)
Vulnerability assessment is defined in terms of physical, social and economical aspect. Present work includes elements at risk such as buildings, road and population. Based on the hazard map of the study area, homogeneous area mapping was carried out in one ward for analysis of quantitative vulnerability and risk. Homogeneous area mapping defines the small area in a geographical unit which has similar characteristics of land use among different geographical unit.
Calculating physical vulnerability of building (Vb)
Physical vulnerability is quantified on the basis of impact of hazard event on built-up environment and population. Building footprint map was prepared from high-resolution data, namely Quickbird and Google Earth air photography. About 497 numbers of buildings were digitized within the Arithang ward.
Identification and preparation of vulnerability factor
The factors that influence the building vulnerability to geo-hazard are identified through field survey. The collected data/information have been developed as GIS database. The responsible vulnerability factors for geo-hazard in the study area is building ownership, building use, building material and building floor. Raw scores were assigned to the subclasses of the factor with respect to their prioritization (Voogd Citation1983). By the linear transformation method, raw score is rescaled to common numerical, i.e. 0–1, known as standardization technique. The standardization is formulated by Equation (5).
presents the assignment of weights to the factor on the basis of their relative importance. Finally, the vulnerability of building is calculated by Equation (6) (Papathoma-Kohle et al. Citation2007) ().
Table 2. Standardized score and weights for different building vulnerability factors.
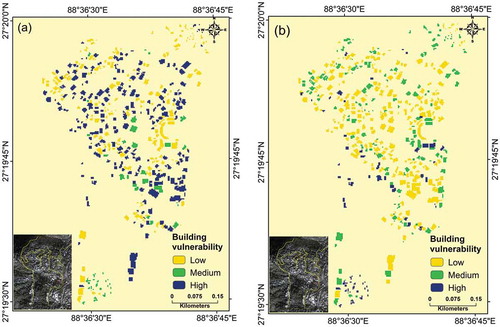
Figure 3. (a) Building vulnerability map for earthquake hazard, (b) building vulnerability map for landslide hazard.
Calculation of physical vulnerability of lifeline (Vl)
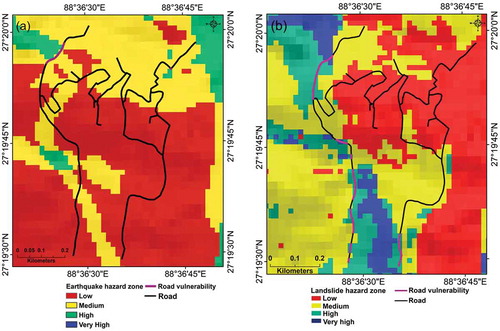
Vulnerability is defined as ‘a degree of loss to an element at risk due to the occurrence of hazard and it is expressed at a scale ranges from 0 to 1’ (Tung Citation2004). Road network is vulnerable to natural hazard, which may cause damage to roads by minor cracks or completely rupturing it. Transport network weakens the slope stability and is an essential factor for vulnerability study. In this research work, road network map is digitized from the thematic map of road network of GMC area (Public Health Engineering Dept, Sikkim) and Google Earth imagery. Two road classes are considered for this analysis, i.e. National Highway and county road. Weights are assigned to the road on the basis of hazard class. Those road sections that are fallen under very high to high hazard class are assigned as 1 and those are under medium to low hazard zone are assigned as 0 ().
Figure 4. Lifeline vulnerability: (a) road vulnerability due to earthquake (b) road vulnerability due to landslide.
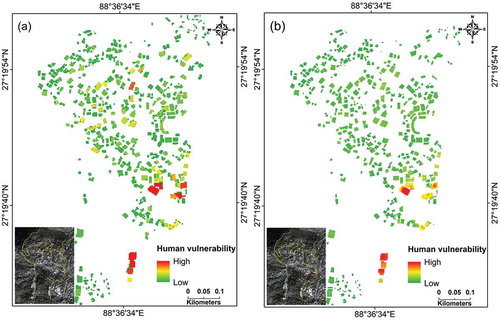
Human vulnerability (Vh)
Human population is the one of the most important parameter for vulnerability measurement as we know that human population will always have to face natural disaster. Arithang ward (ward no. 009) with the population of 8212 makes it fifth most populous ward in Gangtok. Human vulnerability (Vh) is calculated by visualizing the Vb, i.e. multiplying the Vb with the population of each house () (Papathoma-Kohle et al. Citation2007). Here, population data is collected from Census data 2011.
Figure 5. Human vulnerability: (a) for earthquake, (b) for landslide.
Risk (R)
According to Xu et al. (Citation2012), risk is defined as the probability of damage caused by a particular hazard to a specific element (Equation (7)). Risk is the product of the hazard and vulnerability. Risk analysis is made on vector data structure in ArcGIS environment. By combining the risk map of landslide and earthquake hazard, multi-hazard risk analysis has been carried out.
Here, H denotes the hazard and V defines the vulnerability of hazard.
Result and discussion
Hazard analysis (H)
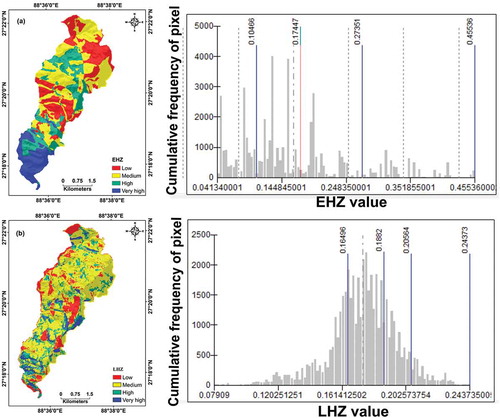
The present study applies the popular heuristic technique, i.e. AHP to carry out the hazard analysis for geo-hazards. and represent the pair-wise matrix of input factor for earthquake and landslide. Among weight of earthquake responsible factors, PGA and PAF shows highest eigen value while slope morphometry and geology shows lowest eigen value (). represents the eigen value of factors among them slope morphometry and geology shows the maximum eigen value in case of landslide hazard. The obtained consistency ratios for earthquake and landslide hazard which are 0.09 and 0.04, respectively, indicate satisfactory result of consistency; therefore, all the factors are taken into weighted sum matrix in ArcGIS environment. The final earthquake and landslide hazard maps are integrated through weighted sum matrix and are shown in , which is reclassified into four hazard classes, namely low, medium, high and very high. Earthquake hazard zonation (EHZ) map () shows that 2.52 and 4.32 km2 area comes under very high and high earthquake potential zone and 12.30 km2 falls under medium to low potential zone. Ranipool, Tadong and south of Tathangchen Syari fall under very high potential zone. Some portion of Daragoan ward also falls under high potential zone. On the other hand, LHZ map () indicates that 6% and 17% of the area fall under very high and high hazard zone, and 60% and 18% of the area fall under medium and low hazard zone. Very high hazard zone is found in Tibet road, Tathangchen Syari, Upper Sichey, and lower portion of Development ward, respectively. Small patches of very high hazard zone are occupied in Daragoan and Tadong ward. Chandmari, Lower and Upper Burtuk wards fall under high susceptible zone area. In the present study, earthquake hazard map is validated with reported earthquake data and landslide hazard map is validated with success and prediction rate curve. In success and prediction rate curve, landslide inventory is categorized into two data sets, i.e. training and testing. Out of the total landslide inventories, 25% and 75% of data are randomly classified into testing and training data (Neuhauser, Damm, and Terhorst Citation2012, Thapa, Gupta, and Reddy Citation2016). The obtained susceptible index values are distributed into cumulative interval value of 1% by dividing it into 100 equal classes. The success rate of the model is 75.11% and prediction rate curve is 68.94%, respectively (Supplementary Figure 1). The reported earthquake epicentres in the vicinity of the very high earthquake hazard zones support the prediction and indicate every possibility of occurrence of future epicentres in this zone (Supplementary Figure 2).
Table 3. Pair-wise comparison matrix of earthquake influencing factors.
Table 4. Pair-wise comparison matrix of landslide influencing factors.
Table 5. Weights, eigenvector values and consistency ratio (CR) of the earthquake hazard derived from pair-wise comparison matrix.
Table 6. Weights, eigenvector values and consistency ratio (CR) of the landslide hazard derived from pair-wise comparison matrix.
Figure 6. Hazard zonation map of (a) earthquake and (b) landslide.
Vulnerability analysis
On the basis of the hazard map of the study area, it is observed that the hazard areas and inhabitant areas coincide with each other. For the homogeneous area mapping, Arithang ward is considered for further analysis. The field survey and element at risk analysis is carried out within Arithang ward (ward no. 009), which is the central ward of GMC and closed to commercial zone. In this ward (ward no. 009), low- to high-rise buildings are found, i.e. slum to commercial buildings (). Major commercial buildings are found near the National Highway 31, passing on the east side of the ward. The building typology is identified are mid-rise structure (five to eight storeys) and mostly buildings are concrete. Apart from concrete structure, buildings made up of bamboo, asbestos and wood type are also found. The single- or two-storied huts are built with wood frame and light metal sheets are used for roofing material supported by wood frame. This kind of building is locally called as ‘Ekra houses’. As the Ekra houses are not strong, they are usually of one to two storied, and in most of the cases, the wooden roofs are replaced with asbestos sheet. Asbestos constructed houses are similar to Ekra houses, but these are much more temporary and light weighted. Mid-rise concrete buildings are built up with concrete and walls without any structural features. Most of the buildings have 230 mm × 230 mm columns with half-brick-thick walls. The roof is generally sloping asbestos roof and the slabs are made up of concrete. Most of the buildings are built without any gap between them. Due to construction on slopes, buildings have irregular column heights and frame is not symmetrical. The high-rise buildings have similar column size as low- and mid-rise buildings have, but they have to load 8–12 floors, which make these highly vulnerable. Majority of the buildings with higher number of floor are closer to the National Highway. Most of the buildings in the ward are privately owned and few buildings are Government-owned. Majority of the privately owned buildings are used for residential and commercial purpose. Few hotels and guest houses are also there. The buildings are not properly planned and are randomly distributed. National Highway 31 passes through the ward. All other roads start from highway and runs into interiors of the ward.
Buildings are one of the most crucial parameter of vulnerability assessment. Behaviour of the buildings under hazard event determines whether the people in the building might be injured or killed. The vulnerability map is classified into three classes: low, medium and high. In case of earthquake and landslide studies (), (b)), we have identified that more than 100 and 41 buildings fall under high vulnerability and the remaining fall under medium and low vulnerable class. The output shows that some road segments are found under high vulnerability class.
Risk assessment
Semi-quantitative method for landslide and earthquake risk assessment
Semi-quantitative method explains risk in terms of risk indices, but these do not reflect the real expected loss, but it rarely indicates the risk. It forms a risk matrix with hazard categories and set of consequence classes. The building distribution in hazard classes is represented in . In the present study, residential buildings are more mostly concentrated in low class of earthquake hazard zonation and 39% of the residential buildings lie within medium class. Only 0.6% of them found in high earthquake hazard zone. Among RCC buildings, 61% and 38% are occupied within low and medium zone of earthquake hazard zonation. Only 1% of RCC building falls under high potential zone. Building materials like asbestos, bamboo and wood, representing 65%, 100% and 72%, respectively, are located in low hazard class and only 35% and 28% of asbestos and wood fall under medium earthquake hazard class. About 65% and 34% of multistorey building are occupied within low and medium EHZ. Results show that maximum buildings are located in low and medium earthquake hazard class, hence the buildings are at low risk from earthquake hazard. From previous records, it is observed that the earthquake epicentres are found in south and west of East Sikkim district. In view of landslide hazard, 10% of the private buildings are occupied within high to very high landslide hazard class. Under the zonation of high to very high class, 16% office building are occupied and about 2% and 7% of residential building are within very high and high hazard zones, respectively. Maximum residential buildings are found in low and medium class with 54% and 35% under earthquake hazard zone. With respect to landslide hazard, maximum number of hotels and guest houses are occupied in low and medium hazard zones. All the industries are found in low hazard class, whereas only 20% of industry fall within high class of hazard. Maximum number of RCC buildings is occupied in low and medium hazard classes of landslide. Moreover, 3% and 1% of RCC buildings are located in high and very high zones. Buildings constructed with bamboo and wood are found to be under very high class. About 60% of multistoried buildings are within low zone of LHZ. Hence, the result predicts that maximum buildings have low threat of risk but 10% of buildings are categorized into high to very hazard class. This kind of risk analysis corroborates to the findings of Althuwaynee and Pradhan. (Citation2016) in terms of land use and population.
Table 7. Buildings likely to be affected for different landslide hazard classes.
Table 8. Details of summary statistics of the risk index maps along with intermediate maps of vulnerability and hazard values.
Qualitative methods of risk assessment
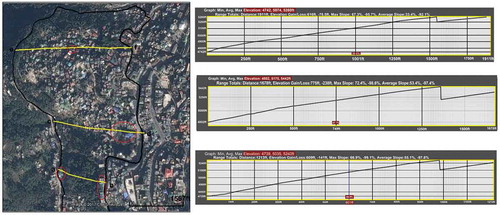
Risk map is produced by using derived information of hazard and vulnerability map of the area. In the present research work, qualitative risk assessment is defined in terms of high, moderate and low risk zone (). Qualitative risk assessment is carried out when the hazard cannot be quantified, i.e. cannot estimate the specific frequency and size of magnitude or when the vulnerability is not quantified. In this study, hazard index map is developed (). The result shows higher risk zone where the spatial intensity of hazard and vulnerability coincide each other. Meanwhile, some roads are identified under high risk as the hazard and vulnerability of the roads are high. Maximum government buildings are characterized as low risk because of vulnerability and hazard value. shows the profile plot of buildings at high risk.
Figure 7. Multi-hazard risk map for Arithang ward (009).
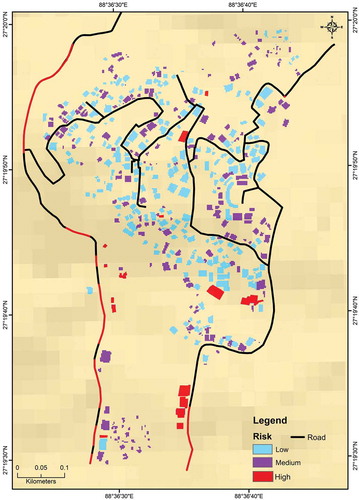
Figure 8. Cross profile plot along the Arithang ward among buildings at high risk.
Conclusion
The main aim of the study is to develop a multi-hazard risk map by geospatial technology. In summary, the research work shows that Arithang ward is significantly exposed to low risk under multi-hazard risk approach. Due to lack of fund, analysis is carried out within one ward which reflects the scenario of other ward. Similar methodology can be applied at local scale to regional scale. The highly populated area is found in low hazard zone. RCC buildings belong to the categories such as school/college, hospital, office and hotels, and other departments are placed in safe zone of risk but some of them are found under high risk zone also. During the 2011 earthquake in Sikkim, Old Secretariat building (Gangtok) and many other RCC buildings were poorly damaged. There is need to develop some techniques and management strategies to save buildings from future disaster. Retrofitting of the building structure is a good strategy to save those buildings which are under high risk zone. Construction of retaining wall at the base of vulnerable slope where the building is constructed may be another kind of structural mitigation. Proper pre-incident training must be given to people and early warning systems should be enforced. Identification of input factors for vulnerability is the major step towards effective measurement of vulnerability. Physical and social vulnerability is the important factor to calculate vulnerability. There is a need to consider these factors, i.e. design of the building, construction cost, building surrounded by wall, window facing slope side or not and damage data for enhancing the physical vulnerability. In social vulnerability, day time/night time population, vulnerable population, income data per household living below and above poverty line and unemployed rate are major parameters for analysis. The research article concluded that multi-hazard risk assessment at smaller scale will lead to effective identification of spatial distribution of principal diverse risk. There is a need to build up risk analysis by developing some techniques of hazard and vulnerability analysis at root level as hazard and vulnerability are the drivers of risk. Study of risk assessment at smaller scale provides more accurate outcome than at larger scale. The outcome of the research provides useful document for future planning and preparedness in the Gangtok city.
Acknowledgment
The authors would like to thank Department of Science and Technology (DST), India for providing the INSPIRE Fellowship (DST/INSPIRE Fellowship/2015/IF150309) to carry out the research work.
Disclosure statement
No potential conflict of interest was reported by the authors.
Supplementary material
Supplemental data for this article can be accessed here.
Additional information
Funding
Related Research Data
References
- Althuwaynee, O. F., and B. Pradhan. 2016. “Semi-Quantitative Landslide Risk Assessment Using GIS-based Exposure Analysis in Kuala Lumpur City.” Geomatics, Natural Hazards and Risk. doi:10.1080/19475705.2016.1255670.
- Anbarasu, K., A. Sengupta, S. Gupta, and S. P. Sharma. 2010. “Mechanism of Activation of the Lanta Khola Landslide in Sikkim Himalayas.” Landslides 7: 135–147. doi:10.1007/s10346-009-0193-0.
- Baghbani, M., E. Gholami., and H. R. R. Barani. 2016. “Seismic Hazard Analysis of Dam Siyaho in South Khorasan Province (Eastern Iran).” Journal of Tethys 4 (3): 180–199. http://jtethys.org/wp-content/uploads/2011/10/Baghbani-et-al-2016.pdf.
- Bhasin, R., E. Grimstad, J. O. Larsen, A. K. Dhawan, R. Singh, S. K. Verma, and K. Venkatachalam. 2002. “Landslide Hazards and Mitigation Measures at Gangtok, Sikkim Himalaya.” Elsevier 64: 351–368.
- Cardona, O. D., M. G. Ordaz, E. Reinoso, L. E. Yamin, and A. H. Barbat. 2010. “Comprehensive Approach for Probabilistic Risk Assessment (CAPRA): International Initiative for Disaster Risk Management Effectiveness.” 14th European Conference on Earthquake Engineering, Ohrid, Macedoniaa, January.
- Carpignano, A., E. Golia, C. Di Mauro, S. Bouchon, and J. Nordvik. 2009. “A Methodological Approach for the Definition of Multi-Risk Maps at Regional Level: First Application.” Journal of Risk Research 12: 513–534.
- Castellanos Abella, E. A., and C. J. Van Westen. 2007. “Generation of a Landslide Risk Index Map for Cuba Using Spatial Multi-Criteria Evaluation.” Landslides 4: 311–325. doi:10.1007/s10346-007-0087-y.
- Das, I., G. Kumar, A. Stein, A. Bagchi, and V. Dadhwal. 2011. “Stochastic Landslide Vulnerability Modeling in Space and Time in a Part of the Northern Himalayas, India.” Environmental Monitoring and Assessment 178 (1): 25–37. doi:10.1007/s10661-010-1668-0.
- Garcia-Aristizabal, A., W. Marzocchi, and A. D. Ruocco. 2013. “Probabilistic Framework for Multi-Hazard Assessment.” Technical Report D3.4, MATRIX Project (New Methodologies for Multi-Hazard and Multi-Risk Assessment Methods for Europe), Grant No. 265138. http://matrix. gpi.kit.edu/Deliverables.php.
- Granger, K., T. Jones, M. Leiba, and G. Scott. 1999. Community Risk in Cairns: A Multi-Hazard Risk Assessment. Canberra: Commonwealth of Australia.
- Johnson, K., Y. Depietri, and M. Breil. 2016. “Multi-Hazard Risk Assessment of Two Hong Kong Districts.” International Journal of Disaster Risk Reduction 19: 311–323. doi:10.1016/j.ijdrr.2016.08.023.
- Kappes, M. S., M. Papathoma-Kohle, and M. Keiler. 2012. “Assessing Physical Vulnerability for Multi-Hazards Using an Indicator-Based Methodology.” Applied Geography 32 (2): 577–590. doi:10.1016/j.apgeog.2011.07.002.
- Lari, S., P. Frattini, and G. B. Crosta. 2009. “Integration of Natural and Technological Risks in Lombardy, Italy.” Natural Hazards Earth System Science 9: 2085–2106. doi:10.5194/nhess-9-2085-2009.
- Li, Z., F. Nadim, H. Huang, M. Uzielli, and S. Lacasse. 2010. “Quantitative Vulnerability Estimation for Scenario-Based Landslide Hazards.” Landslides 7 (2): 125–134. doi:10.1007/s10346-009-0190-3.
- Malczewski, J. 1999. GIS and Multicriteria Decision Analysis, 392. New York: John Wiley & Sons.
- Moustafa, S. S. R. 2015. “Application of the Analytic Hierarchy Process for Evaluating Geo-Hazards in the Greater Cairo Area, Egypt.” Electronic Journal of Geotechnical Engineering 20: 1921–1938. http://www.ejge.com/2015/Ppr2015.0207sb.pdf.
- Neuhauser, B., B. Damm, and B. Terhorst. 2012. “GIS-based Assessment of Landslide Susceptibility on the Base of the Weights-Of-Evidence Model.” Landslides 9: 511–528. doi:10.1007/s10346-011-0305-5.
- Papathoma-Kohle, M., M. Kappes, M. Keiler, and T. Glade. 2011. “Physical Vulnerability Assessment for Alpine Hazards: State of the Art and Future Needs.” Natural Hazards 58 (2): 645–680. doi:10.1007/s11069-010-9632-4.
- Papathoma-Kohle, M., B. Neuhäuser, K. Ratzinger, H. Wenzel, and D. Dominey-Howes. 2007. “Elements at Risk as a Framework for Assessing the Vulnerability of Communities to Landslides.” Natural Hazards Earth System Science 7: 765–779. doi:10.5194/nhess-7-765-2007.
- Peng, L., S. Xu, J. Hou, and J. Peng. 2015. “Quantitative Risk Analysis for Landslides: The Case of the Three Gorges Area, China.” Landslides 12: 943–960. doi:10.1007/s10346-014-0518-5.
- Rawat, M. S., V. Joshi, B. S. Rawat, and K. Kumar. 2011. “Landslide Movement Monitoring Using GPS Technology: A Case Study of Bakthang Landslide, Gangtok, East Sikkim, India”.” Journal of Development Agricultural Economy 3 (5): 194–200.
- Rawat, M. S., B. S. Rawat, V. Joshi, and M. M. Kimothi. 2012. “Statistical Analysis of Landslide in South District, Sikkim, India: Using Remote Sensing and GIS.” IOSR Journal Of Environmental Science, Toxicology And Food Technology 2 (3): 47–61. doi:10.9790/2402-0234761.
- Saaty, T. L. 1990. “How to Make a Decision: The Analytic Hierarchy Process.” European Journal of Operational Research 48 (1): 9–26. doi:10.1016/0377-2217(90)90057-I.
- Saaty, T. L. 1998. What Is the Analytic Hierarchy Process? Mathematical Models for Decision Support. Dordrecht: Springer.
- Saaty, T. L. 2008. “Decision Making with the Analytic Hierarchy Process.” International Journal of Services Sciences 1 (1): 83–98. doi:10.1504/IJSSCI.2008.017590.
- Schmidt, J., I. Matcham, S. Reese, A. King, R. Bell, R. Henderson, G. Smart, J. Cousins, W. Smith, and D. Heron. 2011. “Quantitative Multi-Risk Analysis for Natural Hazards: A Framework for Multi-Risk Modeling.” Natural Hazards 58: 1169–1192. doi:10.1007/s11069-011-9721-z.
- Schneider, P. J., and B. A. Schauer. 2006. “HAZUS-Its Development and Its Future.” Natural Hazards Review 7 (2): 40–44. doi:10.1061/(ASCE)1527-6988(2006)7:2(40).
- Thapa, R., S. Gupta, and D. V. Reddy. 2016. “Application of Geospatial Modeling Technique in Delineation of Fluoride Contamination Zones within Dwarka Basin, Birbhum, India.” Geoscience Frontiers. doi:10.1016/j.gsf.2016.11.006.
- Tung, P. T. 2004. “Road Vulnerability Assessment for Earthquakes: A Case Study of Lalitpur, Kathmandu-Nepal”. PhD thesis, International Institute for Geo-information Science and earth Observation Enschede, The Neetherland. http://www.itc.nl/library/papers_2004/msc/upla/phothanh_tung.pDF.
- Varnes, D. J., 1984.” Landslide Hazard Zonation: A Review of Principles and Practice”. Natural Hazards 3, 63. Paris: UNESCO. http://unesdoc.unesco.org/images/0006/000630/063038EB.pdf.
- Voogd, H. 1983. Multi-Criteria Evaluation for Urban and Regional Planning. London: Pion. doi:10.6100/IR102252.
- Westen, C. J., L. Montoya, L. Boerhoom, and E. B. Coto. 2002. “Multi-Hazard Risk Assessment Using GIS in Urban Areas: A Case Study for the City of Turrialba, Costa Rica”. the Proceedings of Regional Workshop on Best Practices in Disaster Mitigation, Lessons learned from the Asian Urban Disaster Mitigation Program and other initiatives, Bali, Indonesia, September 24–26.
- Xu, C., F. Dai, X. Xu, and Y. H. Lee. 2012. “GIS-based Support Vector Machine Modeling of Earthquake-Triggered Landslide Susceptibility in the Jianjiang River Watershed, China.” Geomorphology 145: 70–80. doi:10.1016/j.geomorph.2011.12.040.
- Yalcin, A. 2008. “GIS-based Landslide Susceptibility Mapping Using Analytical Hierarchy Process and Bivariate Statistics in Ardesen (Turkey): Comparisons of Results and Confirmations.” Catena 72: 1–12. doi:10.1016/j.catena.2007.01.003.