
 ?Mathematical formulae have been encoded as MathML and are displayed in this HTML version using MathJax in order to improve their display. Uncheck the box to turn MathJax off. This feature requires Javascript. Click on a formula to zoom.
ABSTRACT
Finding an appropriate vacant lot to buy is one of the most important land marketing problems in Tehran, Iran. Typically, the land selection and purchase processes in Tehran city are based on face-to-face meetings. Despite the face-to-face land sale and purchase strategies, a few online geo-marketing or real-estate websites have been developed. However, these geo-marketing real-estate web services have two main limitations. The services have focused on simple searches and selections from a set of predefined land parcels according to some basic criteria, such as land price, area etc. They do not consider spatially explicit criteria and spatial analyses relevant to a land selection process (e.g. proximity to transportation stations). The services are lacking a proper scientific foundation for spatial multi-criteria selection of land parcels. Moreover, the alternative land parcels are dynamically created by new sellers. However, the services are hard-coded based on a set of predefined land parcels and fail to support evaluation of the parcels added by new owners. To overcome these limitations, the study proposes a geo-marketing decision support system by integrating geographic information system (GIS) and multi-criteria decision analysis (MCDA) techniques into the web platform. The GIS-based MCDA tools provide appropriate analytical approaches and platforms to support decision makers/people in spatial decision-making processes based on individual values and interests. The paper demonstrates the implementation of a geo-marketing decision support system for land selection and purchase processes in district no. 22 of Tehran.
1. Introduction
Land search and selection is one of the most important steps in land purchase decisions. Typically, citizens buy vacant lands for construction purposes (e.g. apartments, buildings etc.). One of the main problems that buyers are facing with is the selection of appropriate or suitable lands among a set of available land parcels (Cao et al. Citation2001; Ford, Rutherford, and Yavas Citation2005; Turk, Kitapci, and Dortyol Citation2014; Zhang, Zhu, and Ye Citation2016). The selection process involves land parcels that should be evaluated on the basis of a number of quantitative and qualitative criteria according to the buyers’ preferences (Zeng and Zhou Citation2000; Ford, Rutherford, and Yavas Citation2005; Natividade-Jesus, Coutinho-Rodrigues, and Antunes Citation2007; Xu and Li Citation2014; Yang et al. Citation2015). For example, a buyer needs to consider a set of non-spatial criteria (e.g. price range and construction permission) as well as spatial/locational factors (e.g. land area and proximity to parks, public transportation and sport centres) while making a purchase decision.
Traditionally, the process of searching and choosing the lands has been based on face-to-face meetings, physical visiting of the lands and a careful survey of the land properties. Typically, land buyers have to spend a lot of time and cost for acquiring land information by arranging times and visiting lands one by one (Ford, Rutherford, and Yavas Citation2005; Becker Citation2013). Moreover, complexity of the land search process is increased when buyers take time off work to accommodate prospective sellers’ schedules and pay commission fees to real-estate agents to find the land (Zumpano, Johnson, and Anderson Citation2003; Yuan et al. Citation2013). Regarding the sellers, they have to spend times to advertise their land property by physical presence in a real-estate agency. Both purchasers and sellers are limited to working times of real-estate agencies.
Despite the advantage of physical sales and purchases, digital marketing or e-marketing provides more knowledge about land market beyond time and geographical limitations (Järvinen and Karjaluoto Citation2015; Kannan and Li Citation2017). Online geo-marketing as a kind of e-marketing can play an important role in real-estate services, applications and tools (Suárez-Vega, Santos-Peñate, and Dorta-González Citation2012; Roig-Tierno et al. Citation2013; Giovanardi and Lucarelli Citation2018). These approaches have the potential to consider spatiality or geographical variables in e-marketing and business decisions (Giovanardi and Lucarelli Citation2018). In the literature related to geo-marketing (Campo et al. Citation2000; Ford, Rutherford, and Yavas Citation2005; Cliquet Citation2013; Halbout et al. Citation2013; Turk, Kitapci, and Dortyol Citation2014; Baviera-Puig, Buitrago-Vera, and Escriba-Perez Citation2016; Chacón-García Citation2017), it is defined as a system, application, tool or geo-analysis output that produces useful information, knowledge or decision related to a marketing problem. It combines spatial analysis functions, geographic representation and geo-statistical methods of GIS (geographic information system) to produce useful information for business-related decision-making. Hess, Rubin and West (Citation2004) suggest that GIS capabilities (spatial database and analyses) align with fundamental components of marketing information system technology (MKIS). They argue that an exclusive advantage of GIS over other MKIS technologies is its ability to integrate data from disparate sources, analyse them and present map-based information to support marketing-specific decisions. Moreover, the ability of GIS to analyse social and economic data associated with spatial entities that have topological, geometric or geographical properties has made it possible to reduce uncertainty in decision-making in certain markets, such as real estate and retail (Suárez-Vega, Santos-Peñate, and Dorta-González Citation2012; Cliquet Citation2013; Roig-Tierno et al. Citation2013; Chacón-García Citation2017).
Over the last decade or so, a large number of online geo-marketing or real-estate websites (or mobile applications) have been developed to overcome the space–time limitations of traditional real-estate services. Such online information has not removed real-estate agents but has transformed their role from someone who handles the listings to someone who negotiates and arranges the buying and selling processes (Cao et al. Citation2001; Kummerow and Lun Citation2005; Zhang, Zhu, and Ye Citation2016). The current web services have two main limitations. First, the services have focused on simple searches and selections based on some basic criteria, such as price, area etc., and do not consider spatially explicit criteria relevant to a land selection process (Zeng and Zhou Citation2000; Kummerow and Lun Citation2005; Yuan et al. Citation2013). In other words, the services lack a platform allowing for spatial aspects (spatiality) of land selection to be considered explicitly. Accordingly, the tools fail to provide spatial analysis capabilities and only support a simple non-spatial search instead of a multi-criteria spatial selection. A notable feature of spatial analysis in the land selection process is that its results depend on locations of the lands and their attributes. In this regards, results would be different under rearrangements of the spatial distribution of attributes or reconfiguration of the spatial structure (Malczewski and Rinner Citation2015). Second, the services are lacking a proper scientific foundation for multi-criteria selection of land parcels, where they cannot integrate the geographical data and buyers’ preferences (i.e. relative importance of economic, social and geographical criteria relevant to land selection) to evaluate and select land parcels in a more precise manner (Zeng and Zhou Citation2000; Ford, Rutherford, and Yavas Citation2005; Becker Citation2013; Zhang, Zhu, and Ye Citation2016). In the currently used real-estate web services, buyers are not able to specify their values and interests with respect to the criteria (i.e. preferences prioritization) (Becker Citation2013; Yang et al. Citation2015). Even though importance, value and potential of a land are fundamentally determined by its location and multiple criteria (Cliquet Citation2013; Zhang, Zhu, and Ye Citation2016), the above services don’t support multi-criteria spatial analysis-based services.
Integrating web-based GIS and multi-criteria decision analysis (MCDA) can yield new ways of tackling land search and selection problems (Jarupathirun and Zahedi Citation2007; Gorsevski et al. Citation2013; Jelokhani-Niaraki and Malczewski Citation2015b; Yang et al. Citation2015; Jelokhani-Niaraki, Sadeghi-Niaraki, and Choi Citation2018). It can offer a geo-marketing decision support system (GDSS), which provides appropriate analytical tools and platforms for a right land purchase decision. At the most basic level, a web-based GDSS can be viewed as a decision support tool that integrates geographical data (land and other facilities) and buyers’ preferences to support information needs in land transaction processes. The underlying idea behind incorporating MCDA techniques and GIS in geo-marketing is that the MCDA capabilities can complement GIS tools during the selection of land. While GIS can be used as a powerful and integrated tool with unique capabilities for storing, manipulating, analysing and visualizing geographically referenced information for land purchase decisions, MCDA provides a rich collection of procedures and algorithms for designing, evaluating and prioritizing land parcels (Coutinho-Rodrigues, Simão, and Antunes Citation2011; North and Miller Citation2017).
In this study, a web-based GDSS is proposed for land purchase decisions. In the proposed system, the GIS (spatial analysis) and MCDA tools are incorporated into web platform. Chacón-García (Citation2017) suggests that the integration of GIS and MCDA shows great efficiency in the measurement of spatial reality for marketing decisions (see also Roig-Tierno et al. Citation2013). The system allows sellers to interactively draw their land parcels using polygon features and enter their attributes to be further used by land selection analysis. It performs the spatial analysis to determine the criteria values for each of the seller-defined parcels and impose topological constraints on these parcels to discover errors as sellers may incorrectly draw the polygons. Buyers are able to specify their criteria preferences with respect to land selection. The MCDA techniques contribute to the land selection process by selecting the best land parcel from the set of seller-defined parcels according to the buyer preferences.
The remainder of the paper is presented as follows. Section 2 provides an overview of the research methodology and capabilities (GIS and MCDA) of the web-based GDSS in the land selection process. Section 3 demonstrates a prototype implementation of GDSS. In Section 4, the evaluation of the proposed system, including functionality, reliability, usability, efficiency, maintainability and portability of the GDSS, is provided. Finally, concluding remarks and future works are given in Section 5.
2. Methodology
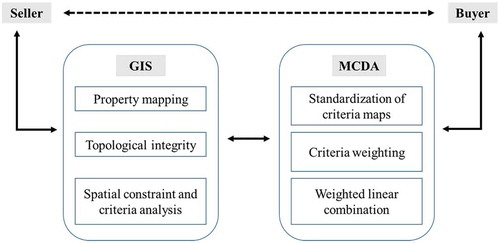
The proposed GDSS integrates the capabilities of GIS and MCDA into the web platform to provide appropriate spatial analysis and decision support tools for land selection procedure (see ). Space and time-distributed environment of the web offers not the only flexibility of using GIS-MCDA in different space and time for the convenience of individuals but also provides better access to spatial information and enhances benefits from its use (Malczewski Citation2006). Access to the relevant GIS-MCDA data and tools anywhere (any location that has the Internet access), anytime (24 h a day, 7 days a week) and through any PCs or handheld devices (e.g. smartphones) and networks (wired or wireless technologies) has remarkably enhanced the land search process (Jelokhani-Niaraki and Malczewski Citation2015a, Citation2015b).
Figure 1. GIS and MCDA capabilities for land transaction process in GDSS.
In general, MCDA methods can be divided into multi-objective decision-making and multi-attribute decision-making (Malczewski Citation1999). Multi-objective decision problems involve the use of mathematical programming to generate and optimize spatial alternatives (land parcels). These approaches include goal programming, compromise programming, reference point method, interactive programming methods etc. They are continuous in the sense that the best alternative may be found anywhere within the region of feasible solutions. On the other hand, multi-attribute approaches are considered as selection of the best alternative(s) from a set of predetermined alternatives. In other words, Multi-Attribute Decision Making (MADM) problems involve a selection process, as opposed to a generation process by multi-objective approaches (Malczewski and Rinner Citation2015). In this study, the analytical hierarchy process (AHP)-weighted linear combination (WLC) as one of the multi-attribute approaches is used because a finite set of land parcels (location, shape and area) have been predefined and specified by sellers, where buyers select the ‘best’ one according to multiple criteria. The easiness and clarity are central advantages of WLC for the land selection process (Malczewski and Rinner Citation2015; Jelokhani-Niaraki Citation2018).
Specifically, the system provides a seamless interaction between GIS and MCDA components. The GIS components are used to map land parcels, detect parcel errors using topological integrity, perform criteria analysis for producing criterion maps and constraint analysis for generating feasible alternative land parcels, standardize the criterion maps and finally visualize the decision results (land priorities) on the map. The MCDA components allow for defining the criteria for parcel evaluation (selection), specifying the importance of criteria using AHP method, computing the criteria weights and eventually using WLC technique to combine the weights and criteria maps in order to prioritize and rank the land parcels for buyers. The integration of MCDA techniques into GIS-based procedures allows buyers to input their judgments with respect to evaluation criteria and/or alternatives and find the land parcels that satisfy their decision objectives.
2.1. GIS components
2.1.1. Land property mapping
There are two principal approaches for sellers/owners to specify their land properties for sale: property selection and property mapping. Property selection involves choosing a particular parcel from available and existing parcels. However, the predefined parcels are not available in most of the areas of Iran. The property mapping component provides sellers with access to geographic data as well as the fundamental mapping and geographic analysis tools that they need for parcel mapping. Specifically, it allows the seller to locate his/her own property, draw a parcel feature (polygon) around the property and attach the sales price as well as other features (property sales data) to the parcel. A web-mapping service is provided as the background, where sellers can add their parcels to the map and can visually determine the locations available for sale in any given neighbourhood. Sellers can link their parcels to documents, attributes and pictures in such a way that buyers can click the parcels on the map to see the additional details of the property. The map service can be seamlessly switched to show aerial photo-imagery or terrain, allowing to find more realistic information about the property and the surrounding properties on the map (Zeng and Zhou Citation2000; Cliquet Citation2013). All of the parcels can be dynamically created, modified, deleted and stored in a map layer and further used as alternatives. An MCDA tool can be then used to evaluate the alternative land parcels and select the best one according to the buyer’ preferences.
2.1.2. Topological integrity
The main reason for incorporating topological integrity component in the system is to provide an automated method for detecting the topological errors of seller-defined parcels and cleaning them. When the sellers draw their land parcel/polygons using the land property mapping component, the system is able to automatically detect errors including overlaps, gaps, overshoots, undershoots and dangle points through a set of rules. Once the system has discovered the topology errors, it shows the error on the map and allows the seller to use the tools for editing, validation and error correction of topologies. This capability enables sellers to correctly specify land parcels.
2.1.3. Spatial constraint and criteria analysis
The land search and selection process involve a set of spatial constrains and criteria against which the alternative parcels are evaluated (Zeng and Zhou Citation2000; Kummerow and Lun Citation2005). Constraints defined by buyers impose limitations on the set of land parcel (e.g. the land must be 1 km away from the industrial area). A parcel is feasible if it satisfies all constraints. Parcels that do not meet the constraints are referred to as infeasible (or unacceptable) parcels for buyers (Malczewski and Rinner Citation2015). The constraint analysis tool uses buyer-specified constraints to determine feasible land parcels. The constraints are defined based on spatial relationships (including distance, disjoint, meet, overlap, contains, inside, covers and equal).
From buyers’ perspective, the spatial criteria include land size and its proximity to parks, public transportation facilities, schools etc. Spatial analysis component is used to generate the criterion maps (e.g. proximity maps) based on the seller-defined parcel locations and neighbourhood facilities (Malczewski and Rinner Citation2015). This tool has the capability to dynamically perform spatial criteria analysis and create criteria maps when parcel locations are modified, added or deleted. When the new parcels are added by the seller, the system is able to automatically compute criteria values (maps) for the new parcels in a dynamic manner. Specifically, it involves the use of GIS functions of ‘area calculation’ and ‘network distance analysis’ to generate land area and proximity criteria maps, respectively.
2.2. MCDA components
2.2.1. Standardization of criterion maps
The procedures for transforming spatial criterion map to comparable units are referred as the value scaling or standardization methods (Boroushaki and Malczewski Citation2008; Jelokhani-Niaraki and Malczewski Citation2012). There are a number of methods for standardizing criterion map. Here, we adopt a standardization component that uses the minimum and maximum values of a criterion map as scaling points. Depending on whether the criterion is to be maximized (i.e. the larger the raw value, the better the performance) or minimized (i.e. the lower the value, the better the performance), Equations (1) and (2) can be used to convert the raw criterion maps into standardized values, respectively (Malczewski and Rinner Citation2015).
where Sij is the raw value for the ith land parcel and the jth criterion, Sjmin represents the minimum value for the jth criterion map, Sjmax is the maximum value for the jth criterion map and V(aij) is the standardized value for the ith land parcel with respect to the jth criterion. The standardized attribute values for all land parcels range from 0 to 1.
2.2.2. Weighting
To determine the relative importance of each criterion map in the land selection process, a weighting component is developed. The component involves an AHP method (Saaty Citation1980) to determines buyers’ preferences and compute the criteria weights. The GIS-based AHP methods have successfully been applied for land evaluation in different applications (Cay and Uyan Citation2013; Romano et al. Citation2015; Yalew, Van Griensven, and van der Zaag Citation2016; Jelokhani-Niaraki Citation2018). The AHP is a commonly used MCDA method for determining criteria weights. This method is part of the multi-criteria decision module in several GIS-MCDA applications (Cay and Uyan Citation2013; Malczewski and Rinner Citation2015; Wolf et al. Citation2015; Yalew, Van Griensven, and van der Zaag Citation2016; Repetto et al. Citation2017).
Relative importance of criterion maps is determined using pairwise comparison matrix (A) that are quantified using the Saaty’s 1–9 scale (1 means the two criteria contribute equally to the land selection, and 9 means one criterion is most favoured over another) (Delice and Güngör Citation2009). In a pairwise comparison matrix (Equation (3)) for the land selection, uij can be interpreted as the degree of preference of jth criterion map over kth criteria map in the land selection process. If n (n − 1)/2 comparisons are consistent, where n is the number of criteria, then the elements (ujk) will satisfy the following conditions (Saaty Citation1980; Işıklar and Büyüközkan Citation2007; Delice and Güngör Citation2009): ujk = wj/wk = 1/ukj.
The relative weights are computed by the right eigenvector (w) corresponding to the largest eigenvalue (λmax) using the following equation:
If the pairwise comparisons are completely consistent, the matrix A has rank 1 and λmax = n. In this context, the weights can be calculated by normalizing any of the rows or columns of A (Cay and Uyan Citation2013; Yalew, Van Griensven, and van der Zaag Citation2016). The last step of AHP is to calculate the consistency ratio (CR) for each pairwise comparison matrix. If CR ≤ 0.1, comparison matrix is consistent; otherwise, it is inconsistent. CR can be calculated using Equations (5) and (6):
where CI is consistency index and RI is random index. shows the RI values for the pairwise comparison matrices with the order from 1 to 10.
Table 1. Random index for pairwise comparison matrices.
2.2.3. Weighted linear combination
WLC is the most often used GIS-MCDA method for combining criterion maps (Malczewski and Rinner Citation2015). It involves the use of geographical data, buyers’ preferences and an aggregation function (decision rule) that combines spatial data and the preferences to evaluate land parcels. The WLC component calculates the overall score for the ith decision alternative (the land parcel) based on criterion weights w1, w2, …, wn and the criterion values (criterion maps) ai1, ai2, …, ain (i = 1, 2, …, m) as follows:
where V(Ai) is the overall value of the ith alternative land parcel, V(aij) is the standardized value of the ith alternative with respect to the jth criterion. The alternative parcel characterized by the highest value of V(Ai) is the most preferred land property from the buyer’s point of view.
3. Implementation
3.1. Case study
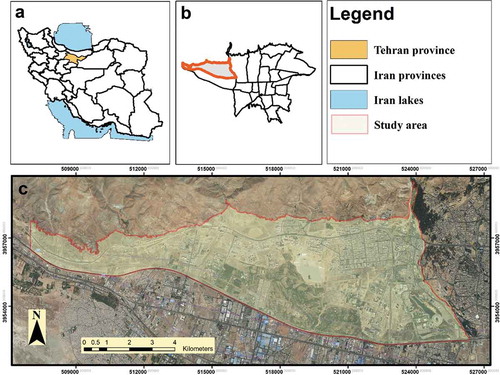
Tehran is the capital and one of the fastest growing cities in Iran. With an area of about 1225 km, it is divided into 22 municipal districts. The rapidly changing pattern and physical expansion of Tehran, accompanied by population growth, has led to the shortage of houses and apartments. The proposed GDSS was used for land transactions in district no. 22 of Tehran (see ). District no. 22 with 6200 ha area and about 128 thousand citizens is one of the newest and largest regions in Tehran. This district is surrounded by central Alborz mountain from North, Kan river from East, Tehran–Karaj freeway from South and Vardavard forest area from West. Due to the population growth and extensive economic developments, the demand for house construction and, in turn, the use of lands has been increased (Tayyebi, Shafizadeh-Moghadam, and Tayyebi Citation2018). In addition, government policy, such as the expansion of the district boundaries, has increased the use of urban bare lands for development and apartment construction purposes. As a result, the search and selection of appropriate land properties in this district are of critical importance. Typically, the land selection processes in the district are based on physical visits and meetings. Considering a large number of available lands for sales, the increasing need for lands and the lack of an adequate number of real-estate agencies in the district, citizens have difficulty to find suitable lands. Consequently, the proposed system plays a key role in the land purchase decisions in the district.
Figure 2. Location of the study area in Tehran province (A), the districts of Tehran (B) and district no. 22 of Tehran (C).
3.2. System architecture
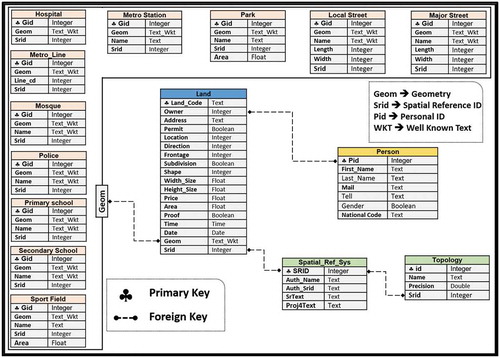
The GDSS involves the use of Free and Open Source Software (FOSS) technologies based on a client–server architecture to provide a scalable application where the source code is openly shared so that people are encouraged to use and change it and voluntarily improve the design of the land transaction system. The architecture of system consists of three main layers (tiers): data, application logic and presentation (see ). Data layer includes a Spatial Database Management System (SDBMS) to store the input data, including land parcels and associated attributes defined by sellers as well as criteria values computed by spatial analysis component. After the system requirements analysis, database schema was designed (see ). Different entities such as land, person, spatial reference, topology, urban facilities (e.g. park, hospital, school, metro line and station, street etc.) and their relations are considered in the schema. The PostGIS, a freely available and Open Geospatial Consortium (OGC) compliant spatial extension of PostgreSQL, was used as SDBMS in the decision support system (Kisilevich, Keim, and Rokach Citation2013). PostGIS provides the capabilities to store and retrieve spatial data and supports a large number of spatial queries in the database (Steiniger and Hunter Citation2013; Brovelli, Minghini, and Zamboni Citation2016). The database schema was employed as the logical model for creating the physical PostGIS-based SDBMS for GDSS.
Figure 3. System architecture.
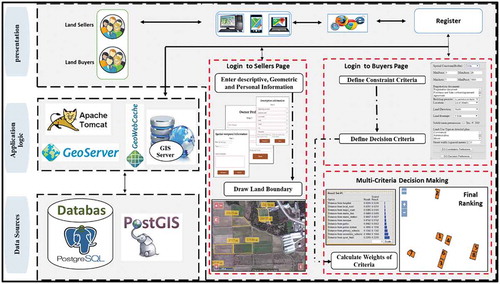
Figure 4. The logical data model for the GDSS.
Application logic layer implements the core services and functionalities of the system. It uses two server components (i.e. web and GIS servers) to accomplish the functionalities. The client (seller or buyer) interacts with web server through a web browser. Specifically, GIS server supports the GDSS by publishing the data of land parcels and urban facilities using the OGC web map service (WMS) and web feature service (WFS) standards. In addition to providing access to GIS data, the GIS server also provides access to the GIS functionalities that the system contains. The server offers a set of functions for building spatially enabled web-mapping applications and web services (Reed Citation2011; Repetto et al. Citation2017). It allows the application to access and display spatially enabled content of the SDBMS and as well as querying and analysis the data provided by the services. World’s most popular open source servers, namely Apache 2.4.x (http://tomcat.apache.org) and Geoserver, were used as web and GIS servers, respectively. Geoserver provides an interoperable platform for the GDSS using OGC standards, where it enables other geo-marketing tools to reuse, share and exchange the land data services. The Open Source Routing Machine was used to calculate network distances (see https://github.com/Project-OSRM/osrm-backend). It is a high performance routing engine designed to run on OpenStreetMap data.
Presentation (client) or graphical user interfaces (GUI) tier supports the user interaction with the GDSS. The GUI of the system is developed using OpenLayers library (https://openlayers.org/) and Ext JS. OpenLayers is an open-source client-side pure JavaScript library that is used for the purpose of providing the Google, OpenStreetMap and Bing base map services (WMS) as well as land and urban facilities feature services (WFS), with no server-side dependencies. Ext JS is a pure JavaScript application framework for building interactive cross-platform web applications using techniques such as Ajax, DHTML and DOM scripting. This framework provides a set of GUI elements (forms and controls) for use within the GDSS.
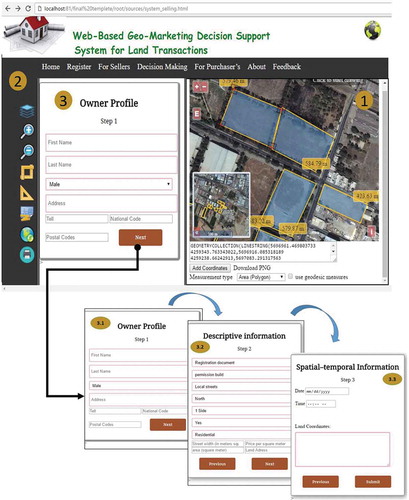
Basically, the GUI of the system consists of the sellers’ and buyers’ interfaces. As shown in , the seller’ interface includes (1) a map frame for drawing land parcels on the base maps (labelled as 1); (2) a set of GIS tools for manipulating maps, such as ‘select base map’, ‘zoom in’, ‘zoom out’, ‘area measurement’, ‘length measurement’, ‘zoom to extend’, ‘printing’ etc. (labelled as 2); (3) a three-section expandable accordion menu for the owner to input his/her personal ownership information, specify land attribute data and see and confirm his/her own parcel data (labelled as 3.1, 3.2 and 3.3).
Figure 5. The main interface of the seller.
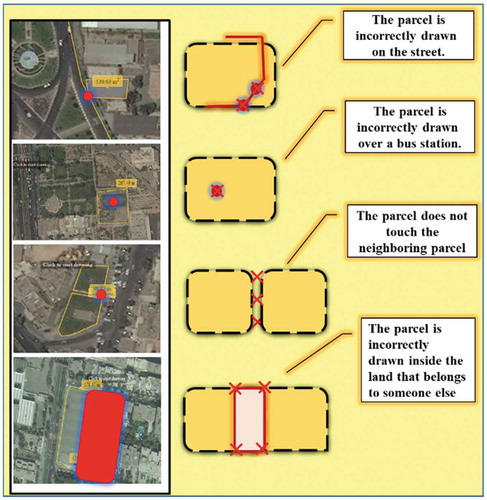
Once the parcels have been drawn, the topological integrity component would detect the errors of owner-defined parcels (see Section 2.1.2). If the parcel is incorrectly created, the component detects and shows an error message like ‘Your land parcel has been incorrectly located on the streets or someone else’ property’ using topological rules (see ). In this case, the owner would be able to create new parcel or modify the existing one.
Figure 6. Topological validation rules for land seller system.
Based on the literature review, a set of 11 distinct criteria for evaluating the suitability of land parcels has been identified (e.g. Johnson Citation2001; Fanni and Daviran Citation2009; Malczewski and Jelokhani-Niaraki Citation2012; Salajegheh, Hakimpour, and Esmaeily Citation2016; Khakpoor, Kamandari, and Hoseyni Citation2017). shows the criteria for land selection in district no. 22. Having established the criteria for selecting land parcels, each criterion should be represented as a map layer in the GIS database. Once the land parcels have been correctly defined, the spatial analysis tool generates criteria maps using the GIS functions of ‘Area calculation’ and ‘Euclidian distance analysis’. Depending on the criterion (e.g. proximity to transportation stations), the spatial analysis tool uses the parcel map layer and a particular urban facility layer (e.g. transportation stations) as inputs and computes the distance between the alternative land parcels and the facilities using the tool ‘network distance analysis’. It is worth noting that the tool has the capability to dynamically perform spatial criteria analysis and create criteria maps when new parcels by different sellers are added or removed. Given the variety of scales on which land criteria can be measured, multi-criteria evaluation of lands requires that the values contained in the criterion map layers be transformed to comparable units. To this end, the standardization tool can automatically convert the criterion maps to standardize or normalized maps (see Section 2.2.1).
Table 2. The criteria for land purchase process.
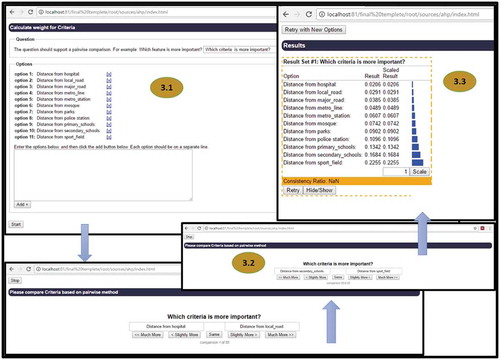
Generally, the buyer’s interfaces () include three parts for specification of constraints, determining the criteria preferences and evaluating the land parcels (see Section 2.2). Buyers can specify their spatial constraints, which represent restrictions imposed on the selection of the land parcels. Spatial constraint analysis removes infeasible land parcels and represents only feasible ones. For example, a land parcel to be feasible for buyer must be located within a particular area (labelled as 1 and 1.1). Within this context, the buyer draws the boundary of the constrain area (i.e. circle, polygon or rectangle), and the constraint analysis tool employs the one of the spatial analysis tools (overlay-intersect) to examine whether the buyer-defined parcels are within that area or not. In other words, the buyer draws the area to narrow down his/her search space (all available land parcels). In the second part, the buyer specifies his/her preferences by assigning different importance levels to the land selection criteria (labelled as 2). The weighting tool allows buyers to compare the criteria using AHP-based pairwise comparison technique, where two criteria are evaluated at a time in terms of their relative importance (labelled as 3, and ). Consequently, the tool computes the criteria weights. Finally, the third part uses the WLC tool to combine the relevant criterion maps and the associated weights set by the buyer to determine the overall score of the land parcels. As shown in label 4, the best land parcel for the buyer is that with the highest rank (or highest score).
Figure 7. The main interface of the buyer.
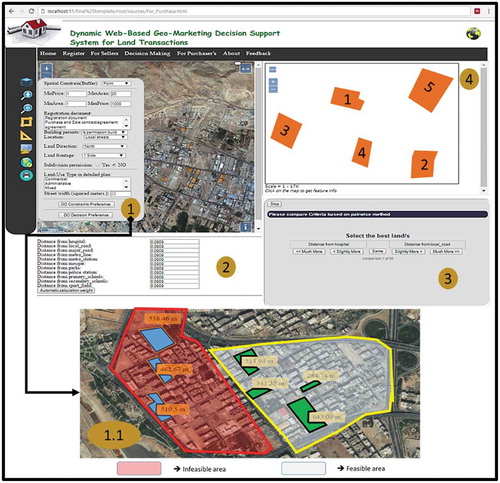
Figure 8. The interface of the MCDA module for pairwise comparison and weighting.
4. Evaluation of GDSS
Evaluating the web-based GDSS is essential to its effective use (Meng and Malczewski Citation2010). As the GDSS is used by general public, its interfaces should be designed in such a way that non-expert users can interact with it easily and fulfil their requirements without any problems (Delice and Güngör Citation2009; Komarkova, Jedlicka, and Hub Citation2010). Several quality models are proposed for measuring software quality (Domínguez-Mayo et al. Citation2012; Kong, Zhang, and Stonebraker Citation2015; Febrero, Calero, and Moraga Citation2016). One of the most comprehensive ones is ISO/IEC 9126 standard. To address the issues of software product quality, Febrero, Calero and Moraga (Citation2016) suggest that the ISO/IEC 9126 standard can be used as software product quality’s characteristics and their metrics. The standard defines a quality model which is applicable to every kind of software. The model uses six main quality characteristics, including functionality, reliability, usability, efficiency, maintainability and portability (see ). Each characteristic is also divided into several sub-characteristics. These sub-characteristics encourage certain user-centred designs of the GDSS, where system goals, objectives, context and environment are all aligned with the buyers and sellers’ preferences (Jelokhani-Niaraki and Malczewski Citation2015b).
Figure 9. The characteristics and sub-characteristics of the ISO/IEC 9126 quality model.
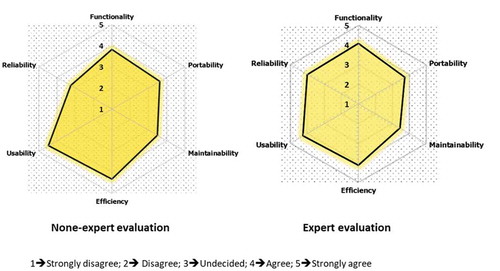
To evaluate the GDSS, two different questionnaires were distributed to two statistical group: GIS experts and non-expert Tehranian citizens. Overall, 30 participants completed the questionnaires. The reliability of the questionnaires was assessed using Cronbach’s alpha test. The questionnaire reliability for GIS experts and non-expert users are 0.84 and 0.81 (α > 0.7, acceptable), respectively. It should be noted that each questionnaire contains 27 questions according to the ISO/IEC model (see ). The responses to the questions are determined based on Licker scale. The t-test was used to examine the significance level of the two groups (experts and non-expert) and determine if two sets of groups are significantly different from each other. A t-test is most commonly applied when the test statistic would follow a normal distribution. To this end, the normal distribution level of the collected data for each of the groups is examined by the Kolmogorov–Smirnov test. As shown in , the experts agree that the functionality, portability, efficiency, usability and reliability of the GDSS are suitable (i.e. the score of 4). However, they do not completely agree about the maintainability of the system. When it comes to the non-expert users, they agree with the suitability of all factors except reliability. Results of Student’s t-test indicate that there are no significant differences between the two groups (>0.05). Only for reliability, the result is different (<0.05). Thus, the null hypothesis of no difference in the reliability is rejected. In other words, the difference between the non-experts and expert users in terms of reliability is statistically significant.
Figure 10. Results of system evaluation based on the ISO/IEC 9126.
In addition to the technical evaluation, the system was evaluated from the economic perspective. The economic benefit of the system was examined in terms of time (i.e. the time spent to visit lands and real-estate agents) and cost (i.e. travel cost, fuel consumption, and commission fee) of land purchase processes. A total of 10 buyers who had previously bought vacant lands using the traditional approach (searching the lands based on face-to-face meetings and physical visiting of the lands) were asked to specify their land purchase experiences in terms of the time and cost spent to visit lands and real-estate agents for finding the right lands. The time and cost spent for finding the same land properties using the web-based GDSS were also measured. It is evident from that there is a big difference between the traditional approach and web-based GDSS in terms of time and cost. Typically, land buyers need to spend a lot of time and cost to explore land property listings by visiting them one by one and paying commission fees to real-estate agents. Consequently, the use of proposed GDSS reduces the cost of searching and selecting an appropriate land for buyers by eliminating the need for physical or face-to-face meetings.
Table 3. The comparison of traditional and GDSS approaches for land purchase decisions.
5. Conclusion
This study presents a web-based geo-marketing decision support system for land selection and purchase processes in Tehran, where land owners (sellers) can define their own land parcels and the system is able to easily select the best land for buyers according to their preferences. Specifically, it integrates GIS (i.e. spatial data and analysis) and MCDA tools to facilitate land selection processes. The underlying idea behind incorporating MCDA techniques into GIS is that the MCDA capabilities can complement GIS tools during the land selection process. Using GIS to store, manage, analyse, retrieve and visualize land parcel (spatial data) and associated attribute data offers the capability of efficiently developing techniques and methods for modelling land purchase decision-making problems. The system has been completely developed based on FOSS framework. Such a framework provides a scalable application where the source code is openly shared so that people are able to easily use and change it and potentially improve the design of the land selection system. One of the restrictions of this system is that buyers are limited to the predefined criteria. As the future work, a user-centric decision support system can be developed, where each buyer could define their own criteria. In this context, the system should automatically recognize the criteria and generate the respective criterion maps (Jelokhani-Niaraki and Malczewski Citation2012). In addition, a future study might consider developing a mobile version of the system. The use of mobile devices and smartphones such as cell phones equipped with global positioning system (GPS) has increased significantly and became a popular platform for real-estate applications. The added mobility provided by such devices facilitates in-situ parcel mapping in real time through the use of GPS. In addition, land owners can enter a variety of geo-referenced texts, photos, video clips and sounds about land parcels using artificial sensors embedded in smartphones such as microphones, GPS receivers, camera and voice.
Disclosure statement
No potential conflict of interest was reported by the authors.
References
- Baviera-Puig, A., J. Buitrago-Vera, and C. Escriba-Perez. 2016. “Geomarketing Models in Supermarket Location Strategies.” Journal of Business Economics and Management 17 (6): 1205–1221. doi:10.3846/16111699.2015.1113198.
- Becker, L. C. 2013. “Land Sales and the Transformation of Social Relations and Landscape in Peri-Urban Mali.” Geoforum 46: 113–123. doi:10.1016/j.geoforum.2012.12.017.
- Boroushaki, S., and J. Malczewski. 2008. “Implementing an Extension of the Analytical Hierarchy Process Using Ordered Weighted Averaging Operators with Fuzzy Quantifiers in ArcGIS.” Computers & Geosciences 34 (4): 399–410. doi:10.1016/j.cageo.2007.04.003.
- Brovelli, M. A., M. Minghini, and G. Zamboni. 2016. “Public Participation in GIS via Mobile Applications.” ISPRS Journal of Photogrammetry and Remote Sensing 114: 306–315. doi:10.1016/j.isprsjprs.2015.04.002.
- Campo, K., E. Gijsbrechts, T. Goossens, and A. Verhetsel. 2000. “The Impact of Location Factors on the Attractiveness and Optimal Space Shares of Product Categories.” International Journal of Research in Marketing 17 (4): 255–279. doi:10.1016/S0167-8116(00)00026-4.
- Cao, J., J. Y. Chan, H. Li, L. Mahdjoubi, and P. E. Love. 2001. “REALMEDIA: Providing Multimedia-Based Real-Estate Services through the Internet.” Automation in Construction 10 (2): 275–289. doi:10.1016/S0926-5805(99)00033-3.
- Cay, T., and M. Uyan. 2013. “Evaluation of Reallocation Criteria in Land Consolidation Studies Using the Analytic Hierarchy Process (AHP).” Land Use Policy 30 (1): 541–548. doi:10.1016/j.landusepol.2012.04.023.
- Chacón-García, J. 2017. “Geomarketing Techniques to Locate Retail Companies in Regulated Markets.” Australasian Marketing Journal (AMJ) 25 (3): 185–193. doi:10.1016/j.ausmj.2017.06.001.
- Cliquet, G. 2013. Geomarketing: Methods and Strategies in Spatial Marketing. NJ, USA: John Wiley & Sons.
- Coutinho-Rodrigues, J., A. Simão, and C. H. Antunes. 2011. “A GIS-based Multicriteria Spatial Decision Support System for Planning Urban Infrastructures.” Decision Support Systems 51 (3): 720–726. doi:10.1016/j.dss.2011.02.010.
- Delice, E. K., and Z. Güngör. 2009. “The Usability Analysis with Heuristic Evaluation and Analytic Hierarchy Process.” International Journal of Industrial Ergonomics 39 (6): 934–939. doi:10.1016/j.ergon.2009.08.005.
- Domínguez-Mayo, F., M. J. Escalona, M. Mejías, M. Ross, and G. Staples. 2012. “Quality Evaluation for Model-Driven Web Engineering Methodologies.” Information and Software Technology 54 (11): 1265–1282. doi:10.1016/j.infsof.2012.06.007.
- Fanni, Z., and E. Daviran. 2009. “Study of Land and Housing Market (Case Study: Zanjan City from 1378 to 1386).” Journal of Housing and Rural Environment 27 (124): 12–25.
- Febrero, F., C. Calero, and M. Á. Moraga. 2016. “Software Reliability Modeling Based on ISO/IEC SQuaRE.” Information and Software Technology 70: 18–29. doi:10.1016/j.infsof.2015.09.006.
- Ford, J. S., R. C. Rutherford, and A. Yavas. 2005. “The Effects of the Internet on Marketing Residential Real Estate.” Journal of Housing Economics 14 (2): 92–108. doi:10.1016/j.jhe.2005.06.003.
- Giovanardi, M., and A. Lucarelli. 2018. “Sailing through Marketing: A Critical Assessment of Spatiality in Marketing Literature.” Journal of Business Research 82: 149–159. doi:10.1016/j.jbusres.2017.09.029.
- Gorsevski, P. V., S. C. Cathcart, G. Mirzaei, M. M. Jamali, X. Ye, and E. Gomezdelcampo. 2013. “A Group-Based Spatial Decision Support System for Wind Farm Site Selection in Northwest Ohio.” Energy Policy 55: 374–385. doi:10.1016/j.enpol.2012.12.013.
- Halbout, P., F. Chenus, D. Sauton, B. Pelletier, F. Meunier, C. Krikorian, and A. Assal. 2013. “Géomarketing des collectes mobiles et des donneurs de l’EFS Aquitaine Limousin: une expérience sur trois années.” Transfusion clinique et biologique 3 (20): 269. doi:10.1016/j.tracli.2013.04.060.
- Hess, R. L., R. S. Rubin, and L. A. West. 2004. “Geographic Information Systems as a Marketing Information System Technology.” Decision Support Systems 38 (2): 197–212. doi:10.1016/S0167-9236(03)00102-7.
- Işıklar, G., and G. Büyüközkan. 2007. “Using a Multi-Criteria Decision Making Approach to Evaluate Mobile Phone Alternatives.” Computer Standards & Interfaces 29 (2): 265–274. doi:10.1016/j.csi.2006.05.002.
- Jarupathirun, S., and F. M. Zahedi. 2007. “Exploring the Influence of Perceptual Factors in the Success of Web-Based Spatial DSS.” Decision Support Systems 43 (3): 933–951. doi:10.1016/j.dss.2005.05.024.
- Järvinen, J., and H. Karjaluoto. 2015. “The Use of Web Analytics for Digital Marketing Performance Measurement.” Industrial Marketing Management 50: 117–127. doi:10.1016/j.indmarman.2015.04.009.
- Jelokhani-Niaraki, M. 2018. “Knowledge Sharing in Web-Based Collaborative Multicriteria Spatial Decision Analysis: An Ontology-Based Multi-Agent Approach.” Computers, Environment and Urban Systems 72: 104–123. doi:10.1016/j.compenvurbsys.2018.05.012.
- Jelokhani-Niaraki, M., and J. Malczewski (2012). “A User-Centered Multicriteria Spatial Decision Analysis Model for Participatory Decision Making: An Ontology-Based Approach.” Proceedings of Global Geospatial Conference, Québec City, Canada, May 14–17.
- Jelokhani-Niaraki, M., and J. Malczewski. 2015a. “Decision Complexity and Consensus in Web-Based Spatial Decision Making: A Case Study of Site Selection Problem Using GIS and Multicriteria Analysis.” Cities 45: 60–70. doi:10.1016/j.cities.2015.03.007.
- Jelokhani-Niaraki, M., and J. Malczewski. 2015b. “A Group Multicriteria Spatial Decision Support System for Parking Site Selection Problem: A Case Study.” Land Use Policy 42: 492–508. doi:10.1016/j.landusepol.2014.09.003.
- Jelokhani-Niaraki, M., A. Sadeghi-Niaraki, and S.-M. Choi. 2018. “Semantic Interoperability of GIS and MCDA Tools for Environmental Assessment and Decision Making.” Environmental Modelling & Software 100: 104–122. doi:10.1016/j.envsoft.2017.11.011.
- Johnson, M. P. 2001. “Decision Support for Family Relocation Decisions under the Section 8 Housing Assistance Program Using Geographic Information Systems and the Analytic Hierarchy Process.” Journal of Housing Research 12: 277–306.
- Kannan, P., and H. Li. 2017. “Digital Marketing: A Framework, Review and Research Agenda.” International Journal of Research in Marketing 34 (1): 22–45. doi:10.1016/j.ijresmar.2016.11.006.
- Khakpoor, D. B., M. Kamandari, and S. M. Hoseyni. 2017. “Study of the status of safety indicators in regional parks in Kerman.“ Geography and Territorial Spatial Arrangement 7 (22): 71–84. doi:10.22111/gaij.2017.3017.
- Kisilevich, S., D. Keim, and L. Rokach. 2013. “A GIS-based Decision Support System for Hotel Room Rate Estimation and Temporal Price Prediction: The Hotel Brokers’ Context.” Decision Support Systems 54 (2): 1119–1133. doi:10.1016/j.dss.2012.10.038.
- Komarkova, J., M. Jedlicka, and M. Hub. 2010. “Usability User Testing of Selected Web-Based GIS Applications.” Technology 24: 27.
- Kong, N., T. Zhang, and I. Stonebraker. 2015. “Evaluation of Web GIS Functionality in Academic Libraries.” Applied Geography 60: 288–293. doi:10.1016/j.apgeog.2014.11.017.
- Kummerow, M., and J. C. Lun. 2005. “Information and Communication Technology in the Real Estate Industry: Productivity, Industry Structure and Market Efficiency.” Telecommunications Policy 29 (2–3): 173–190. doi:10.1016/j.telpol.2004.12.003.
- Malczewski, J. 1999. GIS and Multicriteria Decision Analysis. New York, NY: John Wiley & Sons.
- Malczewski, J. 2006. “GIS-based Multicriteria Decision Analysis: A Survey of the Literature.” International Journal of Geographical Information Science 20 (7): 703–726. doi:10.1080/13658810600661508.
- Malczewski, J., and M. Jelokhani-Niaraki. 2012. “An Ontology-Based Multicriteria Spatial Decision Support System: A Case Study of House Selection.” Geo-Spatial Information Science 15 (3): 177–185. doi:10.1080/10095020.2012.715900.
- Malczewski, J., and C. Rinner. 2015. Multicriteria Decision Analysis in Geographic Information Science. New York: Springer.
- Meng, Y., and J. Malczewski. 2010. “Web-PPGIS Usability and Public Engagement: A Case Study in Canmore, Alberta, Canada.” URISA Journal 22 (1): 5–15.
- Natividade-Jesus, E., J. Coutinho-Rodrigues, and C. H. Antunes. 2007. “A Multicriteria Decision Support System for Housing Evaluation.” Decision Support Systems 43 (3): 779–790. doi:10.1016/j.dss.2006.03.014.
- North, J., and F. L. Miller. 2017. “Facility Location Using GIS Enriched Demographic and Lifestyle Data for a Traveling Entertainment Troupe in Bavaria, Germany.” Decision Support Systems 99: 30–36. doi:10.1016/j.dss.2017.05.007.
- Reed, C. 2011. “OGC Standards: Enabling the Geospatial Web.” In Advances in Web-Based GIS, Mapping Services and Applications, edited by L. Songnian, S. Dragicevic, and B. Veenendaal, 327–348. London: CRC Press.
- Repetto, M. P., M. Burlando, G. Solari, P. De Gaetano, M. Pizzo, and M. Tizzi. 2017. “A Web-Based GIS Platform for the Safe Management and Risk Assessment of Complex Structural and Infrastructural Systems Exposed to Wind.” Advances in Engineering Software 117: 29–45. doi:10.1016/j.advengsoft.2017.03.002.
- Roig-Tierno, N., A. Baviera-Puig, J. Buitrago-Vera, and F. Mas-Verdu. 2013. “The Retail Site Location Decision Process Using GIS and the Analytical Hierarchy Process.” Applied Geography 40: 191–198. doi:10.1016/j.apgeog.2013.03.005.
- Romano, G., P. Dal Sasso, G. T. Liuzzi, and F. Gentile. 2015. “Multi-Criteria Decision Analysis for Land Suitability Mapping in a Rural Area of Southern Italy.” Land Use Policy 48: 131–143. doi:10.1016/j.landusepol.2015.05.013.
- Saaty, T. 1980. The Analytic Hierarchy Process. New York, NY: McGraw-Hill.
- Salajegheh, J., F. Hakimpour, and A. Esmaeily. 2016. “Presenting a Spatial Model for Real Estate Appraisal Based on Data-Driven Multi-Criteria Decision-Making Methods.” Journal of Geomatics Science and Technology 6 (1): 199–213.
- Steiniger, S., and A. J. Hunter. 2013. “The 2012 Free and Open Source GIS Software map–A Guide to Facilitate Research, Development, and Adoption.” Computers, Environment and Urban Systems 39: 136–150. doi:10.1016/j.compenvurbsys.2012.10.003.
- Suárez-Vega, R., D. R. Santos-Peñate, and P. Dorta-González. 2012. “Location Models and GIS Tools for Retail Site Location.” Applied Geography 35 (1–2): 12–22. doi:10.1016/j.apgeog.2012.04.009.
- Tayyebi, A., H. Shafizadeh-Moghadam, and A. H. Tayyebi. 2018. “Analyzing Long-Term Spatio-Temporal Patterns of Land Surface Temperature in Response to Rapid Urbanization in the Mega-City of Tehran.” Land Use Policy 71: 459–469. doi:10.1016/j.landusepol.2017.11.023.
- Turk, T., O. Kitapci, and I. T. Dortyol. 2014. “The Usage of Geographical Information Systems (GIS) in the Marketing Decision Making Process: A Case Study for Determining Supermarket Locations.” Procedia-Social and Behavioral Sciences 148: 227–235. doi:10.1016/j.sbspro.2014.07.038.
- Wolf, I. D., T. Wohlfart, G. Brown, and A. B. Lasa. 2015. “The Use of Public Participation GIS (PPGIS) for Park Visitor Management: A Case Study of Mountain Biking.” Tourism Management 51: 112–130. doi:10.1016/j.tourman.2015.05.003.
- Xu, Z., and Q. Li. 2014. “Integrating the Empirical Models of Benchmark Land Price and GIS Technology for Sustainability Analysis of Urban Residential Development.” Habitat International 44: 79–92. doi:10.1016/j.habitatint.2014.04.012.
- Yalew, S., A. Van Griensven, and P. van der Zaag. 2016. “AgriSuit: A Web-Based GIS-MCDA Framework for Agricultural Land Suitability Assessment.” Computers and Electronics in Agriculture 128: 1–8. doi:10.1016/j.compag.2016.08.008.
- Yang, Y., Y. Sun, S. Li, S. Zhang, K. Wang, H. Hou, and S. Xu. 2015. “A GIS-based Web Approach for Serving Land Price Information.” ISPRS International Journal of Geo-Information 4 (4): 2078–2093. doi:10.3390/ijgi4042078.
- Yuan, X., J.-H. Lee, S.-J. Kim, and Y.-H. Kim. 2013. “Toward a User-Oriented Recommendation System for Real Estate Websites.” Information Systems 38 (2): 231–243. doi:10.1016/j.is.2012.08.004.
- Zeng, T. Q., and Q. Zhou. 2000. “Optimal Spatial Decision Making Using GIS: A Prototype of A Real Estate Geographica L Information System.” International Journal Geographical Information Science 15 (4): 307–321. (2001). doi:10.1080/136588101300304034.
- Zhang, D., P. Zhu, and Y. Ye. 2016. “The Effects of E-Commerce on the Demand for Commercial Real Estate.” Cities 51: 106–120. doi:10.1016/j.cities.2015.11.012.
- Zumpano, L. V., K. H. Johnson, and R. I. Anderson. 2003. “Internet Use and Real Estate Brokerage Market Intermediation.” Journal of Housing Economics 12 (2): 134–150. doi:10.1016/S1051-1377(03)00018-4.