
 ?Mathematical formulae have been encoded as MathML and are displayed in this HTML version using MathJax in order to improve their display. Uncheck the box to turn MathJax off. This feature requires Javascript. Click on a formula to zoom.
ABSTRACT
Hurricane activity has been increasing in frequency and severity in recent years. This has serious implications for coastal and nearby communities who, when recovering from hurricanes, seek outside assistance from relevant government, non-governmental agencies, and nearby communities. The ever-increasing popularity of social media offers a new medium through which such social relevancy can be derived to inform targeted assistance-seeking efforts. This study utilizes Twitter to develop an understanding of disaster relevancy across space and time to establish a clearer context for impacted communities as to when and where assistance may be derived. Tweets were collected for three hurricanes within the contiguous United States (Hurricane Harvey in 2017, Florence in 2018 and Laura in 2020) and examined over a 12-week period following hurricane landfalls. The relationships between tweets and time and between tweets and distance were examined through correlation analysis. Results show statistically significant time- and distance-decay effects of hurricane relevancy on social media, though the time-decay effect was stronger. Most tweets occurred during the first week following hurricane landfall within the states wherein the hurricanes made landfall as well as around large cities. These findings could inform aid-seeking efforts in the event of hurricanes and other disasters.
1. Introduction
After over two decades of little Atlantic hurricane activity in the late 1900s, the early 2000s saw an increase in hurricane activity and more than $150 billion in damage in 2004 and 2005 (Pielke et al. Citation2008). Though there has been debate regarding whether recent increases in hurricane activity are part of a larger trend or expected decadal variance, hurricane damage is expected to increase if the concentration of people and property in coastal regions continues to worsen (Smith et al. Citation2010). As it stands, the average annual normalized damage for the continental US was calculated to be $10 billion, based on 106 years of hurricane data (Pielke et al. Citation2008). This has serious implications for citizens, businesses, and the government alike. Citizens and businesses experience financial loss and, in some instances, may be unable to resume economic activity while government agencies may face difficulty in restoring government functions and physical infrastructure (Newkirk Citation2001).
Social cohesion (i.e. the accumulation of social capital) is often believed to increase community resilience from disasters. It is important both prior to a disaster event and in the months following (Phillips, David, and Webb Citation2012). However, social capital often decreases in the aftermath of a disaster due to a loss of infrastructure. Because of this, impacted communities often require outside assistance in their recovery efforts. This often comes from nearby communities that have evaded or been minimally impacted by the disaster (Ludin, Rohaizat, and Arbon Citation2019). In addition to aid from nearby communities, communities that have been impacted by a disaster may also receive aid from non-local persons, NGOs and/or the state or federal government. While aid received from NGOs, the state government, and the federal government is typically determined through an established process, this is not always the case for aid received from non-local persons.
Social theories (e.g. Social Identity Theory) suggest that individuals are more likely to assist those that occupy their ‘ingroup’ even if such persons are not a member of their local community (James and Zagefka Citation2017). With the increased popularity of social media platforms, the notion of community and ingroups has extended to online environments. Through social media, people can now forge close-knit connections online, once limited to those within close physical range or of familial relations, with individuals on a global scale. Social media data could be harnessed to enrich our understanding of communities and ingroups to inform aid-seeking efforts in times of natural disasters, even though social media users may not be representative of the underlying general population affected by disasters (Martín et al. Citation2020).
Generally, social media has proven promising as a crowdsourced or volunteered data source to facilitate disaster response and management (Feng, Huang, and Sester Citation2022; Houston et al. Citation2014; Zhang Citation2021). Social media, Twitter in particular, has been cited as being useful as a rapid means of gathering disaster-related information in real-time (Granell and Ostermann Citation2016; Joseph et al. Citation2018; Landwehr et al. Citation2016), although the use of social media data does come with its own challenges (e.g. underrepresentation of certain demographics) (Haworth Citation2016, Citation2018; Haworth and Bruce Citation2015; Zhang and Zhu Citation2018). Thus far, most disaster-related research utilizing social media has been data-centric where it was used for disaster-related information extraction, followed by application-centric where social media was used in combination with other data sources for specific disaster-related applications (e.g. damage assessment) (Feng, Huang, and Sester Citation2022; Granell and Ostermann Citation2016; Resch, Usländer, and Havas Citation2018). As the utilization of social media becomes more and more common in disaster response and management, there is predicted to be a greater shift from data-centric social media usage to application-centric and, eventually, human-centric which focuses on human mobility, relations, and perception in response to disasters (Beigi et al. Citation2016; Granell and Ostermann Citation2016; Xu and Qiang Citation2022; Yuan et al. Citation2021).
In the particular context of assistance-seeking during disasters, social media is useful both for those who are in need to ask for help and for those who are able to provide to communicate resources available through online social networks (Li et al. Citation2019; Sadri et al. Citation2018). It is reasonable to assume that aids are more likely to be obtained from parties (e.g. non-local persons) who maintain relevancy to the hurricane-impacted communities. That is, communities in need of disaster aid can generally expect to receive less aid from parties further away from the disaster, both in terms of time and physical distance. As such, utilizing social media to develop an understanding of how well disasters maintain social relevancy can help communities impacted by a disaster in managing expectations for non-local assistance by establishing a timeframe in which this assistance is most likely to occur as well as where it may be coming from. This, in turn, may inform the outreach efforts of said communities
This study aims to facilitate an understanding of how well disasters maintain relevancy across time and space. For the purpose of this study, relevancy is measured by the presence of tweets mentioning the event. The greater the number of tweets, the greater the relevancy of the event. As the number of tweets decreases, so too does the relevancy of the event. This study collected and analysed tweets related to three Category 4 hurricanes—2017 Hurricane Harvey, 2018 Hurricane Florence, and 2020 Hurricane Laura – in the US over a 12-week/3-month time period to determine:
How long the relevancy of hurricanes lasts and at what rate it decreases.
How physical distance impacts the rate at which hurricanes lose social relevancy.
Whether there is a definite distance at which hurricanes struggle to remain relevant.
Key similarities and differences in the social relevancy of the hurricanes.
By addressing the above and under the assumption it is more likely to obtain aids from people and agencies in places/times where hurricanes remain relevant, local communities impacted by hurricanes should have greater context as to where non-local assistance may be derived as well as their potential timeframe for receiving or reaching out for assistance. Additionally, this study sets out to enrich the pool of social media studies in the field of disaster response and management, particularly those concerned with a human-centric approach (Granell and Ostermann Citation2016). While past disaster-related social media studies have been primarily concerned with data preparation, contextualization, and, more recently, monitoring, coordination, and prediction of events, this study has a more human-centric approach, focusing on human activities and perception (e.g. hurricane relevancy on social media).
2. Materials and methods
2.1. Study region
The contiguous US was the study region for this study. A polygon shapefile of the US at the state level was acquired via the US Census Bureau (Citation2022c). For this project, its primary function was to define regions and act as a backdrop. Physical distance was represented by ordered impact zones reflecting varying spatial proximity to the hurricane. Zones were defined based on information from the National Weather Service (Citation2022a, Citation2022b), National Aeronautics and Space Administration (Citation2022b; Citation2022b 2022a), and US Census Bureau (Citation2022a; Citation2022c 2022b). These zones were as follows:
Primary: state(s) where the hurricane made landfall.
Secondary: state(s) that were potentially impacted (i.e. those that experienced hazardous conditions, such as strong winds, storms, flooding, etc.) by the hurricane.
Tertiary: state(s) that are adjacent to Primary and Secondary states.
Far: state(s) that are adjacent to Tertiary states.
Very Far: all other states in the contiguous US.
Zones were defined this way to account for the widespread impact of hurricanes while still recognizing the increased degree of damage present in states wherein the hurricane made landfall.
Population data at the state level was also acquired via the US Census Bureau (Citation2022d) and was used to normalize the number of tweets occurring across the zones. Additionally, a point shapefile of major US cities was acquired via the ArcGIS Hub (ArcGIS Hub Citation2022). This layer included the locations of cities within the US with populations of approximately 10,000 or greater, all state capitals, and the national capital. For this project, only cities that had a population of 500 thousand or greater were included and had the primary function of adding greater context as to where tweets occurred.
2.2. Social media posts – tweets
Twitter was chosen to be the social media site by which online discussions about the hurricanes were measured. The site debuted in 2007 and became more notable as a social media platform in 2009 not only for networking but for the dissemination of news as well. This became particularly apparent following the earthquake that struck Haiti in 2010 (Encyclopaedia Britannica Citation2021).
Twitter’s application programming interface (API) was utilized through Twitter’s academic research track (Twitter Citation2022) to acquire relevant tweets. Keywords and timeframes were specific to their respective hurricane but followed a consistent pattern pertaining to what keywords were utilized, how timeframes were defined, and from which region tweets were acquired ().
Table 1. Query parameters used to retrieve tweets via twitter API.
Only keywords that would directly reference their respective hurricane names were selected to limit potential false positives from the inclusion of indirect references, such as ‘hurricane’ or ‘flooding’ (false positives are tweets returned from searching by the keywords but are not actually about the target hurricane). Using additional keywords that are indirect references (e.g. ‘hurricane’, ‘storm’ or ‘flooding’) would hugely increase false positives. It would also be difficult to associate a tweet containing only such keywords to a particular hurricane among the three target hurricanes in this study. It was noted during the data acquisition phase that even the inclusion of the hurricane names alone (without ‘hurricane’) similarly increased the potential for false positives. However, this was outweighed by the potential for false negatives by excluding said keywords (false negatives are tweets not returned by the search but are in fact about the target hurricane). A timeframe of 12-weeks/3-months was selected to ensure coverage of the immediate aftermath of the events as well as the beginning of less immediate recovery efforts. Tweets were pulled for each hurricane separately and included both original tweets as well as retweets and quote-tweets, because a retweet or a quote-tweet can be counted as one additional mentioning of the hurricane. Harvested tweets were manually checked through keyword search and pattern match using regular expressions to exclude false positives that contain notable personalities (e.g. Harvey Weinstein, Laura Ingraham), notable groups (e.g. Florence and the Machine), places (e.g. Florence, Italy) and usernames containing the hurricane’s name (e.g. @name, _name, name_). shows the number of tweets after the removal of false positives for the three hurricanes. Among the tweets, those containing a point location (latitude, longitude) or a ‘city’, ‘neighbourhood’, or ‘poi’ Twitter place were treated as ‘geotagged’ in this study. For a retweet or a quote-tweet, its own geotag, instead of the original tweet’s geotag, was extracted. For tweets associated with a place, the centre of the place bounding box was taken as the approximate point location of that tweet for spatial analyses. shows the spatial distribution of the geotagged tweets in relation to the path or their respective hurricane.
Figure 1. Hurricane paths and the spatial distribution of hurricane-related tweets.
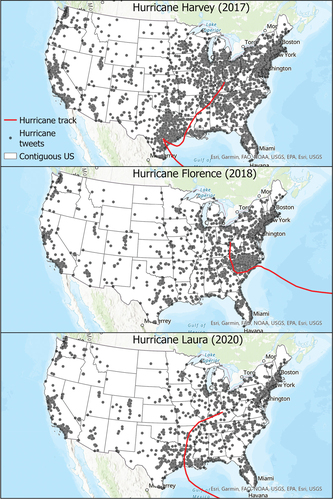
Table 2. Number of tweets for the three hurricanes after manual removal of false positives. Geotagged tweets are tweets associated with point coordinates or Twitter places (city, neighbourhood, poi).
2.3. Data analysis methods
2.3.1. Tweets and time
The impact of time on the presence of tweets pertaining to their respective hurricane was examined on both a monthly and weekly basis. The total number of tweets (geotagged + non-geotagged) was used for this analysis. To examine the temporal patterns in hurricane tweets, the rate of change (ROC) between each respective month and week was computed following Equation 1:
where t1 and t2 denote two consecutive time periods, and N is the number of tweets for a given time period.
Spearman’s rank correlation coefficient r, accompanied by statistical significance test, was used to examine the relationship between the number of tweets and time (weekly) for each hurricane. Guilford’s method was utilized for interpreting correlation strength. With this method, 0 < ⎸r⎸ < 0.2 indicates slight correlation (i.e. almost no relationship), 0.2 ≤ ⎸r⎸ < 0.4 low correlation (weak relationship), 0.4 ≤ ⎸r⎸ < 0.7 moderate correlation (substantial relationship), 0.7 ≤ ⎸r⎸ < 0.9 high correlation (strong relationship) and 0.9 ≤ ⎸r⎸ ≤ 1.0 indicated very high correlation (i.e. very strong relationship) (Tredoux and Durheim Citation2002).
2.3.2. Tweets and distance
Kernel density estimation (KDE) was utilized in identifying areas of particularly high or low tweet density as well as identify how these patterns changed each month. Only geotagged tweets were used for this analysis. The kernel density raster was overlaid with a map of the defined hurricane impact zonal regions (see Section 2.1) to contextualize whether areas of high or low density were occurring near the impact zone or further away.
To control for the impact of population on the occurrence of tweets so that the mere impact of distance can be discerned, these kernel density maps were supported by bar graphs showing the population-normalized number of tweets (i.e. tweets per 100,000 people) within each zone each month. Spearman’s rank correlation coefficient r (with statistical significance test) was again used to examine the relationship between the population-normalized number of tweets and distance for each hurricane. Distance was represented by ranked hurricane impact zones of varying spatial proximity to the hurricane (Section 2.1), wherein the larger rank number the further away the zone (i.e. Primary = 1, Secondary = 2, Tertiary = 3, Far = 4, Very Far = 5).
3. Results and discussion
3.1. The impact of time
3.1.1. Monthly view
The total number of tweets in Month 2 is significantly lower than in Month 1 for each hurricane (; ). On average, there is an 85% drop in the total number of tweets between Month 1 and Month 2, while the average ROC for Month 2 and Month 3 is much lower at −37.4%. This results in an average monthly ROC of −61.2%.
Figure 2. Comparing ROC of Tweets over Time.
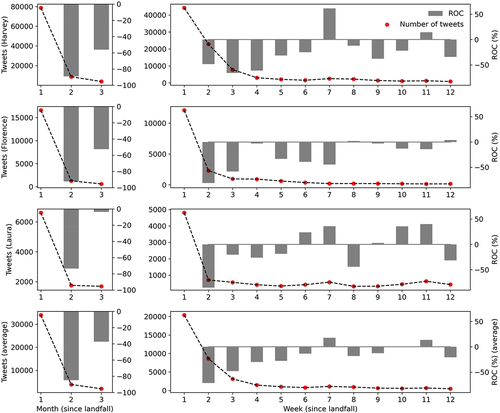
Table 3. Comparing ROC of tweets over time (monthly).
However, Hurricane Laura’s ROC values differ noticeably from Harvey and Florence. While Harvey and Florence have an average negative ROC of 72.5%, Laura has an average ROC of only −38.5%. If Hurricane Laura is removed from the dataset, the average ROC between Month 1 and Month 2 becomes −90.7% and the average ROC between Month 2 and Month 3 becomes −54.3%. This results in an average monthly ROC of −72.5%.
3.1.2. Weekly view
On average, the weekly ROC for tweets was −19.1% (). However, the largest decrease occurred between Week 1 and Week 2, an average of −71.5%. The next largest decrease occurred between Week 2 and Week 3, an average of −48%, though it is noticeably lower. In removing the ROC between Week 1 and Week 2, the number of tweets per week decreases at an average of −13.9%.
Table 4. Comparing ROC of tweets over time (weekly).
Similar to what was seen with the average monthly ROCs, the average weekly ROC for Hurricane Laura differs from Harvey and Florence, −7.9%, −23.7%, and −25.7%, respectively. If Hurricane Laura is removed from the dataset, the average weekly ROC for tweets becomes −24.7%. Given the disparity between the ROC for Week 1 and Week 2 and the remaining weekly ROCs, if this value is additionally removed, the average weekly ROC for Harvey and Florence becomes −20.7%.
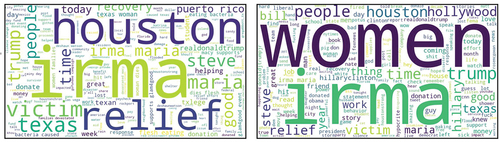
One disparity of note regarding the weekly ROC of tweets is that they varied greatly between hurricanes. For example, the ROCs between Week 2 and Week 3 are −65.7%, −58%, and −20.1% for Harvey, Florence and Laura, respectively. This limits the usefulness in examining the ROC of tweets on a weekly basis. Another disparity in the dataset occurs for the average ROCs denoted in Week 7 and Week 11 (). These weeks experienced an average increase in the number, 17.7% and 13.5%, respectively. Overall, Harvey had two instances wherein the ROC was positive (Weeks 7 & 11), Florence had two instances wherein the ROC was positive (Weeks 8 & 12), and Laura had five instances wherein the ROC was positive (Weeks 6, 7, 9, 10, & 11). Such positive ROC upticks do not necessarily reflect true trends, but instead were due to remaining false-positive tweets. For example, the significant increase in Hurricane Harvey (landfall on 25 August) tweets in Week 7 coincides with intense media reporting of the Harvey Weinstein scandal in October 2017. Despite the manual removal of obvious false positives (Section 2.2), many of the remaining tweets in that week may be related to the scandal instead of the hurricane (e.g. high frequencies of ‘women’ and ‘hollywood’ in word clouds of the tweets in ).
Figure 3. Word clouds of Hurricane Harvey tweets in Weeks 6 (left) and 7 (right) (the words “hurricane” and “harvey” were removed).
Each of the hurricanes generally experienced a loss in the total number of tweets from week to week up until about Week 6 (). After this point, there is much fluctuation between the ROC values, though from Week 7 onward (i.e. Month 3), they appear confined between the −20% to + 20%.
3.1.3. Correlation analysis
Correlation between the number of tweets and time was analysed at the weekly level (i.e. number of weeks since hurricane landfall). Hurricanes Harvey and Florence displayed a very high (|r| ≥ 0.9) and statistically significant correlation (p-value <0.05) between the number of tweets and time, while Laura displayed a weak and non-significant correlation (0.2 ≤ ⎸r⎸ < 0.4) ().
Table 5. Correlation between weekly tweet totals and time (Weeks 1–12).
Considering that the ROC between Week 1 and Week 2 was noticeably larger than the ROC between the other weeks, correlation analysis was also conducted with the removal of Week 1 data (). Hurricanes Harvey and Florence continued to display a very high and significant correlation, while the correlation coefficients dropped slightly. Laura’s correlation coefficient also dropped, and it remained non-significant.
Table 6. Correlation between weekly tweet totals and time (Weeks 2–12).
The above correlation analyses both show negative correlation between the number of tweets and the number of weeks since hurricane landfall, indicating a strong time-decay effect of hurricane relevancy on Twitter.
3.2. The impact of distance
3.2.1. KDE analysis
As reflected in the kernel density maps () and their respective bar charts (), there is a sharp decrease in the number of tweets between Month 1 and Month 2. After Month 1, the density values become smaller overall, particularly outside of the Primary impact zone and away from major US cities. This continues into Month 3, though Hurricane Laura presented an anomaly wherein the New York region exhibits a higher density during Month 3 than Month 2 even as other areas, including those in the Primary zone decrease.
Figure 4. Kernel density maps of hurricane Harvey tweets over time.
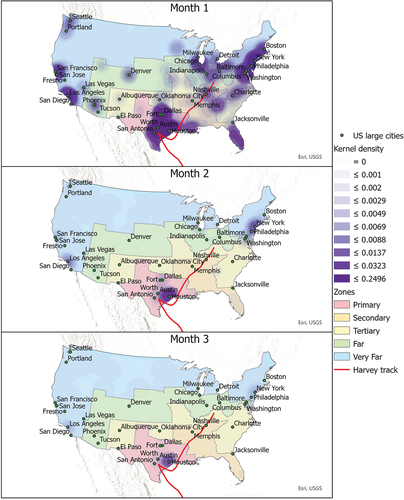
Figure 5. Kernel density maps of hurricane Florence tweets over time.
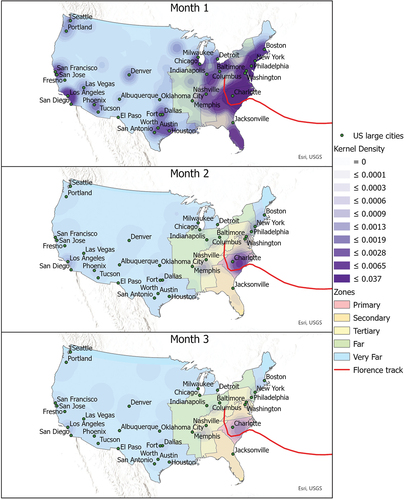
Figure 6. Kernel density maps of hurricane Laura tweets over time.
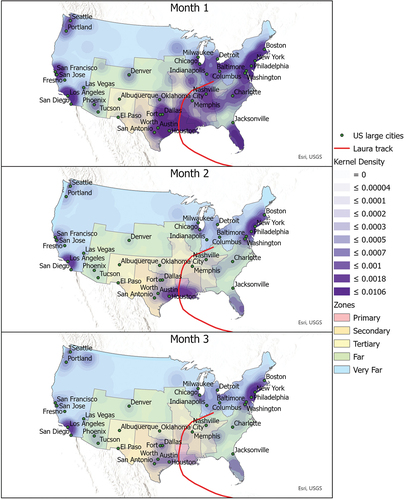
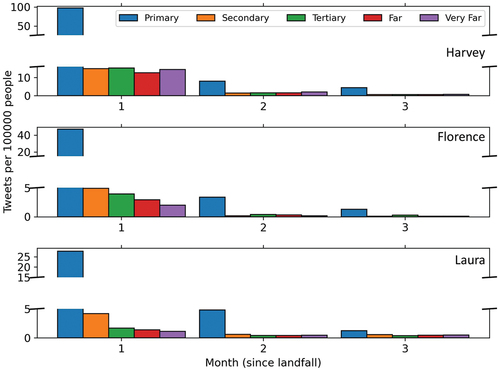
Figure 7. Tweets per 100,000 people by zone over time.
Cities that showed consistently high, or comparatively high, density values regardless of month included Houston, New York City, and Los Angeles. This is unsurprising given the high population density of these cities and the general expectation that more people equate to more people tweeting. Overall, regions that consistently showed higher density values included Southern California, the Pacific Northwest, Texas, Florida, the South, the Rust Belt, and the Mid-Atlantic. Regions that consistently showed lower density values included the Midwest/Great Plains, the Deep North, the Rocky Mountains, and the Southwest/Sun Belt. Overall, the eastern half of the US displayed higher densities than the Western half.
3.2.2. Tweets by zone
Though the kernel density maps showed a high density of people tweeting about the hurricanes in many areas outside of the Primary zone, a greater rate of tweets (i.e. number of tweets per 100,000 people) occurred in the Primary zone each month (). The overall trend was that the further away from the area most impacted by the hurricane, the lower rate of hurricane-related tweets. As for ROC in the rate of tweets, people in all zones appeared to lose attention on hurricanes rapidly at a decreasing rate of 65−70% ().
Table 7. Average ROC of tweets per 100,000 people (all hurricanes) over time by zone.
3.2.3. Correlation analysis
For computing Spearman’s rank correlation coefficient between the population-normalized number of tweets and distance, the normalized number of tweets were ascribed a rank number relative to the other values in the list. This was done in ascending order at the state level; the greater the number of tweets per 100,000 people, the greater the rank of that state. The rank of the hurricane impact zone where the state resides was used as the distance rank of the state (i.e. Primary = 1, Secondary = 2, Tertiary = 3, Far = 4, Very Far = 5). All three hurricanes displayed a statistically significant low/moderate and negative correlation between the number of tweets per 100,000 people and distance (i.e. states in zones further away had lower rate of tweets (). The results show there is an obvious distance-decay effect in hurricane relevancy on Twitter.
Table 8. Correlation between the number of tweets (per 100,000 people) and distance.
4. Conclusion
This study examines how relevancy of a hurricane on social media varies over time and across space by analysing tweets mentioning three hurricanes in the US. Results show a strong time-decay effect in hurricane relevancy on social media after hurricane landfall (except for Hurricane Laura). On a more macro-scale, the total number of tweets mentioning a hurricane sharpy decreased from the first month in the aftermath of a hurricane to the second. On average, the total number of tweets dropped by about 85%. On a more micro-scale, it was found that, within the first month, the total number of tweets decreased, on average, by about 72% from the first week to the second. This implies an immediacy in the need to take advantage of online discussion while they are happening, lest attention be diverted elsewhere. When the first week was excluded from the correlative analysis, the correlation strength between the number of tweets and time decreased. Hurricane Laura, most likely due to excessive false-positive tweets (), does not show a statistically significant correlation number of tweets and time, potentially indicating that smaller hurricanes are less reliable datasets when studying online activity.
Table 9. Comparison of the true positive rate (TPR) and its 95% confidence interval (CI) of hurricane tweets based on random samples of tweets (n = 200) taken from the original tweets, tweets after manual cleaning, and excluded tweets on each hurricane.
There is also a distance-decay effect in hurricane relevancy on social media. The further a region was from the impact zone, the fewer tweets per 100,000 people it was likely to have, although the ROC in rate of tweets by month did not appear significantly impacted by zone beyond the Primary zone. While the Primary zone commonly has the greatest number of tweets per 100,000 people, followed by Second zone and Tertiary zone, the Very Far zone could have a higher rate of tweets than the Far zone. This may be due to the increased chance for having large cities. New York City and Los Angeles, for example, which consistently showed higher tweet densities, were always within the Very Far zones. In this regard, the kernel density maps may be more informative. They showed that, despite the statistical significance of distance on the rate of tweets, the highest density of tweets most consistently occurred in the Primary impact zone and around large cities.
In conjunction, the above time- and distance-decay effects in hurricane relevancy on social media suggest that impacted communities may be more likely to find and receive assistance from communities located in their very own state or from nearby cities with a large population right after hurricane landfalls (e.g. within 1 week), under the assumption that the higher social media users maintain hurricane relevancy online the more likely to obtain aids from them. This exemplifies an intersection of Tobler’s (Citation1970) observation that ‘near things are more related than distant things’ (e.g. a high density of tweets occurred within the Primary zone) and Zipf’s (Citation1949) observation that large places have a greater influence than small places (e.g. a high density of tweets occurred around particularly large cities) (Cresswell Citation2013; Zhang Citation2020).
Although time- and distance-decay effects of hurricane relevance on social media uncovered here seem expectable by common sense or from previous studies (Gong et al. Citation2022; Han, Tsou, and Clarke Citation2018), this empirical study still contributes to enriching disaster-related social media studies. Existing studies have been data-centric and primarily concerned with disaster information extraction and monitoring. This empirical study represents a human-centric perspective to disaster-related social media studies by revealing the spatiotemporal patterns of human perception on hurricanes (e.g. hurricane relevancy on social media), which can be instrumental for hurricane-impacted communities to gain necessary resources for recovery.
Future research could build upon these findings to help hurricane-affected communities seek outside aid and assistance for recovery. The tweet density maps suggest some degree of leeway during the first month, given the widespread degree of high densities, particularly in the eastern half of the US. However, this did not examine density fluctuations within the first month, so it is unclear how quickly high densities consolidate further around major US cities beyond the aforementioned estimate of 1 week. As such, future research should focus on examining the social relevancy of hurricanes in their aftermath within this first month.
Moreover, detecting communities on social network can facilitate aid seeking efforts. Attempts have been made to detect and understand how communities form and function on social media, and community detection methods have found meaningful applications in the detection and tracking of events online, such as the outbreak of disease or the occurrence of a natural disaster (Bakillah, Li, and Liang Citation2015; Papadopoulos et al. Citation2012), as seen with the identification of communities that were formed via Twitter in relation to Typhoon Haiyan. It was found that detected communities were exchanging information about such things as damages and casualties as well requesting aid (Bakillah, Li, and Liang Citation2015). However, another matter that has complicated the topic lies in predicting human behaviour in crisis. Past studies have found that what and how much a person decides to donate to those impacted by a disaster is not always determined through a rational process, as exemplified by the tendency of donors to donate more when they are focused on a single, identifiable victim rather than a cause at large (James and Zagefka Citation2017). Furthermore, as discussed prior, it was noted that people preferred to help those they considered to be part of their ingroup. It was also found that the actions of other ingroup members also played a role in the likelihood of an individual donating or volunteering, particularly those with high public self-consciousness. However, when it came to donating or volunteering for a stigmatized cause, it was found that ingroup participation only increased the likelihood of participation among those with low public self-consciousness (Jeong Citation2020). Though disaster events are not usually considered to be stigmatized, bias against those impacted may lead members of a group to stigmatize a disaster, thus reducing their likelihood to donate or volunteer.
5. Limitations
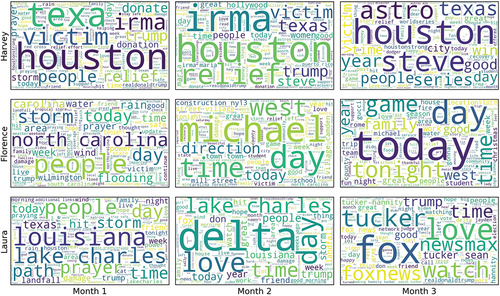
The largest limitation to this study was with how people discussed the disasters. Given that the keywords in the query pulled for the two variations of each hurricane’s name, posts that referred to the event indirectly were missed. Furthermore, while the data was manually combed for false positives with preliminary search and delete, it is unlikely that every false positive was caught either because they failed to be identified or they contained typos or irregular capitalization. Other false positives, such as overlap with an individual’s name, were also difficult to control for even with the removal of usernames containing the name. To this end too, however, there was the potential for the removal of true positives in such instances as someone discussing the hurricane whilst sharing its namesake. Of the three hurricanes, it is likely that Hurricane Laura suffered the most from this limitation given that its name is more common than the other two. For the original hurricane tweets, tweets after cleaning (manual removal of false positives), and excluded tweets on each hurricane, a random sample of n = 200 tweets was taken from each dataset. Each tweet in the sample was manually examined to determine whether it is relevant to the target hurricane. True positive rate (TPR; the percentage of tweets that were in fact about the target hurricane among all tweets in a sample) and its 95% confidence interval were then computed for each sample of tweets (). Results show that, in the original tweets, Hurricanes Harvey and Florence have a much higher provenance (TPR = 74.5% and 69%, respectively) than Laura (23.5%). Accordingly, for Harvey and Florence, a larger percentage of true positives were mistakenly excluded during the manual cleaning stage (7.5% and 1.5%, respectively). Nonetheless, amongst the cleaned tweets used for analysis in this study, over 80% of tweets are in fact relevant to Hurricanes Harvey and Florence, whilst tweets for Hurricane Laura were less reliable (only 49% are hurricane-related tweets). It was also evidenced by the overall high frequencies of hurricane-unrelated words in Hurricane Laura tweets (e.g. fox, tucker, foxnews and newsmax) compared to the other two hurricanes (). As such, it is recommended that future research on the topic spend more time analysing key hashtags related to the event(s), such as conducting an initial pull of tweets that included more indirect references to the event (e.g. hurricane, storm, flooding), identifying the most common hashtags utilized related to the event, and then removing tweets lacking said hashtags (Huang and Xiao Citation2015). Adopting deep learning for more accurately identifying hurricane relevant tweets is also worth exploring (Sit, Koylu, and Demir Citation2019).
Figure 8. Word clouds of hurricane tweets (cleaned) over time. Names of the three hurricanes and the word “hurricane” were removed prior to generating the word clouds.
Another potential limitation had to do with the fact that most geotagged tweets do not have precise point location. Instead, they are associated with Twitter places (country, state, city, neighbourhood, poi), each represented by a bounding box in the retrieved tweets. In that case, the centre of the bounding box was extracted as the approximate point location of a tweet. Such location errors may introduce uncertainties into subsequent spatial analyses. Nonetheless, the impact should be insignificant given that the spatial analyses were performed at very large spatial scales, e.g. kernel density estimation over the whole US, and correlation analysis based on state-level tweet rates.
Other limitations were directly related to the decision to only pull data from Twitter and the limitations of its userbase. Within the US, Twitter had a predominantly young, white, democratic/democratic-leaning userbase that also tended to have higher education and income levels than the average US citizen (Pew Research Center Citation2019). As such, it may be inferred that the results of the study most closely reflect the social relevancy of the hurricanes for that specific audience, while other more vulnerable demographics, such as those who have lower incomes or are particularly young or old, may not be well reflected in the research results.
Finally, though all three hurricanes reached Category 4, the impression each made on the online sphere was very different. As seen in , there was great disparity in the total number of tweets for each hurricane. While this potentially meant greater generalizability in the results, it also limited that ability of the study to identify social behaviours specific to hurricanes of a certain size.
Author Contributions
Conceptualization, methodology, data curation, analysis, writing – original draft preparation, and revision, M.K.; supervision, methodology, data analysis, writing – review, editing, and revision, G.Z; data curation, data analysis, writing – review, editing, and revision, J.X. All authors have read and agreed to the published version of the manuscript.
Acknowledgements
We greatly appreciate Dr. Jing Li and Dr. Kristopher Kuzera for their invaluable input to this research project. We also thank the anonymous reviewers for their constructive comments that helped improve the manuscript.
Disclosure statement
No potential conflict of interest was reported by the author(s).
Additional information
Funding
References
- ArcGIS Hub. (2022). USA Major Cities. Retrieved from https://hub.arcgis.com/datasets/esri::usa-major-cities/explore.
- Bakillah, M., R. Li, and S. Liang. 2015. “Geo-Located Community Detection in Twitter with Enhanced Fast-Greedy Optimization of Modularity: The Case Study of Typhoon Haiyan.” International Journal of Geographical Information Science 29 (2): 258–279. https://doi.org/10.1080/13658816.2014.964247.
- Beigi, G., X. Hu, R. Maciejewski, and H. Liu. 2016. “An Overview of Sentiment Analysis in Social Media and Its Applications in Disaster Relief.” Studies in Computational Intelligence 639:313–340. https://doi.org/10.1007/978-3-319-30319-2_13.
- Cresswell, T. 2013. Geographic Thought: A Critical Introduction. Chichester, UK: Wiley-Blackwell.
- Encyclopaedia Britannica. (2021). Twitter: Microblogging Service. Accessed March 19, 2021, from https://www.britannica.com/topic/Twitter.
- Feng, Y., X. Huang, and M. Sester. 2022. “Extraction and Analysis of Natural Disaster-Related VGI from Social Media: Review, Opportunities and Challenges.” International Journal of Geographical Information Science 36 (7): 1275–1316. https://doi.org/10.1080/13658816.2022.2048835.
- Gong, X., S. Peng, Y. Lu, S. Wang, X. Huang, and X. Ye. 2022. “Social Network Analysis of Nonprofits in Disaster Response: The Case of Twitter During the COVID-19 Pandemic in the United States.” Social Science Computer Review 1–26. https://doi.org/10.1177/08944393221130674.
- Granell, C., and F. Ostermann. 2016. “Beyond Data Collection: Objectives and Methods of Research Using VGI and Geo-Social Media for Disaster Management.” Computers, Environment and Urban Systems 59:231–243. https://doi.org/10.1016/j.compenvurbsys.2016.01.006.
- Han, S. Y., M. H. Tsou, and K. C. Clarke. 2018. “Revisiting the Death of Geography in the Era of Big Data: The Friction of Distance in Cyberspace and Real Space.” International Journal of Digital Earth 11 (5): 451–469. https://doi.org/10.1080/17538947.2017.1330366.
- Haworth, B. 2016. “Emergency Management Perspectives on Volunteered Geographic Information: Opportunities, Challenges and Change.” Computers, Environment & Urban Systems 57:189–198. https://doi.org/10.1016/j.compenvurbsys.2016.02.009.
- Haworth, B. 2018. “Implications of Volunteered Geographic Information for Disaster Management and GIScience: A More Complex World of Volunteered Geography.” Annals of the American Association of Geographers 108 (1): 226–240. https://doi.org/10.1080/24694452.2017.1321979.
- Haworth, B., and E. Bruce. 2015. “A Review of Volunteered Geographic Information for Disaster Management.” Geography Compass 9 (5): 237–250. https://doi.org/10.1111/gec3.12213.
- Houston, J. B., J. Hawthorne, M. F. Perreault, E. H. Park, M. G. Hode, M. R. Halliwell, S. E. Turner McGowen, et al. 2014. “Social Media and Disasters: A Functional Framework for Social Media Use in Disaster Planning, Response, and Research.” Disasters 39 (1): 1–22. https://doi.org/10.1111/disa.12092.
- Huang, Q., and Y. Xiao. 2015. “Geographic Situational Awareness: Mining Tweets for Disaster Preparedness, Emergency Response, Impact, and Recovery.” ISPRS International Journal of Geo-Information 4 (3): 1549–1568. https://doi.org/10.3390/ijgi4031549.
- James, T. K., and H. Zagefka. 2017. “The Effects of Group Memberships of Victims and Perpetrators in Humanly Caused Disasters on Charitable Donations to Victims.” Journal of Applied Social Psychology 47 (8): 446–458. https://doi.org/10.1111/jasp.12452.
- Jeong, H. J. 2020. “The Roles of Self-Identity Cues and Public Self-Consciousness in Volunteering for Socially Stigmatized Causes on Social Media.” Journal of Nonprofit & Public Sector Marketing 32 (1): 47–72. https://doi.org/10.1080/10495142.2019.1689221.
- Joseph, J., K. Dev, A. P. Pradeepkumar, and M. Mohan. 2018. “Big Data Analytics and Social Media in Disaster Management.” Integrating Disaster Science and Management 287–294. https://doi.org/10.1016/B978-0-12-812056-9.00016-6.
- Landwehr, P., W. Wei, M. Kowalchuck, and K. Carley. 2016. “Using Tweets to Support Disaster Planning, Warning and Response.” Safety Science 90:33–47. https://doi.org/10.1016/j.ssci.2016.04.012.
- Li, J., K. K. Stephens, Y. Zhu, and D. Murthy. 2019. “Using Social Media to Call for Help in Hurricane Harvey: Bonding Emotion, Culture, and Community Relationships.” International Journal of Disaster Risk Reduction 38 (June): 101212. https://doi.org/10.1016/j.ijdrr.2019.101212.
- Ludin, S. M., M. Rohaizat, and P. Arbon. 2019. “The Association Between Social Cohesion and Community Disaster Resilience: A Cross‐Sectional Study.” Health & Social Care in the Community 27 (3): 621–631. https://doi.org/10.1111/hsc.12674.
- Martín, Y., S. L. Cutter, Z. Li, C. T. Emrich, and J. T. Mitchell. 2020. “Using Geotagged Tweets to Track Population Movements to and from Puerto Rico After Hurricane Maria.” Population and Environment 42 (1): 4–27. https://doi.org/10.1007/s11111-020-00338-6.
- National Aeronautics and Space Administration. (2022a). Harvey Atlantic Ocean. Retrieved from https://www.nasa.gov/feature/goddard/2017/harvey-atlantic-ocean.
- National Aeronautics and Space Administration. (2022b). Laura Makes Landfall. Retrieved from https://earthobservatory.nasa.gov/images/147180/laura-makes-landfall.
- National Weather Service. (2022a). Major Hurricane Harvey August 25-29 2017. Retrieved from https://www.weather.gov/crp/hurricane_harvey.
- National Weather Service. (2022b). Hurricane Florence. September 14, 2018. Retrieved from https://www.weather.gov/ilm/HurricaneFlorence.
- Newkirk, R. T. 2001. “The Increasing Cost of Disasters in Developed Countries: A Challenge to Local Planning and Government.” Journal of Contingencies & Crisis Management 9 (3): 159–170. https://doi.org/10.1111/1468-5973.00165.
- Papadopoulos, S., Y. Kompatsiaris, A. Vakali, and P. Spyridonos. 2012. “Community Detection in Social Media.” Data Mining and Knowledge Discovery 24 (3): 515–554. https://doi.org/10.1007/s10618-011-0224-z.
- Pew Research Center. (2019). Sizing Up Twitter Users. Retrieved from https://www.pewresearch.org/internet/2019/04/24/sizing-up-twitter-users/.
- Phillips, B., N. David, and G. Webb. 2012. Introduction to Emergency Management. Boca Raton: Taylor & Francis Group.
- Pielke, R. A., J. Gratz, C. W. Landsea, D. Collins, M. A. Saunders, and R. Musulin. 2008. “Normalized Hurricane Damage in the United States: 1900–2005.” Natural Hazards Review 9 (1): 29–42. https://doi.org/10.1061/(ASCE)1527-6988(2008)9:1(29).
- Resch, B., F. Usländer, and C. Havas. 2018. “Combining Machine-Learning Topic Models and Spatiotemporal Analysis of Social Media Data for Disaster Footprint and Damage Assessment.” Cartography and Geographic Information Science 45 (4): 362–376. https://doi.org/10.1080/15230406.2017.1356242.
- Sadri, A. M., S. Hasan, S. V. Ukkusuri, and M. Cebrian. 2018. “Crisis Communication Patterns in Social Media During Hurricane Sandy.” Transportation Research Record 2672 (1): 125–137. https://doi.org/10.1177/0361198118773896.
- Sit, M. A., C. Koylu, and I. Demir. 2019. “Identifying Disaster-Related Tweets and Their Semantic, Spatial and Temporal Context Using Deep Learning, Natural Language Processing and Spatial Analysis: A Case Study of Hurricane Irma.” International Journal of Digital Earth 12 (11): 1205–1229. https://doi.org/10.1080/17538947.2018.1563219.
- Smith, D. M., R. Eade, N. J. Dunstone, D. Fereday, J. M. Murphy, H. Pohlmann, and A. A. Scaife. 2010. “Skillful Multi-Year Predictions of Atlantic Hurricane Frequency.” Nature Geoscience 3 (12): 846–849. https://doi.org/10.1038/ngeo1004.
- Tobler, W. R. 1970. “A Computer Movie Simulating Urban Growth in the Detroit Region.” Economic Geography 46: 234. https://doi.org/10.2307/143141.
- Tredoux, C. T., and K. Durheim. 2002. Numbers, Hypotheses and Conclusions: A Course in Statistics for the Social Sciences. Cape Town: UCT Press.
- Twitter. (2022). Academic Research Access. Retrieved from https://developer.twitter.com/en/products/twitter-api/academic-research.
- US Census Bureau. (2022a). 2018 Hurricane Florence. Retrieved from https://www.census.gov/topics/preparedness/events/hurricanes/florence.html.
- US Census Bureau. (2022b). 2020 Hurricane Laura. Retrieved from https://www.census.gov/topics/preparedness/events/hurricanes/laura.html.
- US Census Bureau. (2022c). Cartographic Boundary Files – Shapefile. Retrieved from https://www.census.gov/geographies/mapping-files/time-series/geo/carto-boundary-file.html.
- US Census Bureau. (2022d). TIGER/Line Shapefiles. Retrieved from https://www.census.gov/geographies/mapping-files/time-series/geo/tiger-line-file.html.
- Xu, J., and Y. Qiang. 2022. “Analysing Information Diffusion in Natural Hazards Using Retweets - a Case Study of 2018 Winter Storm Diego.” Annals of GIS 28 (2): 213–227. https://doi.org/10.1080/19475683.2021.1954086.
- Yuan, F., M. Li, R. Liu, W. Zhai, and B. Qi. 2021. “Social Media for Enhanced Understanding of Disaster Resilience During Hurricane Florence.” International Journal of Information Management 57:102289. https://doi.org/10.1016/j.ijinfomgt.2020.102289.
- Zhang, G. 2020. “Spatial and Temporal Patterns in Volunteer Data Contribution Activities: A Case Study of eBird.” ISPRS International Journal of Geo-Information 9 (10): 597. https://doi.org/10.3390/ijgi9100597.
- Zhang, G. 2021. “Volunteered Geographic Information.” In Geographic Information Science & Technology Body of Knowledge, edited by J. P. Wilson. https://doi.org/10.22224/gistbok/2021.1.1.
- Zhang, G., and A. X. Zhu. 2018. “The Representativeness and Spatial Bias of Volunteered Geographic Information: A Review.” Annals of GIS 24 (3): 151–162. https://doi.org/10.1080/19475683.2018.1501607.
- Zipf, G. K. 1949. Human Behavior and the Principle of Least Effort. Cambridge, MA: Addison Wesley Press.