
Abstract
The Douro river basin, in north-eastern Portugal, is a very complex region in terms of its geomorphological structure and morphodynamics. More specifically, the region – the Port Wine-growing region, a UNESCO heritage site – is a landslide-prone area resulting from several factors intrinsic to the bedrock and its detritic cover, combined with factors capable of triggering slope instability mechanisms, such as intense rainfall and human activities. Recently, due to intense rainfall and human activities, frequent rock and mud slides occurred, some of them catastrophic, killing people and damaging property. In the last decade (2000–2010), an accurate inventory of these catastrophic events was made, showing that these events occurred near local small towns, Peso da Régua (2001), Armamar (2003) and Carrazeda de Ansiães (2007). In this paper, we present a case study using field data and Geographic Information Systems (GIS) tools to evaluate landslide hazard and risk assessment following multicriteria evaluation techniques.
1. Introduction
Formally declared as the International Decade for National Disaster Reduction (IDNDR), the 1990s became a byword for the UN-ISDR (United Nations-International Strategy for Disaster Reduction). There was a renewed awareness of the importance of changing behaviours from a culture of reaction to a culture of prevention, seen as the primary condition for populations worldwide to be able to mitigate risks and to prevent crises by increasing resilience against the consequences, sometimes catastrophic, of natural disasters.
The Douro river basin, in north-eastern Portugal, is a very complex region in terms of its geomorphology. The presence of very deep slopes, the terraced structure of the Port Wine-growing region (UNESCO heritage) and the local climatic and meteorological conditions have been considered as core factors to understand the increasing frequency of slope instability phenomena. The latter became particularly serious since the 2000–2001 winter season. The attention we have been paying to this region has enabled us to test diverse methods for hazard and risk mapping, using the standards of GIS platforms and tools. A very accurate field survey gave us a qualitative knowledge of the region, but it also provided us with the required field data for a landslide inventory, which eventually was to be overlaid using GIS geoprocessing tasks that involved the analysis of thematic layers (lithology, slope angle and aspect, tectonic features, drainage and land use), as explained later in this paper.
Depending on their scientific background, different authors adopt different models and techniques for risk analysis. Among them, we find the latest trends in GIS-based risk analysis models, like the weights-of-evidence (WE) model or the probabilistic slope stability analysis (PSSA) model. It is our belief that the processing of data relating to the zoning of landslide risk based on multicriteria analysis should incorporate both quantitative and empirical (qualitative) data. In view of this, the approach used in the present study is drawn from the model introduced by Soeters and Van Westen Citation(1996) and later reviewed and updated by Van Westen et al. Citation(1997). This model shows a high degree of consistency and accuracy and has been validated by the results of a number of instances where it was successfully implemented, namely in Cuba – see ‘Generation of a landslide risk index map for Cuba using spatial multicriteria evaluation’ (Abella & Van Westen Citation2007). We strongly feel that for the purposes of this paper we have made use of one of the most reliable methods available for modeling landslide hazard and risk. The present paper is thus an attempt to apply a reliable methodology in order to assess and map hazard and risk by indexing the distribution of slope movements according to the natural logarithm of their density. As mentioned above, the method has already been tested by other authors for two parametric variables (lithology and slopes). Although the literature tends to use the phrase Landslide Index method (LIm), it will be referred to as Logindex method (Lm) for the purposes of this paper. Besides the above-mentioned goal with respect to assessing and drawing a map of landslide movements, it is also our intention to discuss and draw attention to some of the problems arising from the automatic tasks used in the Quantitative Risk Assessment (QRA) process. Basically, the problems had to do with the outputs and the interpretation of results, with graphic and cartographic representation and with the alphanumeric codes attributed to the tasks, which means that the GIS expert had to exercise his good judgement and always proceed with extreme caution. Our training in and sensitivity to physical geography, namely in the domain of land use and planning, helped us realize that without field work one cannot access the main source of information for processing data and generate hazard and risk maps. That is why we think that the field survey is the foundation we must always return to whenever we are assailed by doubt and indecision.
Therefore, our approach aims to take into due account the relevance of the concept of vulnerability in the context of the Alto Douro (upper Douro) Wine-growing region. The method we propose involves some key factors whose behaviour affects slope stability and the interactions, both diffuse and complex, between them and some other factors, mainly those that may trigger slope instability and lead to mass movements. In a word, our proposal consists of a simple but coherent methodology for zoning hazard, vulnerability and risk, and aims to provide a useful and catalytic tool for land planning in Portugal's north-eastern region.
2. Study area
The study area is a particularly significant section of the Douro river basin (). Enclosed by ridges of hills and plateaus, its meandering course defines gullies that are sometimes very deep, narrow and straight, showing the important role of the late Hercynian strike-slip faults. Given the harshness of many of the scarped slopes and the fact that they seem relatively recent, the horizontal movement of tectonic blocks must have resulted from the quaternary reactivation of older accidents, deep in the Hercynian socle (the Maciço Hespérico). This is reflected at the surface in the definition of a generally similar orientation, typical of the main tributary river valleys in the Portuguese section of the Douro river basin. A proper understanding of the complex process leading to the (re)organization of the Douro river during the quaternary period, especially with regard to its pre-estuarine segment – which must have witnessed a series of catchments of the lower sections of its main tributaries, combined with a rapid encasing of the river basin, through processes that evince lack of adaptation to the structure – should be crucial for an adequate understanding of the morphology of the Portuguese section of the Douro river basin at present. However, when seen in detail, the slopes and the highly pronounced river bends and their deep elbows suggest a typical process of fluvial adaptation to the structure, throughout the dense net of tectonic fractures and faults that affects the granite massifs. This is a geomorphological feature that also characterizes those areas with outcrops, mostly of quartzite, Silurian and Ordovician metasediments, as well as metamorphic ridges derived from the greywacke–schist complex.
Figure 1. Localization of the study area (Douro river basin – north-eastern Portugal).
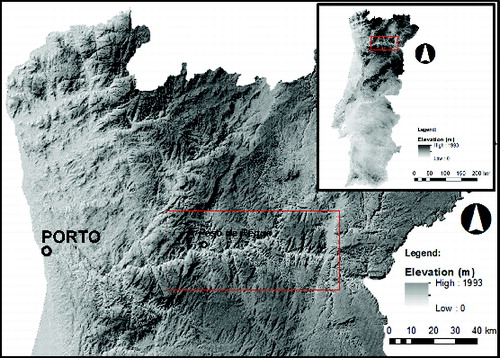
The Port Wine-growing region is the area we chose as the object of our study, even though originally the research aimed to cover a larger area. Based on the systematic recording of morphometric and morphodynamic data of the slopes in the study area, our field observations showed a clear connection between the most unstable sections of the slopes and the presence of terraces, which are predominantly taken up by vineyards.
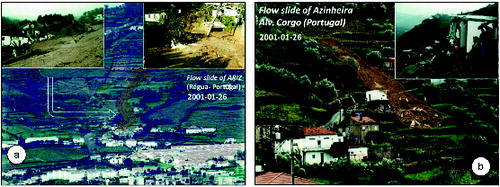
The sudden seasonal floods, which affect the floodplains of the Douro river and its main tributaries, are the principal reason why people abandoned the floodplains of the Peso da Régua region (a small but very important town where Port Wine is produced), in an attempt to find, on the slopes of nearby mountains, the space, peace and security that, in practice, they would never achieve, because other vulnerabilities have thus been created, resulting in situations of geomorphological hazards and risks. These conditions may be brought about by changes to the morphodynamic equilibrium of the slope systems, or by the occupation, with new buildings and facilities, of the areas around the foot of the slopes. Even if not immediately perceived, the geomorphological hazard may eventually expose the populations to the consequences of instability unleashed on the slope areas located upstream. These may have been unstable slopes to start with, or instability may have manifested itself only after human occupation and intervention; in either case, the additional susceptibility and its effect in terms of increasing the vulnerability of the region tend to augment the exposure of people to risk. Fortunately, however, these conditions do not always develop into crises like the catastrophic episodes of January 2001, near Peso da Régua and Santa Marta de Penaguião (), two flow slides that led to the loss of four lives and caused enormous damage to property.
Figure 2. (a) Peso da Régua flow slide; (b) Alvações do Corgo–Santa Marta de Penaguião flow slide.
Human activities, from ancestral ways of life associated with viticulture and wine production to those related to the recent process of urban expansion and tourism development, are an obvious, almost ubiquitous presence in this Portuguese region. Consequently, demographic pressure on metastable areas, combined with human interference on the natural processes of external geodynamic action, led to significant morphological and morphodynamic changes in the slopes, exposing new hazards. The dominant feature of the landscape, which influences the slope morphodynamics, consists of the terraced structure of the vineyards – the socalcos. As has been well documented in other studies (Brancucci & Paliaga Citation2006), this is of particular relevance in Mediterranean environments. In fact, the exposure of people and goods, over time and space, to these very hazards has originated new vulnerabilities and risks, and the Port Wine-growing region has been considered particularly vulnerable and susceptible to landslides, whose destructive potential became particularly striking after the autumn–winter of 2000–2001.
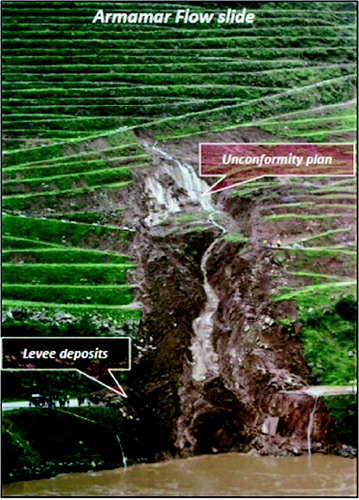
Very close to this area, but on the left bank of the Douro river, new manifestations of slope instability were felt in 2003. A case in point was the Armamar flow slide (), which produced high damage but fortunately did not involve any victims. The location of this landslide shows the importance of the terraced structure of the landscape as a factor of increasing vulnerability in this type of event, and it constitutes major evidence of the accuracy of our claims regarding the need to develop landslide hazard and risk maps for this region.
Figure 3. Flow slide of Armamar (January 2003).
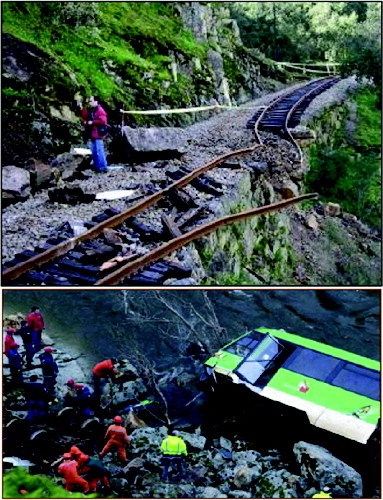
In 2007 (), albeit in a different morphostructural context, but just a few miles upstream from Peso da Régua, another catastrophic event took place. Well documented in previous studies (Santos et al. Citation2007/2008), this slope movement was of a complex nature, because it involved more than one process simultaneously. A sudden and very fast flow slide led to a complex slope movement which involved earth and debris materials, dragging downstream a considerable amount of large granite boulders that crossed a steep slope of the Tua river (a tributary of the Douro) and destroyed a railway line. A few minutes after this occurrence, a small train connecting local villages was derailed, killing three of its occupants.
Figure 4. Complex slope movement affecting a railway near Carrazeda de Ansiães (February 2007).
3. Data and methodology
In order to speak a single, common language, all scientific endeavours must rest on a shared set of terms and concepts. There is no other way to avoid straying from a specific and, most important, operational language. So, a clear definition of some of those terms and concepts is in order, as a reasonable point of departure for our methodological approach.
3.1. Terms and concepts
QRA processes involve a complex chain of multidimensional factors not always clear enough for parameter weighting. For this reason, hazard researchers have to deal with uncertainty, in a diffuse process which entails a high degree of subjectivity. One of the main goals of the QRA tasks is to define risk coefficient. This definition is also a complicated one, not to mention difficult to achieve, because of its high level of subjectivity, but it is nevertheless essential for duly addressing the consequences of landslides and establishing a dynamic link between prevention tasks, vigilance and early warning procedures. Like Hamilton Citation(1997), we still think that the management and development of these tasks call for a strong and permanent linking of the various scales of complementary and non-competing perspectives, as we have previously argued (Santos Citation2002b). The broad spectrum of experts devoted to the study of landslide hazards and risk, and the complexity of the features inherent in the QRA process, has inevitably led to a profusion of terms whose precise meaning is not always easy to define when researchers seek an appropriate equivalent in their native language. In earlier studies (Santos Citation2002a, Citation2002b), we addressed this issue and the considerations expounded there seem to justify the concern of several Portuguese authors. Like Reichenbach et al. Citation(2005) and Alcántara-Ayala and Goudie Citation(2010), our main concern here is with the conceptual issue. So, we think it is important to start with a brief note in order to clarify some of the core terms and concepts used in the present study.
Hazard – The concept implies a condition, a potentially dangerous event (a potential threat) that could produce a certain expected consequence, in space and time. The hazard analysis must therefore involve the parameterization of variables concerning both components – susceptibility and probability. This is, by and large, along the same lines as the proposals put forward by several authors (e.g. Varnes Citation1978, Citation1984; Einstein Citation1997; Fell & Hartford Citation1997).
Susceptibility – The concept of susceptibility is close to that of hazard, given that the probability of the occurrence of landslide events is subject to a combination of space and time factors (Einstein Citation1997; Fell et al. Citation2008). It is usually taken to be the spatial component of hazard. We often encounter phrases like lithological or morphological susceptibility, and for this reason we opted for the term ‘susceptibilities’.
Elements at risk – As defined by the International Union of Geological Sciences (IUGS) – Working Group on Landslides 1997, the elements at risk have to do with the population, facilities and engineering works, economic activities and public services in the potentially affected area.
Vulnerability – The core importance of the concept of vulnerability in QRA studies is clearly derived from Leone Citation(1996). This author emphasizes the complexity of the concept both from the theoretical point of view and in relation to its application to specific situations, due to the presence of a multiplicity of factors that usually do not lend themselves to calm, unequivocal or objective quantification. Recently, ‘state-of-the-art’ (IUGS in Cruden & Fell Citation1997) recommended that a distinction be made between situations where human life is involved and others where there is only material damage. In the first case, vulnerability is to be calculated as a function of the probability of loss of human life (the element at risk) due to landslides, whereas in the second case calculations should be a function of the monetary value ascribed to the element (or group of elements) at risk.
For this study, the concept of vulnerability is indebted to Varnes and to the Working Party on World Landslide Inventory (WP/WLI). Varnes Citation(1984) defines vulnerability as the degree of loss of a given element (or group of elements) at risk. Working at a regional scale, however, has led us to define specific criteria for assessing the ‘degree of loss’ and establish a hierarchy of the elements at risk (Fell & Hartford Citation1997) that tends to privilege human life. The values used go from 0 (no damage) to 1 (total loss), and may be expressed in terms of a percentage.
Vulnerability assessment is probably the most complex task in the QRA procedural chain. Given the features inherent in the elements at risk and the complexity of their assessment for ascribing monetary values to the resulting damage and reconstruction costs, it is also the one that is most markedly interdisciplinary in nature. The involvement of human life makes the assessment tasks far more complicated. Most of all, it exacerbates the uncertainties in the decision-making process, which is the reason why we believe that studies of vulnerability issues still have a long way to go as far as QRA is concerned.
It must be stressed that QRA studies of hazards involving the potential loss of human life have made great progress in the areas of dam construction and safety. Some authors mention the possibility of ascribing a monetary value to the loss of human life using the appropriate utility function, which expresses the importance of risk assessment in the procedural chain (Bohnenblust, cited by Einstein in Cruden & Fell Citation1997). Ascribing a value to the loss of human life must always depend on the estimation of the likelihood that this will occur, and it can be assessed by comparing rates of occurrence of accidents related to common activities, such as motorway travel, or even accidents linked to daily family life, as explained by Einstein Citation(1997). In the same study, the author states that the statistics quoted by the Swiss Society of Engineers and Architects (1980) show that the rate of occurrence of accidents arising from such activities goes from 10.3 to 10.4 per year. On the other hand, he also states that when we compare the projected probabilities of occurrence with the predominant human activities of a given geographical area, the figures used to represent the loss of human life will tend to range between 0.5 and 5 million US dollars. The same study, however, does not fail to mention the strong rejection the procedure met with, including on the part of decision-makers. The heated debate around this issue figured prominently in some studies of reference (Fell & Hartford Citation1997; Wong et al. Citation1997) and was also the object of our own attention (Santos Citation2002b).
Risk – As defined by the UN-ISDR (2004), risk is the probability of harmful consequences, or expected losses (deaths, injuries, property, livelihoods, economic activity disrupted or environment damaged), resulting from interactions between natural or human-induced hazards and vulnerable conditions. This means that risk should be considered as the product of the probability of landslide occurrence (over time and space) and the balance between the elements at risk and their respective vulnerability coefficients. However, some studies use the phrase risk assessment, a concept that should take into account such concrete notions as those of individual risk, societal risk, acceptable risk and tolerable risk, depending mostly on the specificity, goals and scale of analysis. Nevertheless, in this paper, the concept of risk, as mentioned above, is to be considered as the product of hazard and vulnerability.
3.2. Methodological tasks, techniques/procedures and tools
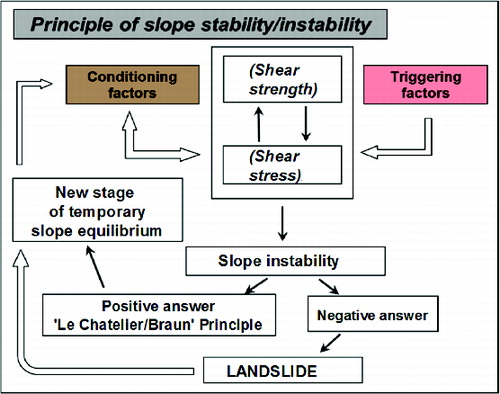
It has long been established that the equilibrium of a slope depends on (and is ruled by) several factors intrinsic and/or extrinsic to the slope and to the relief structure. As presented in , these conditions define a metastable and (always) a transitory stage of equilibrium that evolves over time, under the ongoing clash between two clusters of forces: shear strength and shear stress.
Figure 5. Principle of ‘slope stability/instability’ (Santos Citation2002b, revised and updated).
Among other methods – such as the above-mentioned PSSA method, which provides a range for each geomechanical parameter, indicating the uncertainties involved in the rock mass (Singh et al. Citation2013) – the WE approach is justifiably attracting the attention of a number of authors for developing studies aiming to minimize uncertainties related to slope stability and the fuzzy data mining process. The relevant literature reports the use of other analytical methods, namely advanced numerical analysis methods such as the finite element method, finite difference method, distinct element method and also hybrid methods, to increase confidence level in slope stability analysis. Thanks to the growing understanding of computational tools and the development of new algorithms, it has become possible to support complex numerical analyses (Stead et al. Citation2001; Jing & Hudson Citation2002). According to Singh et al. Citation(2013), the finite element method is increasingly being applied to slope stability analysis, while one of the most popular techniques for implementing this type of slope analysis method is the shear strength reduction approach (Hammah et al. Citation2004).
Several other authors have pointed out the fact that the level of uncertainty pertaining to slope stability analysis makes it clear that hazard and vulnerability are volatile concepts (Savage & Baum Citation2005), in that they depend on answers for such unavoidable questions as ‘how?’, ‘when?’ and ‘why there?’
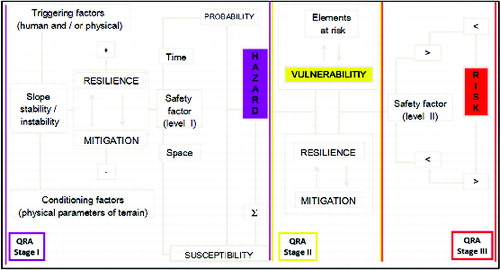
In view of these limitations, QRA studies require the definition of a three-stage analysis and assessment (), as suggested by still other authors (Glade et al. Citation2005; Guzzetti et al. Citation2005). The linking of hazard and vulnerability results in a coefficient of risk, the final stage for defining a package of strategies, including coping capacities, capabilities and skills, through which Risk Management tasks can be turned into an efficient concept and a reliable ‘culture of prevention’, as propounded by the UN-ISDR (2004).
Figure 6. A three-stage proposal for QRA.
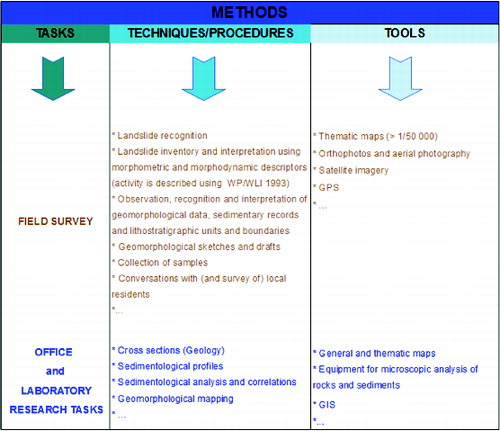
The tasks, techniques and tools that structure the QRA procedural chain are summarized in . This approach could be substantially improved by more detailed studies in order to complement the scales used in the present exercise (1/25,000 and above), but that is beyond the scope initially defined for our work. Still, it was our wish to connect the various scales via application to more restricted areas, defined both by higher hazard and vulnerability values and by higher risk values. It should be stressed, however, that this was done, in fact, but only with respect to landslides involving casualties. As a basic principle, we felt that the based maps at a scale of 1/25,000 could be a good point of departure before going into further detail.
Figure 7. Methodological tasks, techniques/procedures and tools used in the research.
3.3. Multicriteria analysis (LIm)
As mentioned above, the WE method is often alluded to as a new paradigm in risk studies. In fact, it is just a declination process of multicriteria analysis that includes a Bayesian probability model for landslide susceptibility and risk mapping. In 2010, a study demonstrating the application of the WE model to landslide susceptibility mapping using geographical remote sensing and GIS in a tropical hilly area of Malaysia was published by Pradhan et al. Citation(2010). The model often includes the performance of tests of conditional independence designed to select landslide conditioning factors, allowing different combinations. Landslide susceptibility maps can thus be constructed using the ratings of each landslide conditioning factor.
This always being, admittedly, a highly subjective process, the (required) comparison between models involving multicriteria analysis with a view to select the best, and applying it to a specific problem or phenomenon requires an accurate validation process. Models often show results that carry uncertainty. This means that their predictive capability is not reliable enough to instill confidence in users. According to Beguería Citation(2006), model validation is a fundamental step in any natural hazard study. Validation means comparing the model predictions with a real-world dataset, so as to assess its accuracy or predictive power. Validation allows you to establish the degree of confidence of the model, which is of prime importance in order to transfer the results to the final users. Also, without adequate validation, it is not possible to compare one's model with other models, or even with alternative sets of parameters or predictor variables. This means that model evaluation procedures allow authors to measure the adequacy of the model to the needs of the final users.
The landslide risk index map method was first introduced by Soeters and Van Westen Citation(1996) and later reviewed and updated by Van Westen et al. Citation(1997) and Abella et al. (2007). Soeters and Van Westen Citation(1996) state that ‘For small shallow landslides the susceptibility may also be expressed as the number of slides per square kilometre. In the index maps, the expert selects the critical instability parameters, assigns to each of them a weighted value that it is expected be [sic] proportionate to the relative contribution to the slope failure (…)’. These authors argue that the following operations should be carried out:
subdivide each parameter into a number of relevant classes;
assign a weighted value to each class;
assign a weighted value to each of the parameter map;
overlay weighted maps and obtain scores of each terrain unit;
classify the obtained scores in susceptibility classes.
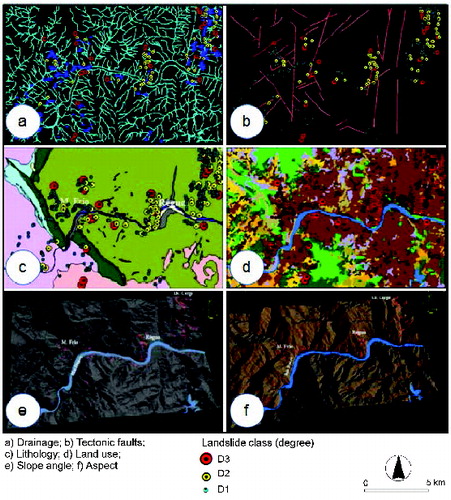
The LIm – or Lm for short – builds from the weighting of the conditioning factors ( based on the natural logarithm of the quotient between the density of the slope movements (per conditioning factor) and the global amount of slope movements recorded in the study area, thereby yielding an indexed quantification. This method provides rich information for analysing the role of each factor individually and in relation to other factors, thus resulting in an interactive dataset for a real-world simulation process. So, there are quite a few good reasons to choose the Lm for modeling landslide occurrences and zoning hazard and risk. However, in spite of the high degree of confidence inherent in the method, including in terms of validation and predictive capacity, it must be stressed that, just like with any other method, all the variables (parameters) must be accurately chosen and appropriately weighted.
Figure 8. Data layers – conditioning factors.
4. Procedures and results
4.1. Hazard analysis and assessment
In earlier works (Santos Citation2002a, Citation2002b), we tried to identify the conditioning parameters that were likely to be related to the spatial distribution of the 441 landslide events identified in the study area. We also wanted to find the probable causal relations between the spatial pattern of their occurrence and the triggering factors. A first correlation could be established based on the reading of the visible impact, both direct and indirect, of human activities throughout the landscape. Among such marks, the terraced structure of the vineyards is especially noticeable, as it clearly interferes with the natural dynamics of the slopes. However, other reliable data could be used, for we have also collected data on series of daily precipitation, mainly in the rainy months of November 2000 to January 2001, when high values for accumulated precipitation were observed, which is uncommon in this part of the Douro river basin.
Several authors allude to the importance of the high levels of accumulated precipitation and/or to the sudden and intense rainfall episodes, which usually lead to a steady rise in the water table (Alcántara-Ayala & Thornes Citation1998; De Citation2004; Turconi et al. Citation2010). This often involves significant increases in the piezometric levels and, as a result of that, it may have a critical impact on slope stability conditions.
Climatology studies show in detail the specific consequences of intense episodes of rainfall and the amount of precipitation accumulated over long dry periods (Eyles et al. Citation1978; Crozier Citation1989; Garland & Olivier Citation1993). This information can be very useful, especially when it refers to accumulated figures for the 4 months preceding an event, in order to define the threshold values beyond which the probabilities of slope instability increase. Eyles et al. Citation(1978) defined thresholds that they termed as the maximum probability threshold and minimum probability threshold, beyond which there would be a major risk of slope movement events.
Although relatively recent, the figures available for the Douro Warning Station in Peso da Régua (70 m above sea level) only cover the 1990–2000 decade; this shortcoming justifies the use of other data in order to extend the analysis over a longer time period (1961–1990) and to establish normal values to be used as reference. This data was obtained at the closest official meteorological station, located in Vila Real (560 m above sea level).
It is possible to offer a brief synthesis of the main period under consideration (1961–1990) using the data collected at the Vila Real meteorological station and correlating it with the amount of precipitation registered for the 4-month rainy period (winter 2000–2001) that preceded the event. We stress the fact that the figures for the 4 preceding months (860.1 mm in Peso da Régua and 1059 mm in Vila Real) are almost twice the normal values for the chronological series of an equal duration in the same season, the precise amounts in the periods considered being 493.4 mm and 552.9 mm, respectively. It should be further noted that at both meteorological stations, the accumulated amounts of precipitation between October 2000 and January 2001 exceeded the total annual average for the period in question. We can easily see the significance of these figures and their meaning in terms of the triggering factor for slope instability processes.
Although it was not possible to resort to data related to the return periods for the rainy series analysed, this approach gains credence by including ‘time’ aspects as a component of hazard analysis (Santos Citation2002a). This information allows us to think in terms of the probability of occurrence of a landslide, one of the two dimensions of hazard.
It was the atypical meteorological context and its geomorphological consequences that made possible the present research, using different data sources and types, as well as analysis and assessment techniques for the conditioning parameters under consideration and the statistical treatment of the 441 landslides (each of which was duly inventoried, mapped and georeferenced). Once the inventory and systematic recording of the landslides was completed – which included analysis and classification tasks in terms of morphometric parameters such as affected area and length, and morphodynamic parameters like the mechanisms involved and the activity (style, state and spatial distribution) – the next step was the analysis of the damage caused by each of the 441 landslide events. We tried to follow as closely as possible the terminology used in the European classification first proposed by Varnes Citation(1978) and later adopted by the WP/WLI (Cruden Citation1993) and by several landslide risk assessment experts (e.g. Dikau et al. Citation1996).
This line of action and related procedures guided our primary objective, which was to identify the landslide susceptibility and the hazard associated with each landslide event, in order to propose a hierarchy that might allow us to differentiate three landslide categories or degrees – degree 1 (D1), degree 2 (D2) and degree 3 (D3). However, this classification is not that simple or indisputable because it is not unusual to find different mechanisms coexisting in the same hazard degree. A simple fall mechanism, for instance, which is no more than 2 or 3 m in length and involves approximately 2 cubic metres of displaced material, could be a potential threat with consequences similar to those arising from a rotational displacement of debris material (slump) with morphometrically similar characteristics. The example offered here explains why we placed these two elementary types of landslide in the same class of hazard – D1. This hazard classification and hierarchy process is mainly based on morphometric parameters, rather than on the type of mechanism that leads to instability and stress conditions on slopes.
At a later stage of the work, we tried to establish a relation between the distribution of the landslide events and the conditioning factors (lithology, slope angle and aspect, proximity to tectonic failures and faults, proximity to rivers – drainage and land use, ), which we think might be important for understanding the causes leading to the favourable conditions for landslide occurrences, and thence to the definition of a standard to characterize their location and spatial distribution. In other words, our reasoning led us to define hazard's other dimension: susceptibility classes.
The weighting of the different conditioning variables had already been tested, following a qualitative assessment and quantitative (multifactorial) weighting process, relating the distribution of each slope movement with the conditioning factors under consideration. As already mentioned, our approach regarding landslide hazard and risk assessment using GIS and multicriteria evaluation techniques is based on the proposal put forward by Soeters and Van Westen Citation(1996), and later reviewed and updated by Van Westen et al. Citation(1997) and Abella et al. (2007).
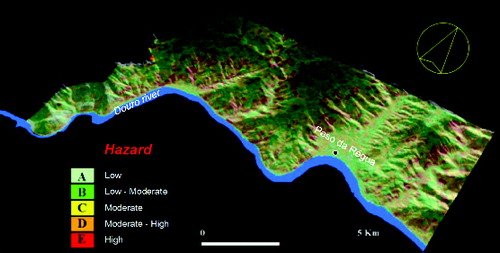
After ascribing new code values to all the conditioning factors, we used GIS geoprocessing operators to identify the distribution pattern of landslide events per area with differing degrees of exposure to the landslides. Finally, in order to assess the degree of association between the distribution of each group of landslide and the conditioning factors under consideration, three intermediate maps were made in order to arrive at a hazard analysis and zoning of the areas as a function of their susceptibility to each of the three groups of landslides. After this weighting process – based on the hierarchy defined as a function of the hazard associated with each group, in accordance with the algebraic expression ‘D1 + (2 × D2) + (3 × D3)’ – we felt we were in a position to propose a landslide hazard map for this region in north-eastern Portugal (.
Figure 9. Landslide hazard map for the Peso da Régua region (Douro river valley).
4.2. Vulnerability analysis and assessment
In accordance with the QRA procedural chain we followed here (), we consider the concept of risk to be the algebraic product of hazard and the vulnerability coefficient assigned to the elements at risk. However, other authors find that the calculation of the risk coefficient shouldn't be presented in the form of a product (Fell & Hartford Citation1997), but rather as the result of a sum. In earlier studies (Santos Citation2002b), we alerted the problems that might arise when we think in terms of algebraic product, considering that any of the items – hazard and/or vulnerability – could assume the value 0. In other words, in case hazard equals 0, the value for risk will be the same as that for vulnerability; the same applies if vulnerability equals 0, since risk values will be the same as those for hazard. Therefore, there may arise practical difficulties extending far beyond the strictly procedural sphere, since it is always legitimate to allude to the existence of risk, even when vulnerability is null. In short, all these aspects must be taken into account if hazard is other than 0, and this could happen also in a situation as bizarre as the previous one, in case the probability of the occurrence of landslides (hazard) is null and the vulnerability of the elements at risk is other than 0. In view of this, we used the information contained in the local municipal master plans, and this conduct allowed for the reclassification of the different functional spaces in terms of the interconnection between the qualitative component of vulnerability assessment and its quantitative basis (weighting of the elements at risk), as other authors have already suggested (Glade Citation2003).
In the hierarchy of elements deemed at risk, we adhere to the principle that human life and the likelihood of its being affected are at the top of the list. Thus, the definition of the vulnerabilities of each of the different functional spaces is based on criteria such as the presence, frequency and absolute number of human lives that might eventually be exposed to a given, potentially hazardous event – in the case at hand, a landslide – including the usual circuits and routines generally associated with each of the categories of space under consideration. These assessment criteria, which, at first, might be thought of as subjective, made it possible to define the main (morpho)functional contexts, that is, the attributes of the various land use areas with which we correlated the type of potential physical injury (number and severity).
The final steps for the assessment of vulnerabilities of the different functional spaces also took into account other elements at risk, that is, the material factors of the anthropic fabric which, according to Leone Citation(1996), encompass both the facilities – in terms of number, quality/functional utility and estimated monetary value – and the functional disruption that are likely to be caused by the three groups of landslide events. The probable damage, work and recovery/reconstruction costs of the buildings at risk were estimated for this purpose. The assessment of vulnerability should then hinge on the establishment of three separate groups of homogeneous functional spaces, which are the basis for a proposed hierarchy of spaces with varying vulnerability coefficients, as shown in .
Table 1. Homogeneous areas considered for the assessment of vulnerability.
A first reading of allows us to question the relation between the vulnerability of ‘category I’ urban agglomerations and other spaces like forest area. In other words, is the vulnerability of an urban area like Peso da Régua exactly nine times greater than that of a forest area? Is the relation between them higher or lower than the coefficient? On the other hand, are the assessment criteria we used coherent enough to establish this kind of relation between the different functional spaces, even though the scale of analysis, 1/25,000, does not permit a sufficiently refined reading of the elements at risk? We firmly believe that, considering the characteristics of the elements at risk found in these two categories of functional spaces, the difference in the values mentioned can be accepted, and this fact encouraged us to propose a qualitative assessment of vulnerabilities associated with the various functional spaces under consideration. However, the criterion of arithmetic progression may still need further elaboration.
To facilitate the progression of the QRA procedures, we attributed a numerical grid code (C) to each category of functional space, with a counter domain of values ranging from 1 to 9, and a base on which it could be arranged in a series. The vulnerability value of a given category of functional space varies in direct ratio to the absolute value of the respective grid code. To accommodate this process for classifying the different functional spaces with the principle of varying vulnerability between 0 and 1, each C value was multiplied by a constant that we termed the coefficient (V) = 0.1. The product of C and V gave us a coefficient of vulnerabilities (CV), which is expressed by the proposal to define a hierarchy for the different spaces regarded as homogeneous areas. offers a summary of the analysis and qualitative judgements of the adopted criteria.
Table 2. Qualitative assessment of vulnerability.
Nonetheless, at the beginning of the work we set out to do, we stressed the need to connect the various scales of analysis and took the position that the present study is, first and foremost, a methodological attempt to propose an interpretive model of spatial distribution for the landslides that occurred in the Douro river region following the autumn–winter of 2000–2001. We do not hesitate to point out that there were many procedural doubts and difficulties involved in the QRA processes throughout all the tasks that had to be carried out. However, in the end, we believe that subjectivity and uncertainty will always exist, regardless of the methods and techniques adopted, or the researcher's training and sensitivity. Moreover, the subjective nature of the criteria used in each of the three QRA stages (analysis and assessment of hazard, vulnerability and risk) is paralleled by the contingency, the random character and the actual concept of probability, which are all basic concepts of QRA as well as the source of many of our doubts and indecisions.
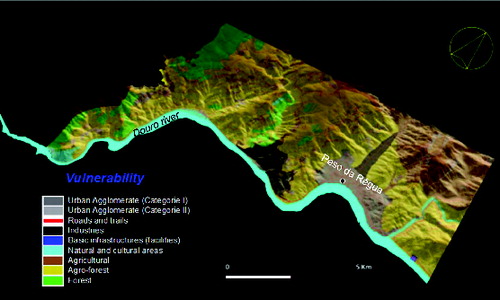
In light of the already mentioned criteria, the spatial pattern for the distribution of the 441 landslide events was combined with the vulnerability zoning proposal for the study area (. The final result is presented under the form of a risk map proposed for the region, once the hazard and vulnerability data have finally been cross-checked.
Figure 10. Vulnerability zoning proposal for the study area.
4.3. Risk assessment
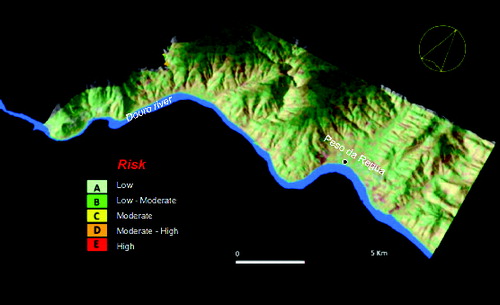
As was the case with the hazard mapping (), the proposal for zoning risk began with the drawing of three intermediate maps of the three groups of landslides under analysis (D1, D2 and D3). Each of these maps was generated having in mind the need to consider the three degrees of landslides classified according to the potential danger and damage they might produce. It was then overlaid with the vulnerability map, the resulting risk map being obtained by weighting the above-mentioned three intermediate maps according to the algebraic expression ‘D1 + (2 × D2) + (3 × D3)’ ().
Figure 11. Landslide risk map for the Peso da Régua region (Douro river basin).
5. Discussion
Careful examination of and , and the observation of , 9 and 10, allow us to detect some curious situations. For example, it is possible to establish a very strong link between landslide hazard and risk zoning. It amounts to say that a higher probability of a given, potentially dangerous event is likely to mean that this particular area will be classified with a high coefficient of landslide risk. Such a conclusion may strike us as surprising, for it means that the significance of the elements at risk and of their degree of vulnerability appears somewhat diluted, which in our opinion does not necessarily apply to many locations of the inventoried landslides. Thus, for example, the occurrence of landslides in forest areas, where no serious damage to property or loss of life is involved, may not correspond to a class of ‘high risk’, even if the hazard is considerable. However, there are certainly situations in which a ‘high hazard’ value, by itself, all but determines a ‘high risk’ level, regardless of the vulnerability coefficient assigned to the functional space involved in such situations. We therefore need a judicious reading of the results, so that map validation can be as accurate and as close to reality as possible.
Table 3. Distribution of risk areas by class of hazard.
Table 4. Distribution of risk areas by category of functional space (vulnerability).
Another major conclusion has to do with the interpretation of data on the vulnerability of the elements at risk. Certain groups of functional spaces, such as urban areas, roads and railways, also seem to determine high risk coefficients, even where hazard values are not significantly high. This fact is easily understood if we bear in mind that the occurrence of landslides in areas where human presence is more common and/or uninterrupted may be more likely to cause high material damage and even involve loss of human life, as was the case in Régua and Santa Marta de Penaguião in 2001. We therefore believe that the vulnerability of the different groups of functional spaces – defined according to the type, value, density and quantity of the elements at risk – should be the primary factor for establishing the risk coefficient of a functional space; priority should be given to them when a comparison is made with the importance of hazard values. On the other hand, in spaces where high hazard and high vulnerability values match, that is an indication of a high-risk environment. This makes it possible to identify the most dangerous areas, which is also where occupation by human societies must be especially prudent and where prevention and early warning strategies should be more effective. It is not surprising, then, that the agro-forest spaces and woodlands are mostly low-vulnerability and low-risk areas, although some of the sectors intersected by roads and railroads involve higher levels of vulnerability (, 10 and 11).
6. Conclusions
Landslide hazard studies involve a wide spectrum of variables that may interfere with the stability of slopes. They come with their own limitations, depending on the models that are used to approximate reality. This means that we cannot parameterize all the factors involved and their geomechanical and hydrodynamic behaviour. For these and other reasons, such as the application of data to areas that are clearly unique from a morphostructural or morphoclimatic point of view, any extrapolation of the results must also be regarded with great caution and critical awareness. The methodological attempt described in the present paper, which is only applicable to the physical space we started out by delimiting, helps identify the areas where the landslide groups under consideration are more likely to occur. However, our results and conclusions should not go without field data validation. Empirical knowledge of the terrain still plays a crucial role in this matter, as is always the case when we talk about Geography.
QRA always involves a number of interrelated tasks that are not only complex but also difficult to manage. However, it is precisely this complex process of data analysis and integration that makes it possible to define standards for zoning areas exposed to a particular, potentially hazardous phenomenon. The probability of the occurrence of landslide events over time and space can be estimated with the help of GIS models and multicriteria evaluation techniques combining the conditioning factors whose weights vary according to their relative role within the model. The workings of the process of spatial modeling with regard to slope movements also make it necessary to bring the triggering factors into the equation. The latter have to do with human activities, the climate and the weather, or any other natural phenomena – such as earthquakes – that function as a stimulus or impulse to instigate instability processes on slopes. Still, we believe that there are inevitably some limitations to landslide hazard and risk analysis, depending on one's choice in terms of methods, techniques, procedures and models.
We understand that a large number of algorithms and statistical techniques used in spatial models (including the method we opted for, which we called the Lm) are prone to data over-normalization, as a consequence of which the model tends to suffer in terms of reliability and validation. On the other hand, we also believe that relying exclusively on a process of empirical non-indexed weighting, without any quantitative basis, might exacerbate situations already under stress and foster distortions of reality. Field validation, not just of data but also of the adopted models, is therefore the sole key to this problem, even if it fails to address all the weaknesses of a particular spatial modeling process. In fact, all theoretical methods and models run into several difficulties when applied to this type of phenomenon, so that it becomes impossible to fully eliminate uncertainty, which is prone to suffer from an accumulation process over the various stages of spatial modeling. Uncertainties may undoubtedly also result from the data itself, from the methodological options, selected algorithms and even from a total or partial lack of preparation to critically analyse results.
Like Beguería Citation(2006), we believe that validation is a fundamental step for assessing model accuracy and the predictive power of models used in any study concerning natural hazards. This was our guiding principle in the monitoring and continuous evaluation procedures we developed for the purpose of validating this model, the results of which so far have allowed us to accurately propose the zoning of landslide hazard and risk areas in the Douro river basin. This will give us the appropriate information for future corrections concerning, for instance, different weighting, different sets of parameters to be included or even different models to be considered.
Acknowledgements
We must, even if briefly, mention the valuable assistance provided by the Comissão de Coordenação da Região Norte in the person of Figueiredo Pereira, who received us most courteously whenever the need for additional information – almost always in digital form – forced us to contact him. To the Centro Nacional de Informação Geográfica, we would like to express our gratitude for providing vectorial and raster data. Our thanks to the reviewers and the Chief Editor for their comments/suggestions to improve the earlier version of the paper.
References
- Abella EA, Van Westen CJ. 2007. Generation of a landslide risk index map for Cuba using spatial multi-criteria evaluation. Landslides. 4:311–325.
- Alcántara-Ayala I, Goudie A, editors. 2010. Geomorphological hazards and disaster prevention. Cambridge: Cambridge University Press.
- Alcántara-Ayala I, Thornes J. 1998. Modelling mass failure in a Mediterranean mountain environment: climatic, geological, topographical and erosional controls. Geomorphology. 24:87–100.
- Beguería S. 2006. Validation and evaluation of predictive models in hazard assessment and risk management. Nat Hazards. 37:315–329.
- Brancucci G, Paliaga G. 2006. The hazard assessment in a terraced landscape: preliminary result of the Liguria (Italy) case study in the interreg III alpter project. In: Nadim F, Poettler R, Einstein H, Klapperich H, Kramer S, editors. Proceedings Geohazards, P07, 2006 ECI Conference on Geohazards; Lillehammer (Norway). Available from: http://dc.engconfintl.org/geohazards/16
- Crozier MJ. 1989. Landslides: causes, consequences and environment. London: Routledge.
- Cruden D. 1993. The multilingual landslide glossary. Richmond: Bitech Publishers, for the UNESCO Working Party on World Landslide Inventory.
- Cruden D, Fell R. 1997. Landslide Risk Assessment. In: Cruden D, Fell R, editors. Proceedings of the Workshop on Landslide Risk Assessment; 1997 Feb 19–21; Honolulu (HI). Rotterdam (The Netherlands): Balkema.
- De SK. 2004. Causes and consequences of landslides in the Balasan basin of Eastern Himalayas. In: Singh S, Sharma HS, De SK, editors. Geomorphology and environment. Kolkata: ACB Publications; p. 406–414.
- Dikau R, Brunsden D, Schrott L, Ibsen ML, editors. 1996. Landslide recognition: identification, movement and causes. Chichester: Wiley.
- Einstein H. 1997. Landslide risk – systematic approaches to assessment and management. In: Cruden D, Fell R, editors. Landslide risk assessment. Proceedings of the Workshop on Landslide Risk Assessment; 1997 Feb 19–21; Honolulu (HI). Rotterdam (The Netherlands): Balkema; p. 25–50.
- Eyles R, Crozier M, Wheeler R. 1978. Landslips in Wellington city. Geographer. 34:58–74.
- Fell R, Hartford D. 1997. Landslide risk management. In: Cruden D, Fell R, editors. Landslide risk assessment. Proceedings of the Workshop on Landslide Risk Assessment; 1997 Feb 19–21; Honolulu (HI). Rotterdam (The Netherlands): Balkema; p. 51–109.
- Fell R, Corominas J, Bonnard C, Cascini L, Leroi E, Savage W. 2008. Guidelines for landslide susceptibility, hazard and risk zoning for land-use planning. Eng Geol. 102:99–111.
- Garland G, Olivier M. 1993. Predicting landslides from rainfall in a humid, sub-tropical region. Geomorphology. 8:165–173.
- Glade T. 2003. Vulnerability assessment in landslide risk analysis. Die Erde. 134:121–138.
- Glade T, Anderson M, Crozier MJ, editors. 2005. Landslide hazard and risk. Chichester: Wiley.
- Guzzetti F, Reichenbach P, Cardinali M, Galli M, Ardizzone F. 2005. Probabilistic landslide hazard assessment: an example in the Collazzone area, Central Italy. In: Bergmeister K, Rickemann D, Strauss A, Wieshofer S, Curbach M, Proske D, editors. 3rd Probabilistic workshop, technical systems and natural hazards. Wien: Schriftenreihe des Departments; p. 173–182.
- Hammah RE, Curran JH, Yacoub T, Corkum B. 2004. Stability analysis of rock slopes using the finite element method. Proceedings of the ISRM Regional Symposium Eurock 2004 and the 53rd Geomechanics Colloquium; Salzburg. Available from: http://www.rocscience.com/library/pdf/Eurock2004.pdf
- Hamilton R. 1997. Report on early warning capabilities for geological hazards. Geneva (Switzerland): IDNDR Scientific and Technical Committee. Available from: http://www.unisdr.org/unisdr/capaland.htm.
- Jing L, Hudson JA. 2002. Numerical methods in rock mechanics. Int J Rock Mech Min Sci. 39:409–427.
- Leone F. 1996. Concept de vulnérabilité appliqué à l’évaluation des risques générés par les phénomènes de mouvements de terrain [thesis] [The concept of vulnerability applied to landslide risk assessment [thesis]]. Grenoble: L’Université Joseph Fourier.
- Pradhan B, Oh H-J, Buchroithner M. 2010. Weights-of-evidence model applied to landslide susceptibility mapping in a tropical hilly area. Geom Nat Haz Risk. 1:199–223.
- Reichenbach P, Galli M, Cardinali M, Guzzetti F, Ardizzone F. 2005. Geomorphological mapping to assess landslide risk: concepts, methods and applications in the Umbria Region of central Italy. In: Glade T, Anderson MG, Crozier MJ, editors. Landslide risk assessment. Chichester: Wiley; p. 429–468.
- Santos JG. 2002a. Movimentos de vertente na área de Peso da Régua; análise e avaliação multicritério para o zonamento de hazards em ambiente SIG [Multicriteria analysis for landslide hazard assessment in the Peso da Régua region using GIS platforms and tools]. Territorium. 9:53–73.
- Santos JG. 2002b. Cartografia automática do risco de movimentos de vertente; estudo aplicado à área de Peso da Régua, Bacia do Douro (Norte de Portugal) [Automatic maps for zoning landslide risk in the Peso da Régua region – Douro river basin (northern Portugal)]. Xeográfica. 2:33–57.
- Santos JG, Cardoso A, Gil P. 2007/2008. Sistemas integrados de gestão de risco; ensaio metodológico aplicado à Linha do Tua (NE de Portugal) [An integrated system for landslide risk management; methodological essay applied to the Tua River's railway (north-eastern Portugal)]. Cad Geogr. 26/27:217–229.
- Savage W, Baum R. 2005. Instability of steep slopes. In: Jakob M, Hungr O, editors. Debris-flow hazards and related phenomena. Chichester: Praxis Publishing; p. 53–80.
- Singh R, Umrao RK, Singh TN. 2013. Probabilistic analysis of slope in Amiyan landslide area, Uttarakhand. Geom Nat Haz Risk. 4:13–29.
- Soeters R, Van Westen CJ. 1996. Slope instability recognition, analysis and zonation. In: Turner AK, Schuster R, editors. Transportation research board special report 247, landslides investigation and mitigation. Washington, D.C.: National Academy Press; p. 129–177.
- Stead D, Eberhardt E, Coggan J, Benko B. 2001. Advanced numerical techniques in rock slope stability analysis – applications and limitations. In: Kühne M, Einstein HH, Krauter E, Klapperich H, Pöttler R, editors. Proceedings of the International Conference of Landslides – Causes, Impacts and Countermeasures; 2001 June; Davos. Essen (Germany): Verlag Glückauf GmbH; p. 615–624.
- Turconi L, De SK, Tropeano D, Savio G. 2010. Slope failure and related processes in the Mt. Rocciamelone area (Cenischia Valley, Western Italian Alps). Geomorphology. 114:115–128.
- Van Westen CJ, Rangers N, Terlien T, Soeters R. 1997. Prediction of the occurrence of slope instability phenomena through GIS-based hazard zonation. Geol Rundsch. 86:404–414.
- Varnes DJ. 1984. Landslide hazard zonation: a review of principles and practice: natural hazards. Paris: UNESCO.
- Varnes DJ. 1978. Slope movement and types and processes. In: Schuster RL, Krizek RJ, editors. Landslides, analysis and control, transportation research board special report 176, Washington, D.C.: National Academy of Sciences; p. 11–33.
- Wong HN, Ho KS, Chan YC. 1997. Assessment of consequence of landslides. In: Cruden D, Fell R, editors. Landslide risk assessment. Rotterdam: Balkema; p. 111–152.