
Abstract
A complete earthquake catalogue of the Western Himalaya (latitudes 30°N–36°N and longitudes 72°E–78°E) for the period of 1501–2010 has been compiled with earthquake magnitude computed in moment magnitude (Mw) scale. Pre- and early twentieth century records of earthquake damage have been documented from rare and out of print publications. Seismotectonics and seismic hazard for Kohistan arc, Kashmir–Hazara Syntaxis, Nanga-Parbat (Western Syntaxis), Karakoram and Himachal Himalaya are discussed with special reference to 1905 Kangra and 2005 Muzaffarabad earthquakes. Analyses of spatio-temporal variation in b-value from the region indicate significant precursor prior to the 2005 Muzaffarabad earthquake; progressive rise of background b-value observed and the main shock locates close to relative high b-value domains. Regions surrounding the location of the 1905 Kangra earthquake also display such high b-value for the period of 2005–2010 that calls for closer scrutiny. Temporal analysis of b-value from the epicentral block of Muzaffarabad earthquake clearly showed a high–low b-value couplet of 1.45–0.72, which may be treated as a typical precursor before an imminent large earthquake. Gumbel extreme value statistics indicate probability of occurrence of an event of Mw > 7.0 within 50 years in the region.
1. Introduction
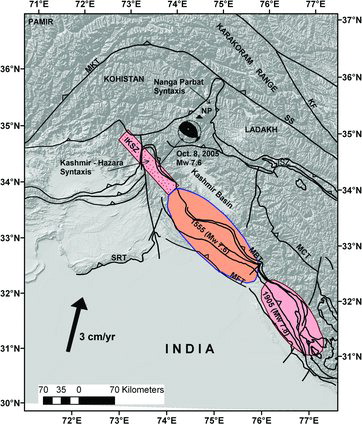
The ongoing convergence of Indian and Eurasian plates gave rise to E–W trending bow-shaped Himalayan arc with trend reversal at the terminal ends: Nanga-Parbat in the west (Western Syntaxis) and Namcha Barwa in the east (Eastern Syntaxis). Western Syntaxis (Nanga-Parbat and Kashmir–Hazara syntaxis), an integral part of Western Himalaya, is characterized by active uplifted dome with flanks deformed by seismically active shear zones/faults. The geodynamic interactions of these shear zones/faults aided by deep erosion by river Indus and consequent mass removal expose the exhumed Cenozoic metamorphic rocks, granulites and granites (Nanga-Parbat–Harmosh massif) originating from the Indian Plate. The Nanga-Parbat massif is surrounded entirely by the Main Mantle Thrust (MMT) and bordered in the west and east by accreted rocks of the Mesozoic Island arc system of the Kohistan and Ladakh arc, and to the north by rocks of the Karakoram arc along the Main Karakoram Thrust (MKT)/Shyok Suture () and in the south by Lesser Himalayan rocks (Naqvi Citation2005). Compression, metamorphism and ongoing deformation have accumulated enormous strain within the country rocks over millions of years particularly in the frontal belt. The strain is released continuously in the form of numerous small shocks with occurrence of periodic large earthquakes: 1555 earthquake (Mw 7.6), 1905 Kangra earthquake (Mw 7.8) (see also for others) and most recently 2005 Muzaffarabad earthquake (Mw 7.6) within the Indo-Kohistan Seismic Zone (IKSZ; coined by Seeber et al. Citation1981) (). Though many large earthquakes with probable overlapping ruptures have occurred in this belt (see ; Bilham Citation2004; Avouac et al. Citation2006), they have not entirely released the cumulative strain retained in the plate margin, accumulated by the ∼3 cm/year convergence of Indian Plate (Bettinelli et al. Citation2006). Thus, the belt is amenable to seismic rupture through large earthquakes that may create extreme damage to both life and property in the densely populated regions of the Kashmir and Kangra valley. Possibility for the occurrence of such large earthquakes (M > 8.0) has already been predicted from moment and geographical positioning system data analysis (see Bilham & Ambraseys Citation2005; Bilham & Wallace Citation2005; Feldl & Bilham Citation2006) and spatio-temporal seismic cluster analysis (Mukhopadhyay et al. Citation2011a).
Table 1. Chronological listing of earthquakes from 1500 to 1963 (area latitude 30°– 36°N and longitude 72°–78°E).
Figure 1. Tectonic setting of the Western Himalaya with special emphasis on 8 October 2005, Muzaffarabad earthquake with its CMT solution; colour-shaded areas showing IKSZ (Indus–Kohistan Seismic Zone) and estimated locations of ruptures in 1555 Kashmir (Mw 7.6) and 1905 Kangra (Mw 7.8) earthquakes (after Bilham Citation2004; Avouac et al. Citation2006). Velocity of peninsular India (given in arrow head with value) relative to stable Eurasia computed from the Euler pole of the Indian Plate determined by Bettinelli et al. Citation(2006). ISZ: Indus Suture Zone; KF: Karakoram Fault; MFT: Main Frontal Thrust; MBT: Main Boundary Thrust; MMT: Main Mantle Thrust; SRT: Salt Range Thrust; MCT: Main Central Thrust; MKT: Main Karakoram Thrust; NP: Nanga-Parbat; SS: Shyok Suture.
To assess the seismic potentiality of Western Himalaya, we have adopted a threefold analytical procedure in the present study. First, the description and damage scenarios of the larger historical earthquakes occurring since 1500 AD have been documented from ancient and modern literatures. Second, seismotectonics of those zones producing the historical earthquakes and recent seismicity are analysed with contemporary earthquake, centroid moment tensor (CMT) data and corresponding seismo-geological sections (, and . Through b-value analysis, an attempt has been made to identify the precursory trend in those zones, and finally, the quantification of size of seismic hazard with return period is done through Gumbel's extreme value statistics. To achieve the goal stated above, we have carried out the following step-by-step exercises: (i) preparation of complete list of earthquakes for the study area from 1501 to 1963 (presented with this paper) and from 1964 to 2010 with homogenized magnitude Mw; (ii) documentation from historical accounts (sixteenth–nineteenth centuries) for large earthquakes with analytical review of seismic hazards; (iii) evaluation of contemporary seismotectonics in the region constrained by double couple CMT solutions; (iv)analysis of precursory spatio-temporal b-values in the entire study area and changes in temporal b-value around the epicentral tract of 2005 Muzaffarabad earthquake and 1905 Kangra earthquake; and finally (v) estimate probable magnitude of future earthquake through of Gumbel's extreme value statistics.
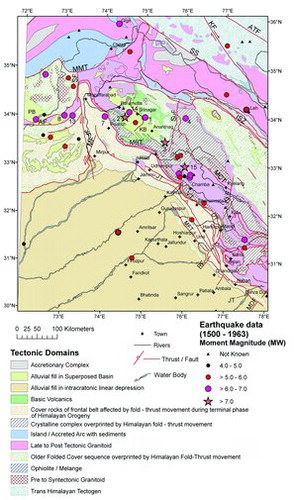
Figure 2. Seismo-tectonic map of Western Himalaya in and around the Western Syntaxis with historical earthquake data 1501–1963 (see ). The number is given as per No. of and discussed in the text. Tectonic domains, earthquake with magnitude variation and tectonic planes are shown. MBT: Main Boundary Thrust; MCT: Main Central Thrust; ISZ: Indus–Tsangpo Suture Zone; MMT: Main Mantle Thrust; SS: Shyok Suture; KF: Karakoram Fault; SF: Shinkiari Fault; AT: Attock Fault; JF: Jhelum Fault; ATF: Altyn Tagh Fault; MF: Mangla Fault; SuF: Sundernagar Fault; JT: Jwalamukhi Thrust; DT: Drang Thrust; VT: Vaikrita Thrust; KiF: Kishtwar Fault; RF: Ropar Fault; MDF: Mahendragarh Dehradun Fault; MFT: Main Frontal Thrust; KB: Kashmir basin; PB: Peshwar Basin.
2. Earthquake data
Earthquake catalogues prepared for the area (latitudes 30°N–36°N and longitudes 72°E–78°E) have been presented in two maps ( and ) for two different time periods superimposed on the tectonic elements (after Dasgupta et al. Citation2000). A total of 53 earthquakes () for the period from AD 1501 to 1963 (historic, pre-instrumental and instrumental period, prior to the establishment of WWSSN) are plotted in the former, while 2176 events representing the entire instrumental period from 1964 to 2010 are depicted in the latter map. All available published documents and catalogues for earthquakes from the area were consulted in finalizing the list of earthquakes. Valuable source of information on earthquakes particularly for the period prior to AD1900 are from Baird-Smith Citation(1843), Oldham Citation(1882), Chandra Citation(1978), Quittmeyer and Jacob Citation(1979), Iyengar et al. Citation(1999), Ambraseys and Jackson Citation(2003), Ambraseys and Douglas Citation(2004) and Bilham et al. Citation(2010) along with the earthquake catalogue compiled by India Meteorological Department (IMD). For the period from 1900 to 1963, earthquake data listed by USGS and ISC ‘rectangular search’ were primarily consulted. For the period from 1964 to May 2009, ISC parameters are exclusively considered and for remaining period up to December 2010 NEIC (USGS) data were incorporated in the present catalogue. The Centennial Catalogue and EHB event data [E. R. Engdahl (personal communication)] is also consulted for cross checking of earthquake parameters. Earthquake magnitudes given by different agencies and also for different periods are of different scales such as ML, MS, mb , etc. For any analysis on seismotectonics or earthquake statistics, it is necessary to convert the different magnitude scales to a uniform scale and accordingly relations among magnitude scales as given by Gutenberg and Richter Citation(1956), Hanks and Kanamori Citation(1979) and Scordilis Citation(2006) were utilized to derive a uniform magnitude Mw (Moment magnitude) for all earthquakes in the catalogue.
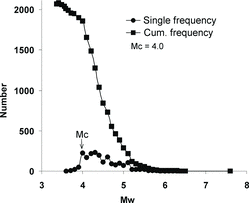
The data catalogue from the year 1964 to 2010 contains 2176 events with magnitude ranging from Mw 3.6 to 7.6. To workout the magnitude completeness, we adopt the methodology based on the assumption of self-similarity (Wiemer & Wyss Citation2000). A fast and reliable estimate of the magnitude completeness (Mc) by this method is to define the point of the maximum curvature (MAXC) as point of ‘magnitude of completeness’. This is adopted to compute the maximum value of the first derivative of the frequency–magnitude curve. In practice, this matches the magnitude bin with the highest frequency of events in the non-cumulative frequency–magnitude distribution. The highest frequency of events in the non-cumulative curve has a peak with magnitude 4.0 as the highest frequency class and that by definition is taken as Mc (). Thus, the catalogue is, by and large, complete above this cut-off magnitude (Mw ≥ 4).
Figure 3(a). Seismo-tectonic map of Western Himalaya in and around the Western Syntaxis with earthquake data 1964–2010 and symbology as per magnitude and depth. Note five earthquake cluster zones (A–E): Kohistan arc (A); Kashmir–Hazara syntaxis (B); Nanga–Parbat (Western Syntaxis) (C); Karakoram (D) and Himachal Himalaya (E). Tectonic domains, earthquake with magnitude variation and tectonic planes are shown. MBT: Main Boundary Thrust; MCT: Main Central Thrust; ISZ: Indus–Tsangpo Suture Zone; MMT: Main Mantle Thrust; SS: Shyok Suture; KF: Karakoram Fault; SF: Shinkiari Fault; AT: Attock Fault; JF: Jhelum Fault; ATF: Altyn Tagh Fault; MF: Mangla Fault; SuF: Sundernagar Fault; JT: Jwalamukhi Thrust; DT: Drang Thrust; VT: Vaikrita Thrust; KiF: Kishtwar Fault; RF: Ropar Fault; MDF: Mahendragarh Dehradun Fault; MFT: Main Frontal Thrust.
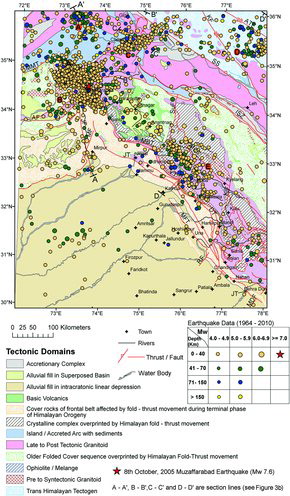
Figure 3(b). Seismo-geological sections across Western Himalaya (modified after of Mukhopadhyay et al. Citation2011b) where subducting Indian Plate and overriding Eurasian plate in the sections have resulted into generation of imbricate structure. Position of section lines is marked in . Note the low dipping Indian Plate in Kashmir-Hazara and Kohistan arc sector in section A–A′. Thickening of Indian Plate in sections B–B′ and C–C′ along Naga Parbat is noteworthy. The imbrications are again relevant in Himachal Himalaya–Karakoram sector along section D–D′. The important beach ball diagrams are placed in the section to understand the tectonic variations across arc. For reference of CMT solution, please refer to with number given in the sections. NP – Nanga-Parbat.
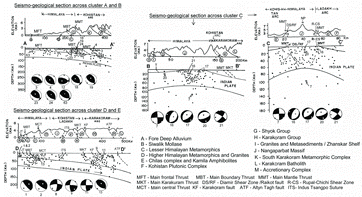
Figure 3(c). Isoseismal map of 8 October 2005 Muzaffarabad earthquake, Mw 7.6 (after Pande et al. Citation2006). Green line indicates surface rupture.
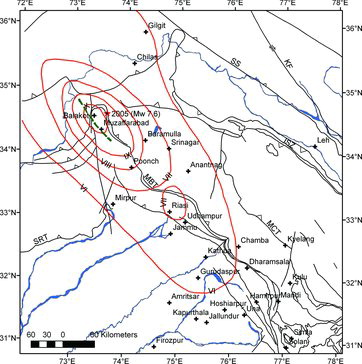
Figure 4. Frequency–magnitude distribution of the data (1964–2010) in the catalogue used. The result of the MAXC approach (Wiemer and Wyss Citation2000) is indicated with the arrow as magnitude completeness (Mc = 4.0).
3. Large earthquakes in and around Kashmir and Kangra Valley – historical through present
According to Lawrence Citation(1895, p. 212–213), 11 great earthquakes have occurred in and around Kashmir valley since the fifteenth century AD. In the nineteenth century itself there have been four severe earthquakes and it is noteworthy that in the last two, of 1864 and 1885, the most violent shocks were felt in an elliptical area whose focuses were at Srinagar and Baramula. Regarding the other two earthquakes of the nineteenth century, Lawrence states ‘In 1827 there was a severe earthquake (this must be the event of 1828; see below) and the city was almost destroyed’, and also refers to the earthquake of 30 June 1857, the day Maharaja Gulab Singh (the first of the Dogra rulers) expired. In addition to these historical records, some of which are discussed below, earthquakes that dates back 500 and 2200 yr. B. P. along the Muzaffarabad fault strand have also been identified (Kondo et al. Citation2008). Relevant portions (from rare and out of print books) of descriptive accounts for pre-1900 earthquakes are retained as in original and given in smaller fonts.
3.1. 24 September AD 1501 (No. 1; ; )
This earthquake is mentioned only by Iyengar et al. Citation(1999). Quoting ‘Tarikh-e- Hasan (Pir Hasan Shah)’ it is stated that during the reign of Sultan Fatteh Shah (in Kashmir from A.H. 902 to 911 corresponding to AD 1496–1505; see Prinsep, 1836) on 12th of Asvach Pasi of 907 H (24 September 1501 AD):
A severe earthquake occurred in the previous night. A large number of creatures of God lost their lives and houses were raised to ground. The earth and the sky remained in tumult for a period of three months after which normalcy was restored.
3.2. AD 1552 (No. 2, ,
Possibly the first reference for this earthquake is in Prinsep's Citation(1836) table where he mentioned of an earthquake in Kashmir during the period of King Ibrahim II (set up by Daulet Chakk) in A.H. 960, corresponding to AD 1552. Prinsep's source of information is possibly those from Persian documents which have also been mentioned by Iyengar et al. Citation(1999) while discussing the AD 1555 earthquake, though in all such documents (Haider Malik Chadura Rasul Mulik in ‘Tarikh-e Kashmir’; Narayan Kaul Ajiz in ‘Tarikh-e Kashmir’; Khwaja Muhammad Azam Deedamari in ‘Waqiat-e Kashmir’ and Pir Hasan Shah in ‘Tarikh-e Hasan’) the year is mentioned as A.H. 960 which is AD 1552 (and not 1553 as given by Iyengar et al. Citation1999) and later on referred by researchers (Baird-Smith Citation1843; Chandra Citation1978; Quittmeyer & Jacob Citation1979; Oldham Citation1882). It may be noted that these documents do not refer to any earthquake from the Kashmir valley that occurred in 1555 AD. IMD catalogue also lists this earthquake and assigns a location 34.00N: 74.50E with a high magnitude of 7.5. The present authors are of the opinion that this 1552 earthquake and the next one in i.e. the 1555 earthquake (which has received more acceptances in the contemporary literature) are the same events, though all available details are described under the AD 1555 earthquake.
3.3. September AD 1555 (No. 3, , )
This earthquake has been discussed by Iyengar et al. Citation(1999) quoting from the translation by Dutt Citation(1887) of Shuka's Rajatarangini. The version of Dutt Citation(1887) is as follows:
In the month of Asvina of the year 30, there occurred frequently earthquakes on account of the wicked acts of the king, as if the earth suffered from flatulence. The planet which causes calamity is assuaged by various acts, by gifts of land to independent people, by giving back to men their properties, which had been robbed, and by like deeds. Now there occurred an earthquake at the second watch of night when all men were asleep, and it destroyed many people. It caused holes in the ground, and travellers going on their way misled at every step. Houses fell into these holes at night and people, anxious to get out from their houses in the morning, issued by breaking through the roof. On this occasion wooden houses fell into the water of Vitasta, and when they had floated down for seven kroshas, the people who were in them awoke and came out.
The confusion caused by the earthquake in towns of Hassanpura and Hosainapura, situated at some distance across the river, can be seen even to this day. Pitiable cries of lamentation of the much afflicted people were then heard calling out O father! O mother! O friend! O brother! in different places, which made the heart feel as if it were struck by a thunderbolt. At this time the sky appeared terrible with claps of thunder, the movements of the stars were stopped, and the land was agitated like a gourd on the waves. The mind of the people became troubled with fear of the earthquake, and they felt no affection for sons or friends or wives or for good men or for kind hearted people or for any object whatever. It is owing to the glory of the holy shrines of Vijayeshvara, Marttanda and Varahakshetra that fears and apprehensions from earthquake were not felt by the inhabitants of these places. The earthquake continued for several days, occurring several times every day, and all the people lived under canvas. When some time had elapsed, and all men had returned to their home, Dauluta Chakkaka governed the whole country with a strong hand…
Iyengar et al. Citation(1999) add that the year 30 is Laukik year used in Rajatarangini and the month Ashwin corresponds to September; the year is 1555. They further concluded from the description of Shuka that at Vijayeshvara, Marttanda (located 5 km east of Anantnag) and Varahakshetra (Varahmula or present day Baramula) were less affected; this might not be the right interpretation as the statement in the original document only indicated that fears and apprehension were less to the inhabitants who were confident by virtue of being close to the holy shrines. As per the Persian documents when the site Bijbehara (33.79N: 75.10E) was so much affected, at least the sites like Marttanda [5 km east to Anantnag (33.73N: 75.16E)] might have also been largely affected. Another point of worth noticing is that Daulata Chakkaka ruled Kashmir during 1552 (see Prinsep Citation1836).
Iyengar et al. Citation(1999) also quote from two other Persian accounts (Tabaqat-e Akbari, II and Tarikh-e Ferishta, II) describing the earthquake; both of these refer to the year as 962H, when there was a great earthquake in Kashmir and many villages and towns were destroyed. The villages of Jalu (or Nilu) and Dampur (or Adampur) with their buildings and trees were shifted from one bank of Bihat (Jhelum) to the opposite bank; about 600 people perished in the village of Mardar (or Marwar or Marvardan), situated at the foot of a hill, owing to a landslip. To our opinion the reference of ‘Adampur’ must be ‘Awantipur’.
As mentioned above under the 1552 earthquake, four Persian documents describe the event to have occurred during 960H. Quoting ‘Tarikh-e Kashmir’ records by Haider Malik, Iyengar et al. Citation(1999) notes that during the reign of Habib Shah in the year 960H an extraordinary and unique earthquake occurred. It brought to mind the memory of ‘Dooms Day’. Of the many uncommon occurrences due to this earthquake are: sinking of many houses under the ground…; on all sides ruins and debris of houses were visible due to the shock of earthquake…; two hamlets, Hasanpur and Husainpur, located on the opposite side of the river, within village Bilarah (Bijbehra), near the pass Nandmarg shifted sites, respectively, across the river at midnight, etc.
The other three Persian documents referred by Iyengar et al. Citation(1999), all mentions about the shifting of the two villages across Vaisho (Vesav, Vesha, Vasav, ancient Visoka; a tributary of Jhelum) and not across Vitasta (River Jhelum, a tributary of Chenab) as was originally mentioned in Rajtarangini. Other important observation/information includes ‘this is the fourth incident of earthquake in the Kashmir valley, during the period of Ismail Shah (in 960H)’ (Tarikh-e Hasan) [Ismail Shah was the ruler in 963H corresponding to AD 1555 (Prinsep Citation1836)]; the catastrophic cycle remained for a week but took two months for restoration of normalcy; some earlier springs disappeared and some new springs gushed out from the ground; wide cracks appeared at many places on earth, etc.
From the discussion above it emerges that even the original documents refer to both the years AD 1552 and AD 1555, though strongly vouches for the former (see also Newall Citation1854, p. 424). However as the descriptive accounts refer to the same epicentral tract, this is a single large earthquake similar to the size of the 2005 Muzaffarabad earthquake.
3.4. 22 June 1669 AD (No. 4, , )
As per reports the earthquake of 22 June 1669 AD was only a moderate event that was felt in the Kashmir valley. The epicentral parameters assigned by Chandra Citation(1978) and the IMD catalogue (35.00N:77.00E) being too far to be experienced from the Kashmir valley, the location given by Quittmeyer and Jacob Citation(1979) [34.00N:76.00E] is adopted. On the other hand, the earthquake of 23 June AD 1669 (No. 5; was located far to the west [Attock; 33.90N: 72.30E assigned by IMD, Chandra Citation(1978) and Quittmeyer and Jacob Citation(1979)] to cause any sensational effect in the valley. Thus, the information provided by Iyengar et al. Citation(1999) quoting Persian documents for the 23rd event should possibly be linked to the earthquake of 22 June.
3.5. 26 June 1828 AD (No. 7, ,
All available published documents and also IMD catalogue report the 1828 AD earthquake to have occurred on 6 June. However, following the detail account of Vigne Citation(1844) the date has been revised to 26 June (; No. 7). According to Lawrence Citation(1895) that in the year 1827 there was a severe earthquake and the city (Srinagar) was almost destroyed. The author was in all probability referring to the 1828 earthquake that devastated Srinagar. An account from Vigne Citation(1844) states:
On the night of the 26th of June, 1828 at half-past ten, a very severe shock was felt, which shook down a great many houses, and killed a great number of people: perhaps 1000 persons were killed, and 1200 houses shaken down; …The earth opened in several places about the city; and fetid water, and rather warm, rose rapidly from the clefts, and then subsided. …Huge rocks and stones came rattling down from the mountains. On that night only one shock took place: but just before sunrise there was another, accompanied by a terrific and lengthened explosion, louder than cannon. On that day there were twenty such shocks, each with a similar explosion. The inhabitants were, of course, in the open country. The river sometimes appeared to stand still, and then rushed forward. For the remaining six days…and the whole of the two next month's… there were never less than 100, and sometimes 200 or more shocks in the day, all accompanied with an explosion …On the sixth day, there was one very bad shock, and on the fifteenth, at three o’clock, was the worst… At the end of the two months, the number decreased to ten or fifteen in the twenty four hours, and the noise became less, and the earthquakes gradually ceased. About this time the cholera made its appearance. A census of the dead was taken at first, but discontinued when it was found that many thousands had died in twenty-one days.
3.6. 24 January AD 1852 (No. 8, , :
Another significant earthquake from the western part of the study area struck on 24January AD 1852 (; No. 8). A note on this earthquake was published by Merewether Citation(1853) that states:
On the morning of 2nd day of the Mussulman month ‘Rubbee- ul –Akbir’ (corresponding to the 24th of January of our reckoning), at the time of the appearance of the false dawn, that is about 4 o’clock, a very severe shock of an earthquake was felt at Kahun, the principal Fort in the Murree hills and residence of the chief and main portion of that tribe; — one side of the Fort wall was thrown down, the remainder much shattered, and the greater number of the houses inside also overthrown, burying beneath the ruins many men, women, and children, with some cattle, and a good deal of property besides… At the same time that this disaster occurred at Kahun another even more fearful calamity overtook a portion of the tribe, living with their cattle in a large cave, some little distance to the Northward. The hill in which the cave was, was violently shaken, and fell burying nearly every living being at the time within it. The road by Nuffoosk to kahun has been completely closed by the hill falling, and filling up the pass through which it formerly went. A considerable increase to the flow of water in the Lahree river has taken place; so much so that water is now flowing past where it never even came before, excepting after heavy rain. According to the last accounts received, 260, Mussalmen, women and children, have been killed, and upwards of eighty Hindoos, with a large quantity of cattle; …The earthquake appears to have been felt throughout Cutchee; at Gundava, Dadur, Bhagh, Lahree, Pooljee, Chuttur, at the same time as it was at Khanghur, and at kahun about 4 o’ clock on the morning of the 24th ultimo.
3.7. 2 March AD 1878 (No. 13, ,
Wynne Citation(1878) described this earthquake as
On the 2nd of last March the most severe shock which has occurred within the memory of the present generation, so far as I can learn, affected the whole of the northern part of the province. With regard to it I have collected a few notes, which I offer more as a record of the event than as an exhaustive or abstrusely scientific treatment of the subject. Accurate details concerning so huge an area are not within the reach of every one to collect, and I have had a little difficulty in learning even so much as I have put together.
The earthquake was damaging at Abbottabad, Kohat, Peshawar, Attock and Rawalpindi and strongly felt at Jhelum, Murree, Simla and Mussoorie.
3.8. 30 May AD 1885 (No. 14, ,
Descriptive account along with an isoseismal map for the earthquake of 30 May AD 1885 [; No. 14] was published in the GSI Records (Jones Citation1885a, Citation1885b); Bashir et al. Citation(2009); estimated EMS (European Macroseismic Scale) intensity VI–VII (Bilham et al. Citation2010) and assigned M = 6.2–6.3 (Ambraseys & Douglas Citation2004; Szeliga et al. Citation2010). According to Jones Citation(1885a, Citation1885b):
In spite of the comparative mildness of the shock, the loss of life was very great, being in round numbers about 3000. The cause of this is to be looked for in the very insecure manner of building in vogue. In a very considerable number of the cases in which huts were damaged, the supports of the roof had given way and allowed it to subside, frequently carrying the walls down with it leaving only a mass of rubbish to indicate the spot where the house had stood.
The greatest damage has been done over an irregularly elliptical area, the long axis of which is 10 miles and the short axis 6 miles long, and the superficial area about 47 square miles, and nearly symmetrically disposed about the seismic vertical. Within this area, the destruction was complete, whole villages being almost entirely destroyed and many lives lost. This corresponds to the meizoseismal (Intensity VII + in MSK scale) area of Mallet.
The area outside this, corresponding to Mallet's first isoseismal, includes the area within which large portions of villages and towns were thrown down and persons killed. This is included by a line passing east of Srinagar through Magaon south of Baramula and across the Jhelam near Gingal, then passing north of Sopur and round again to the south of Srinagar. It includes an area of about 500 sq miles.
Outside is again another area of about 3000 sq miles (second isoseismal) including those places from which slight damage to buildings etc. is reported to have occurred, but it is probable that even within this area there was some loss of life. It is indicated on the map by the broken line passing north of Gurais to east of Titwal on the Kishengunga river, west of Chikar, southeast of Bagh, and south of Punch, at or near all of which some damage to buildings, chiefly forts, is reported. From Punch to Gurais there are no reports, and the true course of the line is uncertain.
Area under third isoseismal is large, including the places where the shock is reported to have been perceived viz., Peshawar, Gilgit, Simla, Sabathu, Dalhousie, Lahore etc.A large landslip occurred at Larri-dur, a place about 7 miles south of Baramula. This village is situated upon a hill lying NW-SE, composed of slightly hardened Karewa clays resting upon sandstones and dipping to NE at 5-10°. Above the clay is surface soil of varying thickness. The upper 30 feet of clay and surface soil has slipped along to the dip, exposing a fresh smooth surface of clay. The line of parting ran along the length of the hill, and a fissure has been formed along this line varying in width from 30 feet at the SE end to about 500 yards at the NW end and with a length of about half a mile.
In many places, as at Patan, Dubgaon (at the junction of the Jhelam and Pohra rivers), along the banks of the river at and above Baramula, numerous fissures were formed in the alluvial soil and all running roughly parallel to river banks or else across the slope of hills. In the neighbourhood of many of these fissures water and fine sand were thrown out, and the villages stated that there was a strong sulphureous smell given off from the sand for several days. In one case at Nila, near Patan, an inflammable gas without odour being slowly evolved. Several springs were affected by the earthquake, the flow of water being increased for periods of time ranging from a few hours to as many as eight days.
The country occupied by the meizoseismal area is entirely composed of recent alluvium, and that within the first isoseismal line is almost entirely of the same character, the Karewa beds (Pleistocene alluvium) coming into the NW of the area in the neighbourhood of Baramula, and down the river below Baramula the alluvial deposits are underlaid at short depth by the more indurated rocks of the Panjal system, which also appear to the east of Srinagar.
3.9. 4 April 1905 (No. 15, , )
The next important and the most damaging earthquake within the study area is that of the 4 April 1905 Kangra earthquake that locates to the southeast of the Kashmir valley. The details on this earthquake are available (GSI Records, XXXII, Pt 4 1905), Middlemiss Citation(1910) and several other published documents. Recent research articles (Ambraseys & Douglas Citation2004; Hough et al. Citation2005), among others, added several unknown facts to our knowledge base. It may be noted that about 20,000 human lives were lost due to this earthquake. There are two separate epicentral locations of this earthquake: one with 33.00N: 76.00E, focal depth 50 km (Centennial Catalogue by E. R. Engdahl and A. Villasenor 2002; Ambraseys & Douglas Citation2004) and the other with 32.30N: 76.20E (IMD source). For this paper, we adopted the epicentral location of former (see ) for its wider acceptance.
According to Middlemiss Citation(1910), the innermost isoseismal X [(R-F Scale) ≈ IX+ in MSK Scale)] encloses an area of about 200 sq miles. Its curve roughly cuts Dharmsala, Rehlu, Daulatpur, Bawarna and Palampur. It includes much of the Kangra valley and portions of the lower slopes of the Dhauladhar range. The next isoseist IX (≈ VII–IX in MSK Scale) though less well defined encloses an elliptical area of about 1600 sq miles. On the west and south the isoseismal was located with considerable accuracy passing through Shahpur, Ranital and Sujanpur; but further ESE by Mandi and Manglaur it is less well defined. The isoseist VIII (≈ VII–VIII in MSK Scale) forms two separate close curves: one in the Kangra–Kulu area and the other, a smaller one, in the Dehradun–Mussoorie area. The former forms an elliptical area of about 2150 sq miles including localities Telokenath, Jawalamukhi, Suket, Rampur, Manikaran, Kot, etc.
3.10. 2005 Muzaffarabad earthquake (
After 100 years of the Kangra earthquake of 1905, a devastating earthquake of Mw7.6 had occurred in the Kashmir Himalaya (Jhelum re-entrant) on the morning of 8 October 2005. The tremors were felt in a radius of over 1000 km with damage taking place in an area of 36,000 sq km. The meizoseismal zone was located in Pakistan and in the Kunhar and Neelam (Kishanganga) valleys of Kashmir where the death and destruction was unprecedented. On the Indian side, heavy damage was restricted to Uri Tehsil of Baramula District and Karna (Tangdhar) Tehsil of Kupwara District.
The isoseismal map (; after Pande et al. Citation2006) with surface rupture, an important document for engineering design purpose, has been prepared incorporating the field data collected by GSI team from the Indian side and data from authoritative sources in Pakistan. The epicentral tract of the earthquake experienced an intensity of X on MSK-64 scale. This zone encompassed Balakot town and Muzaffarabad city. In this and adjoining sectors, the event generated a very large number of landslides that showed concentration along a 65-km long belt trending in N35°W–S35°E direction and extending between Balakot and Bagh. In this segment, coseismic rupturing of Muzaffarabad and Tanda faults was observed. The Uri Tehsil experienced an intensity of IX, whereas Srinagar was subjected to intensity VII.
Furthermore, the earthquake triggered several thousand landslides, with roads closer to epicentral area in the mountainous region suffered extensive landslides (Rai & Murty, Citation2006). Analysis using high-resolution images from the Space Imaging, Inc. IKONOS satellite showed that landslides occurred along the active faults and were concentrated on the northeastern side (Fujiwara et al. Citation2006). The landslides were mainly rock falls and debris falls, although translational rock and debris slides also occurred (Owen et al. Citation2008). The failures were associated with six geomorphic–geologic–anthropogenic settings: (i) highly fractured carbonate rocks comprising the lowest beds in the hanging wall of the likely earthquake fault; (ii) Tertiary siliciclastic rocks along antecedent drainages that traverse the Hazara–Kashmir Syntaxis; (iii) steep (N50°) slopes comprising Precambrian and lower paleozoic rocks; (iv) very steep (>>50°) lower slopes of fluvially undercut Quaternary valley fills; and (v) ridges and spur crests (Owen et al. Citation2008). A further study (Kamp et al. Citation2008) using imagery and GIS supports the earlier views that (i) earthquake-triggered landslides are concentrated in specific zones associated with event-controlling parameters; and (ii) in the Western Himalaya deforestation and road construction contributed significantly to landsliding during and shortly after earthquakes.
4. Seismotectonic evaluation
The damage scenarios and analytical review of seismic hazards of the larger historical earthquakes occurring in the Western Himalaya have been described in the earlier section. However, these earthquake events and accompanying hazards are not isolated but products of ongoing tectonism that occurred within the seismotectonics domains whose tectonic elucidation will be carried out in the following section with contemporary earthquake and CMT fault plane solution data. For this purpose, the earthquake epicentre plots (Mw ≥ 4.0 within time domain 1964–2010) on tectonic elements (after Dasgupta et al. Citation2000) are carried out (). The plot and our previous analysis (Mukhopadhyay et al. Citation2011a, Citation2011b) have brought out five distinct seismotectonics zones (A–E of ) where earthquake dominantly clusters – from west to east, they are Kohistan arc (A); Kashmir–Hazara Syntaxis (B); Nanga-Parbat (Western Syntaxis) (C); Karakoram (D) and Himachal Himalaya (E). Further evaluation is carried out through seismo-geological cross sections; which are drawn with earthquake EHB relocated parameters, topography and surface geology to understand the plate configuration in conjunction to the known seismo-tectonic model of the Himalaya. The earthquake data cross checked with EHB-relocated parameters are extracted to draw four seismo-geological sections (A–A′, B –B′, C–C′ and D–D′) across the clusters (A–E) which are further endowed with some well-constrained fault plane solutions with beach ball diagrams to illustrate the stress regime across the arc ().
4.1. Kohistan arc (Zone A of )
The Kohistan arc with rocks of Mesozoic Island arc system encompasses the Kohistan arc tectonic block, an extension of Pamir–Hindukush seismic belt. Pegler and Das Citation(1998) have determined the shape of the seismic zone in Pamir–Hindukush region (30°–42° N; 68°–78° E) with relocated hypocentral data and pointed out that the seismic zone under the Hindukush follows the classical pattern of subducting slab controlled by gravity, whereas Pamir region indicates slab deformed due to flow of upper mantle. The intermediate focus (41–70 km) and shallow focus (0–40 km) seismicity are common in the Kohistan arc cluster lies on the top of Kohistan/Ladakh plutonic complex (magmatic arc). This zone has generated low to moderate seismicity with only one major earthquake in 22.5.1871 (Ms 6.0) near Gilgit (No. 11 of ; in historic past. Seismic activity is related to north–south vergence of Indian and Asian plates. Our previous study (see of Mukhopadhyay et al. Citation2011b) has also indicated activation of an out-of-sequence (?) thrust west of Gilgit in this segment that is producing the bulk of present seismicity. Moderate slips recorded by the earthquake in this sector are up dip along the rupture plane and controlled by thrust movement.
4.2. Kashmir–Hazara Syntaxis (Zone B of )
The seismotectonic characteristics and huge damage potentiality of this zone are narrated in details in our earlier publications with estimation of Maximum Capable Earthquake (MCE) of Mw 8.0 earthquake (Mukhopadhyay et al. Citation2011a, Citation2011b). Historical large earthquakes of 24 September 1501, 1552, 26 June 1828, 24 January 1852, 2 March 1878, 30 May 1885 (Nos. 1, 2, 7, 8, 13, 14 of ; ) and most recently 2005 Muzaffarabad earthquake have occurred in this zone and adjoining Kashmir valley. The occurrence of these large earthquakes and future predictions naturally elevated the seismic hazard scenario. The seismo-geological section drawn through the Kashmir–Hazara in our previous study (see of Mukhopadhyay et al. Citation2011b) has brought out subducted Indian Plate beneath the Eurasian Plate and accretionary Himalayan, Kohistan and Karakoram arc litho-packages overriding it. The seismic section shows seismicity from two depth bands, shallow focus (<30 km) and also from moderate depth (50–70 km) (; Mukhopadhyay et al. Citation2011a). Along this zone and south of it, among the major neotectonic faults, the Jhelum fault (JF) is regionally most extensive wrench fault that shows left lateral strike-slip motion; its conjugate set is Mangla Fault (MF) with right lateral strike-slip motion. The seismically active Shinkiari Fault in the syntaxis is parallel to JF and Attock fault (AF) is parallel to the Himalayan trend.
Earthquakes in this zone have nucleated mostly along Main Boundary Thrust (MBT) and recent reactivation of Muzaffarabad and Tanda faults. MBT shows both thrust and oblique slip movements. CMT solutions indicate high angle tension along NW–SE direction and low angle compression along NE–SW direction (; , 5(b) and ). Fault plane solutions also indicate major thrusting along a NW–SE fault plane dipping moderately towards NE (, 5(b) and 6). In Kashmir valley towards east and Peshawar basin in the west, the earthquakes show thrust mechanism. The historical earthquakes (Nos. 1, 2, 7, 14 and 52 of ; ) with epicentre in Kashmir valley are related to MBT. Similarly, most recently, the 2 September 1963 Bagdam earthquake (33.9N : 74.7E) which damaged over 2000 houses and 28 December 1974 Pathan earthquake which affected 60,000 population in the area of Swat and Indus Kohistan are of importance. The earthquakes in the Peshwar basin (Nos. 5, 8, 13 of and ) have nuances with activated Attock Thrust.
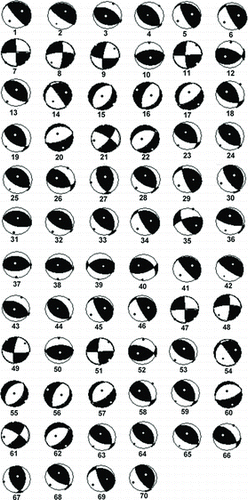
Table 2. CMT solutions (source: http://www.seismology.harvard.edu) for 70 earthquakes (period 1980–2009) in the Western Himalaya. The solution parameters are discussed in the text. The value of first column (No.) is plotted on the maps () and beach ball diagrams ().
Figure 5. (a) DEM with Tectonic planes and locations of CMT solutions (70 numbers of ). No. of is placed as number. The blow-up version with locations of CMT data (b) Kashmir–Hazara Systaxis with mainly aftershocks of 2005 Muzaffarabad earthquake and (c) part of Nanga-Parbat Syntaxis.
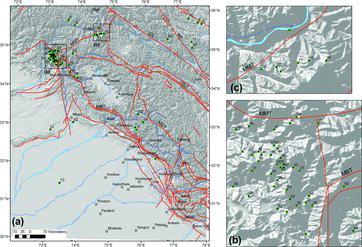
Figure 6. Beach ball diagrams of 70 numbers of fault plane solutions listed in and located on the map with numbers ().
The Muzaffarabad earthquake (Mw 7.6 of October 2005; plot no. 23 of and ) and its aftershocks form a NW–SE elliptical cloud (see Mahajan et al. Citation2006) with isoseismal lines oriented in the same direction (; Pande et al. Citation2006) indicating a close fault–thrust interaction between Muzaffarabad fault, Tanda Fault and splays of MBT. Muzaffarabad earthquake occurred in Indus–Kohistan seismic zone () accompanied by a rupture length of more than 75 km () that cut across the Kashmir–Hazara syntaxis and reactivating the Muzaffarabad and Tanda faults (Avouac et al. Citation2006). North of Muzaffarabad the surface rupture coincides approximately with the MBT, on the southwestern flank of the syntaxis, although the two faults have opposite dip angles (Avouac et al. Citation2006). Towards north, the rupture abruptly terminates at the hairpin turn of MBT suggesting structural control. The fault offset is 4 m on average and peaks to 7 m northwest of Muzaffarabad (Avouac et al. Citation2006) with a net-slip of 5.4 m along the fault strand (Kondo et al. Citation2008). Focal depths of the aftershocks indicate that the seismic activity is confined to a narrow depth zone between 5 and 10 km. The distribution of earthquake in this zone is indicative of extension of Indus–Kohistan seismic zone in the Kashmir–Hazara syntaxial area and activation of more than one fault (Monalisa Citation2009). The Coulomb stress mapping indicates increase of stress in the northwest ofthe rupture along the trend of Indus–Kohistan seismic zone (Parsons et al. Citation2006). A similar stress increase along southeast of rupture near Kashmir Basin indicates seismic vulnerability of Kashmir basin, where faults participated in the large earthquakes of 1555 and 1885 (Nos. 3 and 14 of ). This indicates recurrence pattern of large earthquakes in this zone. Moreover, the high gravity value in the epicentral block indicates thrusting accompanied by mass movement of high-density rocks along the syntaxial bend of MBT (Tiwari et al. Citation2009). The tectonic loading of the high-density Muzaffarabad wedge thrust between the wedge top and the descending Indian lithosphere coupled with continued flexure tectonics and block rotation provoked this earthquake (Khan et al. Citation2010). They also opined that the western limb of the buckled unit (containing both competent and incompetent rocks) of Kashmir–Hazara Syntaxis gave rise to the development of a new thrust and associated oblique slip in the inner arc of the competent rock unit produced the earthquake.
Furthermore, the coseismic landslide occurrences show a clear spatial association with the pre-existing faults such as the JF and MBT as indicated earlier and alignment of landslide along a particular direction also indicates reactivation of a new fault (Kumar et al. Citation2006). Large to moderate slip recorded by the present and historic earthquakes in this sector are up dip along the rupture plane and controlled by thrusting.
The seismo-geological section A–A′ () along the Kohistan arc and Kashmir–Hazara syntaxis (Zones A and B) has brought out the configuration of subducted Indian Plate beneath the Eurasian Plate and the accretionary Himalayan, Kohistan and Karakoram arc litho-packages overriding it. This also intersects the visible spatial seismic clusters of Kohistan arc and Kashmir–Hazara syntaxis. The MBT and MMT are the most active tectonic planes along this section line showing majority thrust with subordinate strike-slip movements, respectively. The Hazara–Kashmir cluster around traces of MBT and activated Muzaffarabad fault has thrust plane solutions with high angle tension along NW–SE direction and low angle compression along NE–SW direction. The fault plane solutions also indicate thrusting with subordinate strike-slip motion along a NW–SE fault plane dipping moderately towards SW.
4.3. Nanga-Parbat Syntaxis (Zone C of )
This zone shows low to moderate seismicity with occurrence of an earthquake of Ms 5.2 (1.8.1947; No. 28 and ) in historical times. Though seismically insignificant, the zone is tectonically interesting and required elucidation. Actively deformed uplifted dome with high-grade gneissic rocks of Nanga-Parbat–Harmosh massif at its core is characteristic of this zone. In fact, Nanga-Parbat is a structural enigma from the viewpoint of seismic activity and tectonic movement is quite comparable to that for the Mt. Everest in the Nepal Himalaya (see Poretti et al. Citation2010 for detailed discussion). The flanks of the Nanga-Parbat dome are represented by seismically active shear zones/faults. The geodynamic interactions of these shear zones/faults aided by mass removal due to deep river erosion of Indus have exposed the exhumed Cenozoic metamorphic rocks, granulites and granites (Nanga-Parbat massif) of the Indian Plate. The earthquakes surrounding the Nanga-Parbat Syntaxis are generated from the Indian Plate. The western flank of the dome with active Raikhot fault and Diamer shear zone is seismically more active in comparison to the eastern flank that shows diffused seismicity. This is probably because of bending of Nanga-Parbat area towards east as suggested by Poretti et al. Citation2010 from preliminary analysis of global navigation satellite system network data. The fault plane solutions show oblique slip/strike-slip motions along N–S to NE–SW plane and normal fault movements along NE–SW trending moderately SE dipping fault planes (, 5(c) and ). To compensate the rapid vertical uplift occurring in this zone, normal (gravity) faulting at shallow crustal level (∼20 km) occurred as a part of crustal adjustment. The tensional axis is sub-horizontal oriented NW–SE direction, whereas the compressional axes vary in plunge and its orientations. The thickening of the crust ∼75 km compared to the surrounding regions is worth mentioning (see Mukhopadhyay et al. Citation2011b). The fault plane solutions and concentration of earthquakes along the Raikhot fault support the hypothesis of upward directed mass flowage, uparching, rapid erosion by contemporaneous rivers and tectonic aneurysm of Indian Plate (Zeitler et al. Citation2001; Koons et al. Citation2002, and references therein). The uparching and thickening of the Indian Plate (as shown in the sections of ) is further corroborated the results generated by the micro-seismic surveys conducted by Meltzer et al. Citation(2001). They have also found a bow like upward shape of seismicity following the anti-formal arch at a shallow crustal level. The Magneto Teluric surveys (Park & Mackie Citation1997, Citation2000) conducted in this region have also pointed out a resistive zone at around 50-km depth below the massif, and another zone situated in top 1 km below the surface limit is quite conductive. Similarly, the zone around Raikhot fault from surface to a depth of 10 km is also conductive. The resistive zone has been interpreted as dehydrated zone with insufficient interconnected fluid phase, whereas the conductive zone is hydrated by percolating water from top and possible pore-pressure perturbations in interconnected fluid zones. Seismic tomography conducted in this region has predicted lower velocity lozenge of crust extended at a depth below the core of the massif and indicates rapid exhumation, high thermal gradient, crustal fluid flow and pockets of decompression melting, and subsequent generation of young metamorphic and igneous ages of the rocks (Meltzer et al. Citation2001; Zeitler et al. Citation2001; Zeitler & Chamberlain Citation2001).
The sections (B–B′ and C–C′), one along axial trace and the other along profile section of the popup anti-formal structure, are constructed () to define the crustal structure of Nanga-Parbat region. This zone has five fault plane solutions. The beach ball indicates strike-slip motions along N–S to NE–SW plane, whereas others show normal fault movements along NE–SW trending moderately SE dipping plane. The pure strike-slip solution along N–S plane with vertical dipping fault plane indicates a possible adjustment of the crust following rapid uplifting and mass flowage. Moderate slips recorded by the earthquakes in this sector are mainly down dip or along the strike of the rupture plane.
4.4. Karakoram arc (Zone D of )
The seismicity around northeastern side () of the Western Himalaya is the Karakoram sector that shows seismicity from both shallow and deep focus zones. The most conspicuous faults are dextral strike-slip Karakoram fault that extends 1000 km from the eastern boundary of Pamir syntaxis to Kumaon Himalaya and its conjugate one is Altyn Tagh fault. Towards south, Shyok suture separates the Karakoram fault from Indus–Shyok belt. This sector does not show major large magnitude seismicity. Historical seismicity of magnitude ranging from 5.5 to 6.0 (Nos. 18–21 and ) formed due to movement along Shyok suture zone and Karakoram fault. The seismo-geological section (by our previous study, see of Mukhopadhyay et al. Citation2011b) along Karakoram sector indicates activation of Karakoram and Altyn Tagh faults. The fault plane solutions indicate strike-slip movement of the crust along E–W to ESE–WNW striking planes dipping at moderate to high angle on either side of Karakoram and Altyn Tagh Faults. This zone, by and large, demonstrate strike-slip trans-tensional tectonism between MKT and Altyn Tagh Fault (ATF) in the Karakoram domain where litho-units experience arc-parallel mass flowage towards east (Seeber and Pecher Citation1998). Moderate slip has been recorded by the earthquakes in this sector are mainly along the strike of the rupture plane.
4.5. Himachal Himalaya (Zone E of )
The seismic zone in lesser Himalaya towards southeast of the Jhelum re-entrant is designated here as Himachal Himalaya. This is one of the most seismic prone zones of entire sub-Himalaya. The seismotectonic characteristics and damage potentiality of this zone are described in details in our earlier publications with estimation of MCE as Mw 8.29 (Mukhopadhyay et al. Citation2011a, Citation2011b). In this belt, the northernmost structural element is MCT. The lesser Himalayan rocks are separated from frontal belt by MBT. The southernmost limit of the frontal belt is marked by MFT. Within MBT and MFT, there are several subsidiary thrusts such as Vaikrita, Jwalamukhi and Drang thrusts. Evidences of neotectonic activity are marked along several places of MBT and western part of Jwalamukhi thrust. The Sundernagar and Kishtwar faults within this fold thrust belt are important transverse features. In the foothill regions, the transverse Ropar fault placed NW of Chandigarh and Jamuna tear with sinistral movement in the east are important neotectonic faults. The seismo-geological section (by our previous study, see of Mukhopadhyay et al. Citation2011b and of Mukhopadhyay et al. Citation2011a) along this zone show that seismicity is shallow focus and all known tectonic planes are active and manifested by seismicity of various degrees. This zone is characterized by large earthquakes in the past such as September 1555 (No. 3 of ) and devastating 4 April 1905 Kangra earthquake (No. 15 of ) in recent time. The September 1555 (M 7.6) is possibly related to MBT. Similarly, if the epicentral location (33.00N: 76.00E) of the 1905 Kangra earthquake (Ambraseys and Douglas, Citation2004) is correct, then the earthquake may be generated by movement along MBT (?) or allied sympathetic thrust. Otherwise, if the epicentral location as given in IMD catalogue (32.30N: 76.20E) is considered then the scenario changes (see Dasgupta et al. Citation2000; SEISAT-05) and this major earthquake could be due to activity of Intra-Siwalik structure like the Jwalamukhi thrust. The moderate magnitude earthquakes (Nos. 9, 16, 39, 49 of ) are the product of movement along the frontal thrust belt. The overall fault plane solutions indicate thrusting along plane striking NW–SE dipping at low angle towards NE related to southwesterly movement of Main Frontal Thrust (MFT) and MBT (; and ). The movement of the thrust planes has given rise to four important earthquakes in recent times; they are 22 June 1945 Chamba earthquake, 23 August 1980 Kathua earthquake, 26 April 1986 Dharamshala earthquake and 24 march 1995 Chamba earthquake. These earthquakes cause severe damages to the buildings, producing earth fissures and sometimes accompanied with loss of human lives.
It is worth noticing that the epicentral zone of the 1555 (or 1552) earthquake in Kashmir valley is presently producing sporadic low to moderate magnitude shallow focus shocks (). The question may be asked whether this zone is currently undergoing spatio-temporal quiescence or it belongs to strain shadow zone of 2005 Muzaffarabad earthquake? More detailed study is required to resolve the future seismic potentiality of Kashmir valley.
The section (D–D′, ) along Karakoram arc and Himachal Himalaya (Zones D and E) was drawn across Himalaya, Ladakh and Karakoram arc to define the tectonic movement along the Main Himalaya–Ladakh–Karakoram arc segment. Along this line, all known tectonic planes are active and manifested by seismicity of various degrees. The Himachal Himalayan zone has fault plane solutions that indicate thrusting along plane striking NW–SE dipping at low angle towards NE. These solutions point out southwesterly movement of MFT and MBT. The Karakoram sector along the section line towards north has fault plane solutions that indicate strike-slip movement of the crust along E–W to ESE–WNW striking planes dipping at moderate to high angle on either side of Karakoram and Altyn Tagh faults. Large to moderate slip recorded by the present and historic earthquakes in the Himachal Himalaya are mostly up dip along the rupture plane and controlled by thrusting, whereas the slip along Karakoram arc is mostly along strike of the arc.
5. Analysis and evaluation of b-value
The b-value analysis has been carried out as a sequence to identify the precursory trend and crustal heterogeneity in the seismic zones described in Section 4. More precisely, we analyse the b-value pattern through documentation of both spatio-temporal (after Smith Citation1986) and temporal (after Meredith et al. Citation1990) changes in b-value to evaluate whether there is any significant change before the large earthquake of 8 October 2005 Muzaffarabad earthquake. The b-value is calculated by maximum-likelihood method (Aki Citation1965; Ustu Citation1965; Bender Citation1983), b = log10e/(M−Mmin) = 0.43/(M−Mmin), where M denotes the mean magnitude and Mmin denotes the minimum magnitude of completeness in the given sample. As b-value is dependent on data, earthquake data have been treated separately as per techniques described by Kulhanek Citation(2005) to make the calculated b-value statistically robust and tectonically significant. For calculating b-value, earthquake data from the study area in 1° × 1° block with 0.5° overlapping both along latitude and longitude are selected; time period is chosen in such a way that more earthquake data can be subjected to calculation. The b-values obtained for each block are plotted at the centre of the block and contoured. Data of three consecutive time domains (1969–1980, 1981–1992 and 1993–2004) prior to the Muzaffarabad earthquake (∼Zone B) is used to create temporal summaries of the b-value changes. Similarly, the time period between 2005 and 2010 is used to understand the stress redistribution that have caused by the Muzaffarabad earthquake over the region and identify the zones of future seismic potentiality. As an offshoot, we have also studied the zone (∼zone E) around the epicentre of 1905 Kangra earthquake to unearth any significant precursory b-value changes. Map dates adopted ( for respective temporal bins are after Smith Citation(1986).
Figure 7. Maps showing spatial variation in b-value from time domain 1969 to 2010; b-value map of (a) January 1981 (earthquake database January 1969–December 1980), yellow box indicates the epicentral block of Muzaffarabad earthquake, (b) January 1993 (earthquake database January 1981–December 1992), (c) January 2005 (earthquake database January 1993–December 2004), (d) January 2011 (earthquake database January 2005–December 2010), b-value is calculated for 1° × 1° blocks plotted at the centre of each block and contoured. Epicentre for the 8 October 2005 Muzaffarabad earthquake (star) and 1905 Kangra earthquake as filled circle are shown. Note that the epicentre of 2005 locates close to the moderate high b-value zone.
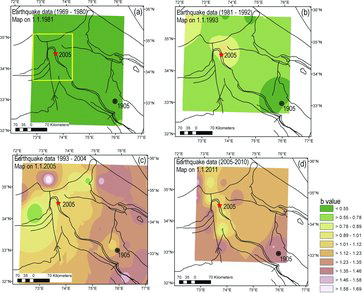
A uniform distribution of low b-value (∼0.5) is observed throughout the region for the map date 01.01.1981 (. In the next map of 01.01.93 () the background b-value increases to 0.78 along with further rise to 0.89 surrounding the epicentral tract of the 2005 earthquake. In the map of 01.01.2004 (), b-value scenario is different; immediate to the southeast of the 2005 epicentre, b-value increases in the range of 0.89–1.01, followed by further sharp rise to the southeast. Towards northwest b-value also sharply rises to as high 1.58. Numerically, relative high b-values result from data population with large number of smaller events (e.g. swarms) or paucity of moderate events; such regions are considered ripe for the generation of large magnitude earthquake as has been documented by Smith Citation(1986) with examples from New Zealand and California. The b-value scenario depicted through different temporal bins ( , 7(b) and 7(c)) should be viewed together that indicate progressive rise of b-value within a fixed region before a large earthquake in the vicinity. In specific cases such large earthquakes locate spatially close to higher b-value contour (see Smith Citation1986) or close to steepest transition in b-values (Urbancic et al. Citation1992). Under normal circumstances, the next map () should have been with a lower background b-value due to the incorporation of large magnitude 2005 earthquake along with its several moderate magnitude aftershocks in the data population; however, the scenario is different with greater part of the region displaying b-value in the range of 1.12–1.23; and a further increase in the range of 1.35 to 1.46 to the southeast corner near the epicentre of the 1905 great earthquake. This is an anomalous phenomenon and needs further probe, as it is likely to strike by another large earthquake.
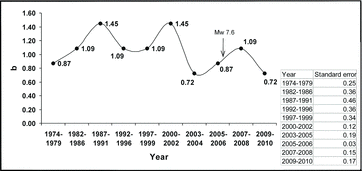
Unlike spatial scenario of changes in b-value, which often becomes significant in the form of high b-value anomaly several years before a possible large shock, in purely temporal variation such precursory signature is rather short lived. Temporal variation in b-value (after Meredith et al. Citation1990) is studied for epicentral tract (yellow box in ) of the 2005 earthquake with data from 1974 onwards (). The b-value was calculated by maximum likelihood method for different temporal bins with standard error on estimation are approximately b/√N, where N is number of earthquake data. It may be noted that the temporal bins are of variable window depending on the minimum availability of data required in the early periods but kept as three years from 1997 and two years bin from 2003 for detailing as one approach the main event of 2005. It is of significance that standard error in ‘b’ estimation is higher prior to 2000 due to relative small number of earthquake data (see ); the b-values became more stable after 2000. The high b-value of 1.45 (2000–2002) has been interpreted as intermediate-term recovery precursor (see Meredith et al. Citation1990) after the relatively lower value of 1.09 for eight years between 1992 and 1999; such high b-values are often correlated with temporal quiescence. During the subsequent period 2003–2004, b-value sharply fell to 0.72 indicating high stress concentrations that are immediately followed by the earthquake of October 2005. Thus in the temporal b-value variation scenario it is high–low couplet that gives the precursor.
Figure 8. Temporal variation in b-value in the epicentral block (marked as box in ) of 8 October 2005 Muzaffarabad earthquake. See the standard error in b-value estimation in different bins as table. Note the high–low b-value couplet preceding the 2005 Muzaffarabad earthquake.
6. Forecast of maximum magnitude with return period
In seismic hazard analysis, the quantification of size of MCE with return period is a prerequisite and can be achieved through Gumbel's extreme value statistics. Extreme value statistics arise as limiting distributions for maximums or minimums of a sample of independent, identically distributed random variables for measuring events of very low occurrence probability. The theory has been used extensively for forecasting of large earthquakes; this has also been studied by different authors (see among others; Shanker & Sharma Citation1998; Sarmah Citation1999; Vyas et al. Citation2005; Shanker et al. Citation2007; Yadav et al. Citation2011 and Citation2012, etc.) with seismicity data to predict future possible Mmax for different parts of Himalaya. Accordingly, following Gumbel Citation(1958) extreme value statistics (see Appendix I) the largest observed magnitude (Mwmax) for successive 10 years interval is separated out from earthquake data (time period 1820–2010). The different Mwmax are arranged in increasing order of magnitude with rank j = 1, 2, 3, …19 and Pj (plotting position of j observation) is calculated for all intervals via equation (7) (Appendix I). In linear graph paper Mwmax is plotted ( against reduced variate R, i.e. −ln(−ln Pj) (see equation (5) of Appendix I). The probability distribution between −ln(−ln Pj) and Mwmax is fitted by an asymptotic curve as per Gumbel type III probability distribution (). Considering return periods T as 10, 50, 100 and 200 years, reduced variate R is calculated (vide equation (8) of Appendix I) for all T. R-values are plotted in and graphically Mwmax for each return period is calculated (). The analysis indicates a probability of occurrence of an event of Mw > 7.0 in the next 50 years within the study area.
Table 3. Expected return period with expected maximum magnitude (Mw) as per Gumbel's extreme value statistics.
Figure 9. Type III Gumbel probability plot between the R, reduce variate [−ln(−ln Pj)] and Mwmax with the model for the period 1820–2010. The expected extreme magnitude for chosen return period is tabulated ().
![Figure 9. Type III Gumbel probability plot between the R, reduce variate [−ln(−ln Pj)] and Mwmax with the model for the period 1820–2010. The expected extreme magnitude for chosen return period is tabulated (table 3).](/cms/asset/2306212d-bc41-4b2e-9934-a46927d658af/tgnh_a_832405_f0009_b.gif)
7. Conclusion
Western Himalaya has been shaken numerous times by large earthquakes in the past 500 years, though earlier earthquakes are known only from fragmentary archival sources. We present here a succinct summary of the past earthquakes from available sources to highlight the seismic potentiality of the region. Our analysis also assigns new locations to the past earthquakes and also helps in removing the conflicting records of occurrences that present in the modern literature. The final outcome is thus a complete catalogue with earthquake magnitude ascertained in moment magnitude scale for the time period 1501–2010.
Contemporary seismotectonics in the region of 2005 Muzaffarabad earthquake have been evaluated. Occurrence of seismicity clusters, CMT solutions of moderate and large earthquakes and underlying geology reveal the seismic heterogeneity within the terrain. Earthquake cluster within the epicentral zone of Muzaffarabad earthquake and their aftershocks in the Western Syntaxis show a close fault–thrust interaction between Muzaffarabad fault, Tanda fault and splays of MBT. Seismicity in Nanga-Parbat cluster is controlled by seismic activities related to the Raikhot fault and Diamir Shear with strike-slip sense of movement present in the western side of the tectonic dome. The thickened Indian Plate controls the seismicity.
Spatio-temporal variations of b-value from the study area show progressive rise of background b-value through time and the main shock 2005 Muzaffarabad earthquake is located close to relative high b-value domains. Regions surrounding the location of the 1905 earthquake also display such high b-value for the period 2005–2010 that calls for forewarn of another large shock.
Temporal variation in b-value is studied for epicentral tract of the 2005 earthquake with data from 1974 onwards. The high b-value of 1.45 (2000–2002) has been interpreted as intermediate-term recovery after the relatively lower value of 1.09 for eight years between 1992 and 1999; such high b-values are often correlated with temporal quiescence. During the subsequent period 2003–2004, b-value sharply fell to 0.72 followed by the earthquake of October 2005 Muzaffarabad earthquake.
Gumbel extreme value statistics also indicate a probability of occurrence of an event of Mw > 7.0 in the next 50 years.
Acknowledgements
Authors acknowledge with gratitude the keen interest shown by Prof. Ramesh P. Singh, Editor in Chief, for publishing this paper. They also acknowledge the learned reviewers for thoughtful and constructive comments on earlier versions of the manuscript, which have considerably improved the scientific content and quality of presentation of the paper.
References
- Ambraseys N, Douglas J. 2004. Magnitude calibration on North Indian earthquakes. Geophys J Int. 159:165–206.
- Ambraseys N, Jackson D. 2003. A note on early earthquakes in northern India and southern tibet. Curr Sci. 84:570–582.
- Aki K. 1965. Maximum likelihood estimate of b in the formula log N = a-bM and its confidence limits. Bull Earthquake Res Inst Tokyo Univ. 43:237–239.
- Avouac JP, Ayoub F, Leprince S, Konca O, Helmberger D. 2006. The 2005, Mw 7.6 Kashmir earthquake: sub-pixel correlation of ASTER images and seismic waveforms analysis. Earth Planet Sci Lett. 249:514–528.
- Baird-Smith R. 1843. Memoirs on Indian earthquakes. J Asiat Soc Bengal. 12(2):1029–1056.
- Bashir A, Bhat MI, Bali BS. 2009. Historical record of earthquakes in the Kashmir Valley. J Himalayan Geol. 30(1):75–84.
- Bender B. 1983. Maximum likelihood estimation of b values for magnitude grouped data. Bull Seism Soc Am. 73(3):831–851.
- Bettinelli P, Avouac JP, Flouzat M, Jouanne F, Bollinger L, Willis P, Chitrakar GR. 2006. Plate motion of India and interseismic strain in the Nepal Himalaya from GPS and DORIS measurements. J Geodesy. 80:567–589
- Bilham R. 2004. Earthquakes in India and the Himalaya: tectonics, geodesy and history. Ann Geophys. 47:839–858.
- Bilham R, Ambraseys N. 2005. Apparent Himalayan slip deficit from the summation of seismic moments for Himalayan earthquakes, 1500–2000. Curr Sci. 881:658–1663.
- Bilham R, Wallace K. 2005. Future Mw > 8 earthquakes in the Himalaya: implication from the 26 Dec 2004 MW = 9.0 earthquake on India's eastern plate margin. Geol Surv India Special Publication. 85:1–14.
- Bilham R, Singh B, Bhat I, Hough S. 2010. Historical earthquakes in Srinagar, Kashmir: clues from the Shiva temple at Pandrethan, In: Sintubin, M, Stewart, IS, Niemi, TM, Altunel, E. editors. Ancient earthquakes. Geological Society of America Special Paper, 471:1–12.
- Chandra U. 1978. Seismicity, earthquake mechanisms and tectonics along the Himalayan mountain range and vicinity. Phys Earth Planet Interiors. 16:109–131.
- Dasgupta S, Pande P, Ganguly D, Iqbal Z, Sanyal K, Venkatraman NV, Dasgupta S, Sural B, Harendranath L, Mazumdar S et al., 2000. Seismotectonic atlas of India and its environs. Geol Surv India Special Publication. 59:1–43
- Dutt JC. 1887. Kings of Kashmir (Rajatarangini including works of Kalhan, Jouraja, Srivara, Prajya Bhatt and Suka). Vol 3. New Delhi: Mittal Publishers.
- Feldl N, Bilham R. 2006. Great Himalayan earthquakes and the tibetan plateau. Nature. 444:165–170.
- Fujiwara S, Tobita M, Sato HP, Ozawa S, Une H, Koarai M, Nakai H, Fujiwara M, Yarai H, Nishimura T, Hayashi F. 2006. Satellite data give snapshot of the 2005 Pakistan earthquake. Eos, Trans Amer Geophys Union. 87:73–84
- Gumbel EJ. 1958. Statistics of Extremes. New York: Columbia Univ. Press; p. 375
- Gutenberg B, Richter CF. 1956. Magnitude and energy of earthquakes. Ann. Geofis. 9:1–15.
- Hanks T, Kanamori H. 1979. A moment magnitude scale. J Geophys Res. 84:2348–2350.
- Hough SE, Bilham R, Ambraseys N, Feldl N. 2005. Revisiting the 1897 Shillong and 1905 Kangra earthquakes in northern India: site response, moho reflections and a triggered earthquake. Current Science. 88(10):1632–1638.
- Iyengar RN, Sharma D, Siddiqui JM. 1999. Earthquake history of India in medieval times. Indian J Hist Sci. 34(3):181–237.
- Jones EJ. 1885a. Notes on the Kashmir earthquake of 30th May 1885. Records Geol Surv India. 18:153–156.
- Jones EJ. 1885b. Report on the Kashmir earthquake of 30th May 1885. Records Geol Surv India. 18:221–227.
- Kamp U, Growley BJ, Khattak GA, Owen LA. 2008. GIS-based landslide susceptibility mapping for the 2005 Kashmir earthquake region. Geomorphology. 101:631–642
- Khan PK, Mohanty S, Mohanty M. 2010. Geodynamic implications for the 8 October 2005 north Pakistan earthquake. Surv Geophys. 31:85–106
- Kondo H, Nakata T, Akhtar SS, Wesnousky SG, Sugito N, Kaneda H, Tsutsumi H, Khan AM, Khattak W, Kausar AB. 2008. Long recurrence interval of faulting beyond the 2005 Kashmir earthquake around the northwestern margin of the Indo-Asian collision zone. Geology. 36:731–734.
- Koons PO, Zeitler PK, Chamberlain CP, Craw D, Meltzer AS. 2002. Mechanical links between erosion and metamorphism in Nanga Parbat, Pakistan Himalaya. Am J Sci. 302:749–773.
- Kulhanek O. 2005. Seminar on b-value. Prague: Dept. of Geophysics, Charles University, December 10–19, 2005.
- Kumar VK, Martha TR, Roy PS. 2006. Mapping damage in the Jammu and Kashmir caused by 8 October 2005 Mw 7.3 earthquake from the cartosat–1 and resourcesat–1 imagery. Int J Remote Sens. 27:4449–4459.
- Lawrence WR. 1895. The Valley of Kashmir. New Delhi: Gulshan Publication; p. 478.
- Mahajan AK, Kumar N, Arora BR. 2006. Quick look isoseismal map of 8 October 2005 Kashmir earthquake. Curr Sci. 91:356–361.
- Meltzer AS, Sarker GL, Beaudoin B, Seeber L, Ambruster J. 2001. Seismic characterization of an active metamorphic massif, Nanga Parbat, Pakistan Himalaya. Geology. 29:651–654.
- Meredith PG, Main IG, Jones C. 1990. Temporal variations in seismicity during quasi-static and dynamic rock failure. Tectonophysics. 175:249–268.
- Merewether W. 1853. A report of the disastrous consequences of the severe earthquake felt on the frontier of upper scinde on the 24th January, 1852. Trans Bombay Geographical Soc. X:284–286.
- Middlemiss CS. 1910. The Kangra earthquake of 4th April 1905. Mem Geol Surv India. 38:1–409.
- Monalisa. 2009. Recent seismic activity in the NW Himalayan fold and thrust belt, Pakistan: focal mechanism solution and its tectonic implications. Geological Society, London, Special Publications. 316:259–267.
- Mukhopadhyay B, Acharyya A and Dasgupta S. 2011a. Potential source zones for Himalayan earthquake: constraints from spatial-temporal clusters. Nat Hazards. 57:369–383.
- Mukhopadhyay B, Acharyya A, Bhattacharyya D, Dasgupta S, Pande P. 2011b. Seismotectonics at the terminal ends of the Himalayan Arc. Geomat Nat Hazards Risk. 2(2):159–181.
- Naqvi SM. 2005. Geology and evolution of the Indian plate: from hadean to holocene. New Delhi: Capital Publishing Company.
- Newall DJF. 1854. Sketch of mahomedan history of Kashmir. J Asiatic Soc Bengal. 23:409–460.
- Oldham T. 1882. A catalogue of Indian earthquakes from the earliest time to the end of A.D. 1869. Memoir Geol Surv India. 19:163–215.
- Owen LA, Kamp U, Khattak GA, Harp EL, Keefer DK, Bauer MA. 2008. Landslides triggered by the 8 October 2005 Kashmir earthquake. Geomorphology. 94:1–9.
- Pande P, Joshi DD, Kandpal GC, Joshi KC, Singh RJ, Singh BK, Singh J, John B, Sanwal R, Ram S et al., 2006. A geoseismological report on 8th october 2005 Kashmir earthquake. Geological Survey of India. p. 1–43.
- Park S, Mackie R. 1997. Crustal structures at Nanga Parbat, Northern Pakistan, from magnetotelluric soundings. Geophys Res Lett. 24:2415–2418.
- Park S, Mackie R. 2000. Resistive (dry?) lower crust in an active orogen, Nanga Parbat, Northern Pakistan. Tectonophysics. 316:359–380.
- Parsons T, Yeats RS, Yagi Y, Hussain A. 2006. Static stress change from the 8 october, 2005 M = 7.6 Kashmir earthquake. Geophysical Res Lett. 33:L06304.
- Pegler G, Das S. 1998. An enhanced image of Pamir-Hindu Kusk seismic zone from relocated earthquake hypocenters. Geophys J Int. 134:573–595.
- Poretti G, Calligaris C, Tariq S, Khan H. 2010. Comaparison between the tectonic movements of Mt. Everest and the Nanga Parbat – Haramosh Massif. J Nepal Geol Soc. 41:45–46.
- Prinsep J. 1836. Table LXXV (page 149) in useful tables forming an appendix to the Journal of Asiatic Society of Bengal. Calcutta: Bishop's College Press; p. 187.
- Quittmeyer RC, Jacob KH. 1979. Historical and Modern Seismicity of Pakistan, Afghanistan, Northwestern India, and Southeastern Iran. Bull Seismological Soc Am. 69(3):773–823.
- Rai DC, Murty CVR. 2006. Effects of the 2005 Muzaffarabad (Kashmir) earthquake on built environment. Curr Sci. 90:1066–1070.
- Sarmah SK. 1999. The probability of occurrence of a high magnitude earthquake in Northeast India. J Geophys. 20(3):129–135.
- Scordilis EM. 2006. Empirical global relations converting MS and mb to moment magnitude. J Seismol. 10:225–236.
- Seeber L, Armbruster JG, Quittmeyer R. 1981. Seismicity and continental subduction in the Himalayan Arc. In: Gupta HK, Delany FM, editors. Zagros, Hindu Kush, Himalaya Geodynamic Evolution. Washington, DC: American Geographical Union; p. 215–242, Geodynamics Series, Vol. 4.
- Seeber L, Pecher A. 1998. Strain partitioning along the Himalayan arc and Nanga Parbat antiform. Geology. 26:791–794.
- Shanker D, Yadav RBS, Singh HN. 2007. On the seismic risk in the Hindukush-Pamir-Himalaya and their vicinity. Curr Sci. 92(11):1625–1630.
- Shanker D, Sharma ML. 1998. Estimation of seismic hazard parameters for the Himalayas and its vicinity from complete data files. Pure Appl Geophys. 152(2):267–279.
- Smith WD. 1986. Evidence for precursory changes in the frequency-magnitude b value. Geophys J Royal Astro Soc. 86:815–838.
- Szeliga W, Martin S, Hough S, Bilham R. 2010. Intensity, magnitude, location and attenuation in India for felt earthquakes since 1762. Bull Seismol Soc Am. 100(2):570–584.
- Tiwari VM, Rajasekhar RP, Mishra DC. 2009. Gravity anomaly, lithospheric structure and seismicity of Western Himalayan syntaxis. J Seismol. 13:363–370.
- Urbancic TI, Trifu CI, Long JM, Young RP. 1992. Space-time correlation of b values with stress release. Pure Appl Geophys, 139, pp. 449–462.
- Ustu T. 1965. A method in determining the value of b in a formula log N = a - bM showing the magnitude frequency for earthquakes. Geophys Bull Hokkaido Univ. 13:99–103.
- Vigne GT. 1844. Travels in Kashmir, Ladak and Iskardo, the Countries adjoining the mountain course of the Indus, and the Himalaya, North of Panjab, with map. Vol. 1, 2nd ed. London: H. Colburn; p. 406.
- Vyas M, Nath SK, Pal I, Sengupta P, Mohanty WK. 2005. GSHAP revisited for the prediction of maximum credible earthquake in the Sikkim region, India. Acta Geophysica Polonica. 53(2):143–152.
- Wiemer S, Wyss M. 2000. Minimum magnitude of completeness in earthquake catalogs: examples from Alaska, the Western United States, and Japan. Bull Seism Soc Am. 90(4):859–869.
- Wynne AB. 1878. Notes on the earthquake in Punjab of march 2nd 1878. J Asiatic Soc Bengal, 47(2):131–140.
- Yadav RBS, Bayrak Y, Tripathi JN, Chopra S and Bayrak E. 2012. Regional variation of the ω-upper bound magnitude of GIII distribution in Hindukush-Pamir Himalaya and the adjacent regions: a perspective on earthquake hazard. Tectonophysics. 544–545:1–12.
- Yadav RBS, Tripathi JN, Shanker D, Rastogi BK, Das MC, Kumar V. 2011. Probabilities for the occurrences of medium to large earthquakes in northeast India and adjoining region. Nat Hazards. 56:145–167.
- Zeitler PK, Chamberlain CP. 2001. Petrogenetic and tectonic significance of young leucogranites from NW Himalaya, Pakistan. Tectonics. 10:729–741.
- Zeitler PK, Koons PO, Bishop MP, Chamberlain CP, Craw D, Edwards M A, Hamidullah S, Jan MQ, Khan MA, Khattak UK et al., 2001. Crustal reworking at Nanga Partbat, Pakistan: metamorphic consequences of thermal–mechanical coupling facilitated by erosion. Tectonics. 20:712–728.
Appendix I
We consider a stochastic process F(m,t) of a random variable ‘m’ (say earthquake magnitude) on a time scale ‘t’. It is not always necessary to have an accurate knowledge of F(m,t); rather important is the largest (or smallest) values of variable ‘m’ that can occur in a given period. Thus if ‘m’ be the magnitude of different earthquake events in a given seismic region, ‘M’ could be the maximum magnitude that can occur within a given time interval. The variable ‘M’, the extreme value, then defines a regular point process embedded in the original process F(m,t).
The original theory of extreme value statistics was developed by Gumbel Citation(1958) primarily for flood forecasting. The probable maximum magnitude ‘M’ in a given seismic region over a time period ‘t’ with exactly zero special events in excess of ‘m’ is expressed as(1) where α is the mean number of earthquakes per year above magnitude zero.
With probability and t = 1 year, expression (1) becomes
(2) Now, we assume a homogeneous earthquake process with a cumulative probability density function represented by the negative exponential distribution for large earthquakes (where β is a constant)
(3) Combining equations (2) and (3), we have
(4) Relation (4) is known as the Gumbels Type I distribution of extremes and can be rewritten as
or
(5) The left-hand term in equation (5) is the reduced variate ‘R’. This R is of special interest in Hazard studies in the Gumbels Type III distribution because it considers an upper limit of extreme ‘m’
(6) where ‘M’ is the upper limit of extremal ‘M’, ‘q’ and ‘u’ are parameters of the corresponding asymptotic distribution estimated by the method least square.
We suppose that M1, M2,…,Mn be the largest observed magnitude in a given region during N successive time interval ‘t’ (in years). The different Mmax are arranged in increasing order of magnitude with rank j = 1, 2, 3,…, N and(7) where N is the number of equal intervals. The probability function can be traced onGambel extreme probability paper by plotting Mj = (j = 1,2,…, n) versus plotting position Pj. For linear graph paper Mj is plotted against reduced variate R, i.e. −ln(−ln Pj) (see equation (5)).
The mean return period of extremal M may be obtained for values equal to or exceeding M asor
(8) where t is reference time interval considered. This relation is used to derive Mmax for a given return period ‘T’.