
Abstract
This study analysed the response in the size of wetlands to a sudden turn from drought to flood along the Yangtze River system in China. The wetlands and their spatial distributions in the provinces of Hubei, Hunan, Jiangxi, Anhui and Jiangsu for three periods (April and May 2010, April and May 2011 and June and July 2011) were identified by the artificial visual interpretation of charge-coupled device images obtained in 2010 and 2011 by the HJ-1A and HJ-1B satellites. The sizes of the wetland areas of all five provinces in the three periods were 30,087.10, 23,427.68 and 31,346.49 km2, respectively, with the largest changes occurring in Jiangxi. Changes in the mean standardized precipitation index (SPI) and its patterns of spatial distribution had similar trends to the changes in the size of the wetlands of each province in the three periods. SPI was positively correlated (R2 = 0.360, p < 0.05) with changes in the proportions of the wetlands during the drought. The mean SPI of the final period after the flood was positively correlated (R2 = 0.406, p < 0.01) with changes in the proportions of wetlands. Poyang Lake and Dongting Lake were impacted most by the flood, and Hongze Lake and Caohu Lake were the least affected.
1. Introduction
Floods caused by concentrated heavy rainfalls can coexist with droughts in particular areas or river basins (Wu Citation2006; Zhang et al. Citation2007). Sudden changes from droughts to floods have frequently occurred recently in southern China. The suddenness of the floods and the heavy rainfalls can lead to severe human and economic losses (Zhang et al. Citation2007; Liu & Huang Citation2012). Heavy rainfalls that occur after a long drought and result in serious damage can be defined as sudden if the amount of precipitation is larger than the average rainfall over the same period (Wei Citation2012; Li Citation2013).
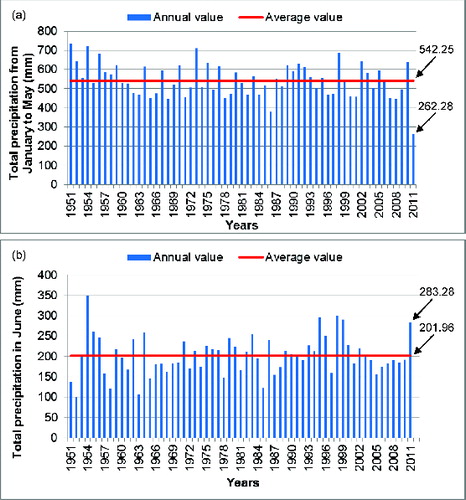
From late spring to early summer in 2011, regions of the middle and lower reaches of the Yangtze River system in China suffered the most serious change from drought to flood since 1951 (Wei Citation2012). The total precipitation from January to May 2011 was only 262 mm (the lowest since 1951), which was 51.6% lower than the average rainfall between 1951 and 2011 over the same period (). The amount of precipitation, however, rapidly increased in June. Heavy rain fell on June 3. Most areas received more than 200 mm, twice the normal June rainfall. This sudden turn from drought to flood caused much economic loss in the provinces of Hubei, Hunan, Jiangxi, Anhui and Jiangsu. The Ministry of Civil Affairs announced that by 27 May 2011, 34.833 million people and 37,051 km2 of agricultural crops had been affected by drought, and 4.24 million people and 1.07 million livestock lacked drinking water. The direct economic loss was 2.31 billion US dollars (Wei Citation2011). By June 19, 3.01 million people in Hubei and 3.12 million people in Jiangxi were affected by flash floods, with a direct economic loss of 89.80 million US dollars (Liu & Huang Citation2012).
Figure 1. Total precipitation from January to May (a) and total precipitation in June (b) during 1951–2011.
Wetlands are the interface of terrestrial and aquatic ecosystems, having features of both and provide many ecosystemic services (Keddy Citation2010). Hydrology is key to wetland persistence and conservation (Sánchez and Álvarez 2010), which has pivotal roles in regional flood control and drought relief (Yu Citation1999). Droughts and floods, however, cause changes in water levels and the decline of wetland areas, which may impair the ecological functioning of wetlands (Ignacio et al. Citation2010), such as flood regulation and water purification (Lv Citation2008), and have serious environmental consequences (Cui et al. Citation2006), such as water pollution, high temperatures and low oxygen levels (Bond et al. Citation2008). Loss of habitat, poor water quality and biotic interactions, especially predation, have major effects on aquatic biota and ecosystemic functioning. The combination of high temperatures and low oxygen levels may eliminate some fish species (Bond et al. Citation2008). Stratified and/or stagnant nutrients may accumulate, increasing the risk of algal blooms (Colley Citation2004), and may be harmful to livestock and domestic animals. Because floods affect the survival and reproduction of plants and animals, especially endangered species (Lu & Deng Citation2005), the loss of species and habitats by sudden floods after a drought hinders the ability to quickly restore healthy and stable wetland ecosystems (Huang & Cheng Citation2012). If sudden changes from drought to flood become normal, the droughts will completely destroy the original wetland ecosystem, with massive declines or even total loss of wetland biodiversity. A wetland can lose its vitality and become stagnant after a flood even if it is able to resume relatively normal hydrological conditions (Huang & Cheng Citation2012).
Changes in wetlands are closely linked to sudden turn from drought to flood. Integrating the research of both can lead to a better understanding of their mutual response mechanisms. Some scholars have carried out related research on wetlands and regional climate change. Burkett and Kusler (Citation2000) studied the potential impacts of climate change to wetlands and their interactions in the United States. Yao et al. (Citation2006) used National Oceanographic and Atmospheric Administration/Advanced Very High Resolution Radiometer (NOAA/AVHRR) data and monthly meteorological data for the Liangzi River in China to analyse the changing relationship between the monthly average lake size and meteorological factors. They found that lake size was positively correlated with rainfall. Sánchez-Carrillo and Álvarez-Cobelas (Citation2010) analysed climatic trends, wetland hydrology and meteorological factors to quantify changes in the components of the water budget and to assess the main causes of hydrological disturbance. Other studies have focused on sudden turn from drought to flood (Wu Citation2006; Zhang et al. Citation2007; Feng et al. Citation2012; Liu & Huang Citation2012). Few studies, however, have directly analysed both drought/flood and wetland changes, especially the relationships of their responses. Our study thus aims to qualitatively and quantitatively analyse the response of wetlands to a sudden turn from drought to flood and to explore the impact factors.
Several drought indices have been used to test the effects of drought on the availability of water resources, most of which are based on normal levels of rainfall (Alley Citation1984) and focused on spatial distributions (Hanson & Weltzin Citation2000), such as the standardized precipitation index (SPI). SPI (McKee et al. Citation1993) is an indicator characterizing the probability of precipitation during a period of time that can reflect the strength and duration of wet and dry periods on different time scales (Edwards Citation1997; Li et al. Citation2012). SPI is often used to study the frequency and temporal–spatial distribution of regional droughts on long time scales (Edwards Citation1997; Kasei et al. Citation2010; Di & Feng Citation2011; Lin et al. Citation2011; Wang et al. Citation2011; Withey & van Kooten Citation2011). Feng et al. (Citation2012) revealed that the sudden turn from drought to flood of the present study had three conspicuous features: previous long-term drought, rapid transition from drought to flood and heavy rainfall after the transition. We thus selected SPI to characterize the severity of droughts and floods and used it to analyse changes in the size of wetlands.
The sudden nature of the 2011 flood prompted higher standards for disaster monitoring and mitigation. Remote sensing can provide information for dynamically monitoring droughts and floods (Zhao & Chen Citation2012). The Chinese Environment and Disaster Monitoring and Forecasting Small Satellite Constellation (Environment Satellite 1, HJ-1), launched 6 September 2008, presently comprises two optical satellites (HJ-1A and HJ-1B) and one radar satellite (HJ-1C). HJ-1 data are available for free download. The main techno-parameters of the charge-coupled device (CCD) camera are presented in . With a broad width and medium–high resolution, the images from HJ-1 could be used to extract information such as the size of the flooded areas and the states of the vegetation and soil moisture. The satellites can thus play a role in emergency observation and the rapid assessment of droughts and floods (Li et al. Citation2008).
Table 1. Main techno-parameters of the wide-coverage multi-spectral CCD camera (Wang et al. Citation2010).
Table 2. Correspondence between SPI and drought/flood category (adapted from McKee et al. Citation1993).
We analysed the sizes and spatial distributions of wetlands in the provinces of Hubei, Hunan, Jiangxi, Anhui and Jiangsu for three periods (Period 1: April and May 2010, Period 2: April and May 2011 and Period 3: June and July 2011) by the artificial visual interpretation of CCD images from the HJ-1A and HJ-1B (HJ-1A/B) satellites. Using also the spatial distributions of SPI in the same periods, we comprehensively analysed the sizes of different wetland types in the various regions in response to the sudden turn from drought to flood. Finally, we discuss the decision-making process for disaster mitigation and wetland conservation.
2. Data and methodology
2.1. Study area
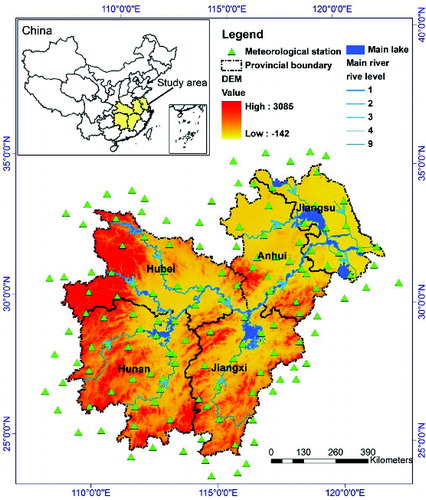
The study area located in the middle and lower reaches of the Yangtze River system in China, 24°29′ N to 35°20′ N and 108°31′ E to 121°57′ E, has a total area of 1.79×10⁴ km2 and includes the provinces of Hubei, Hunan, Jiangxi, Anhui and Jiangsu. According to the statistics of the first national survey of wetland resources, the area of wetland of the five provinces is 54,816 km2, accounting for 14.24% of the total area of wetland in China (NBS, 2006). This region has the largest drainage density in China, with the most concentrated distribution of freshwater lakes, such as Dongting Lake, Taihu Lake and Chaohu Lake. These lakes connect with the Yangtze River and, like natural reservoirs, perform the roles of water regulation and flood-peak reduction. Maps of the locations and water systems of the study area are shown in .
Figure 2. Location of the study area and the distribution of the selected meteorological stations. The main lakes and rivers of the study area are also shown.
Winters in the study area, moderated by the subtropical monsoon climate, are mild and dry, but summers are hot and wet. The annual average temperature is ∼14–18 °C. The average January temperature is ∼0–5.5 °C, and the average July temperature is ∼27–28 °C, but temperatures can reach 38 °C or more. The annual average rainfall exceeds 1000 mm, but annual rainfalls can be as high as 2000–3000 mm. The precipitation comes mainly from the southern and south-western basins. Despite the abundant water resources, droughts and floods have frequently occurred since ancient times (Bai et al. Citation2011). The temporal–spatial distribution of rainfall, influenced by global warming, has been extremely uneven in recent years, leading to a gradual increase in the frequency of sudden turn from drought to flood, mainly in the Huaihe River basin and the Yangtze River region (Liu & Huang Citation2012). China has suffered from severe droughts nearly every year since 2000, particularly in the middle and lower reaches of the Yangtze River system (http://news.163.com/special/yangtzeriverdrought/).
2.2. Data sources and processing
This study focused on the response relationships between changes in the size of wetlands and SPI in different periods. Even though the total precipitation from January to May in 2010 was higher than the average (), the effect of precipitation differences on the comparisons can be negligible. Moreover, the study area is large, and the basic unit for quantitative analyses is the small watershed. Our comparisons were based on many small watersheds, so one non-drought year was sufficient for comparison. The natural state of the wetlands in the years preceding 2011 was similar to that of 2011, so we selected April and May 2010 as Period 1.
We used HJ-1A/B, meteorological and digital elevation model (DEM) data in this study. A total of 60 scenes from HJ-1A/B CCD images with 30-m spatial resolution (China Centre for Resources Satellite Data and Application, http://www.cresda.com/n16/n1115/ n1432/index.html) were used to extract information on the wetlands, including 22, 18 and 20 scenes from Periods 1, 2 and 3, respectively. Automatic classification algorithms are problematic for ensuring mapping accuracy due to the dense river network and numerous lakes, so we determined the sizes of the wetlands with ArcMap 9.3 by artificial visual interpretation, following the standards of Cao et al. (Citation2012) and Tian et al. (Citation2011). The band combination of 4, 2 and 1 was considered as the Red, Green and Blue channels, respectively. For controlling the mapping accuracy within 1:100,000, historical data and a variety of auxiliary data, such as DEM and Google Earth layers, were used for validating the results. With the limitation of our spatial-resolution data, rivers narrower than 3 pixels (90 m) and lakes smaller than 10 × 10 pixels (0.09 km2) were not considered (Cao et al. Citation2012). More than one person performed the interpretation, so we randomly selected 150 checkpoints per period to verify the accuracies of the interpretations. The accuracies of Periods 1, 2 and 3 were 91%, 95% and 96%, respectively, more than 90% of which met the requirements of this study. Furthermore, our results can provide a reference for related research in this region.
Data-sets of the monthly ground meteorological precipitation from 137 meteorological stations distributed over the five provinces and their surrounding areas () from 1980 to 2011 were downloaded from the China Meteorological Data Sharing Service Network (http://cdc.cma.gov.cn/). After consistency checking and the shortage data interpolation, these data were used to calculate the SPIs for analysing the severity and spatial distributions of droughts and floods.
To correspond to the changes in the sizes of the wetlands, the monthly SPIs for the same three periods were calculated following McKee et al. (Citation1993). Different time scales of SPI can reflect different time scales of droughts, so the selection of time scale of SPI is important. Wang et al. (Citation2011), Di and Feng (Citation2011) and Lin et al. (Citation2011) suggested that time scales of 6–12 months were better for spring droughts and dry winter seasons, while time scales of 1–3 months were better for short-term droughts. We, therefore, selected time scales of one, three and six months for calculating the SPIs of the three periods. McKee et al. (Citation1993) defined drought intensities for values of SPI with four categories. We defined nine intensities and categories (. To ensure a comprehensive analysis of the trends of temporal–spatial changes in the size of wetlands in response to the sudden turn from drought to flood, we interpolated the monthly SPIs of the three periods to obtain spatial distribution maps with 1-km resolution using ArcGIS 9.3. The inverse distance weighting (IDW) method estimates a point using the nearest sample points (Kurtzman & Kadmon Citation1999), which follows Tobler's first law of geography: ‘everything is related to everything else, but near things are more related than distant things’ (Miller Citation2004). The benefits of this method are the accuracy of the observation points and the limited number of interpolation points. The meteorological stations from which we obtained our data were relatively numerous and uniformly distributed, so we chose the IDW method to reflect local changes through limiting the number of interpolation points. A 10-fold cross validation (Efron Citation1983) was performed for the SPI of each month to estimate the interpolation errors. The root-mean-square errors (RMSEs) for April 2010, May 2010, April 2011, May 2011, June 2011 and July 2011 were 0.22, 0.30, 0.14, 0.31, 0.34 and 0.34, respectively, with an average RMSE of 0.28. The SPI grading interval was 0.5 (1 for drought level 5, ), so the interpolated results can be used for the analyses.
Table 3. Sizes of the wetlands in the five provinces and three periods (Period 1: April and May 2010; Period 2: April and May 2011; Period 3: June and July 2011).
Small watersheds are independent geomorphic units with relatively intact natural ecological processes. Geomorphological differentiation is obvious, and the regional climate affects their hydrological characteristics (Tian et al. Citation2012). The small watershed was thus chosen as the basic unit for the quantitative analyses of the changes in the size of wetlands in response to a sudden flood. Following Tian et al. (Citation2012), 39 small watersheds were analysed with ArcGIS 9.3 Workstation using the 90-m resolution of the The Shuttle Radar Topography Mission (SRTM) DEM data downloaded from the International Science Data Services Platform (http://datamirror.csdb.cn/dem/search.jsp). Watersheds with an insufficient number of meteorological stations were excluded from the statistical analyses. The sphere of action of each meteorological station ranged within ∼20–25 km in plain regions. Implementation of a buffer zone, 20 km in width, identified 22 small watersheds with three or more meteorological stations. These watersheds were selected for calculating the average size of wetlands for each period and the mean SPI for each month. The flow chart of this study is presented in .
Figure 3. Flow chart of this study.
3. Results
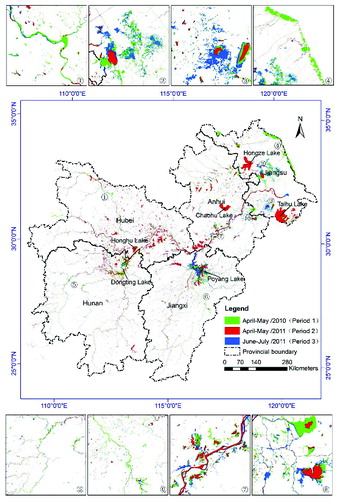
The spring drought and heavy summer rain in 2011 caused large changes to the sizes ( and patterns of spatial distribution () of the wetlands in the five provinces compared with those of the same period in 2010. The total size of all wetlands in all the provinces in Period 2, impacted by the spring drought in 2011, was 23,427.68 km2, which had decreased by 6659.42 km2 from Period 1 (30,087.10 km2), a reduction of 22.13% (). The wetlands of Jiangsu and Jiangxi were the most affected by the drought. Jiangsu had the largest reduction in absolute size from Periods 1 to 2 (2279.73 km2, 28%), and Jiangxi had the largest reduction in relative size (31.79%, 1548.57 km2). Hubei was the least affected by the drought and had the smallest changes (116.90 km2, 1.85%).
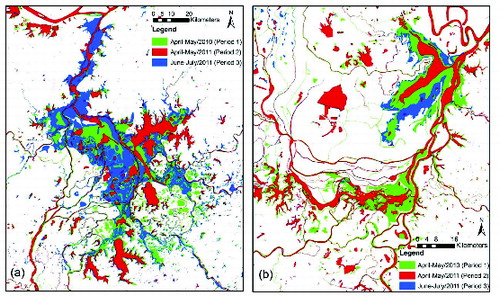
Figure 4. The spatial distributions of the wetlands in the five provinces and three periods.
The total size of all wetlands in all provinces, in Period 3 after the flood, rose sharply to 31,346.49 km2, 7918.81 km2 larger than in Period 2, an increase of 33.8%. The largest increase in size was 3421.01 km2 in Jiangxi, an increase of 102.96%. The second largest increase was 2442.84 km2 in Jiangsu, an increase of 41.66%. The size of the wetlands in Hubei, however, actually decreased after the flood by 4.39%, relative to Period 2.
shows that the largest changes in the spatial distribution of the wetlands during the three periods occurred mainly in Hunan, Jiangxi and Jiangsu. The smallest changes occurred in Hubei and Anhui, the provinces through which the Yangtze River flows, with obvious changes only in south-eastern Hubei and south-western Anhui. The detailed maps in show the severely affected areas.
The Yangtze River system contains six of the seven largest freshwater lakes in China: Poyang, Dongting, Honghu, Hongze, Taihu and Chaohu. Poyang Lake and Dongting Lake () and their surrounding wetlands suffered the largest increases in size from the sudden turn from drought to flood, followed by Honghu Lake and Taihu Lake, which were impacted more by the drought. The impact of the flood on Hongze Lake and Chaohu Lake was minimal.
4. Discussion and analysis
4.1. Size of wetlands in response to the sudden turn from drought to flood
shows the mean SPIs of each province with different time scales in the three periods. 2010 was a relatively normal year with no drought or flood, so a long SPI time scale better reflected the moisture conditions. Comparing (a), 5(b) and 5(c), we can see that the drought had progressed significantly before the flood, and the drought in (b) was severer than that in (a) and 5(c). shows that the proportional changes (%) in the size of wetlands in Jiangxi and Hunan were much larger than in the other provinces, in agreement with (b). The three-month SPI time scale was thus the most suitable to reflect the drought. The sudden flood caused by the heavy rainfalls in June and July 2011 (Period 3) was best analysed with a one-month SPI time scale. This analysis supports the results of Wang et al. (Citation2011), Di and Feng (Citation2011) and Lin et al. (Citation2011); so (d) was selected for the following analyses.
Figure 5. Mean SPIs of each province in the three periods: (a) SPI time scale of one month, (b) SPI time scale of three months, (c) SPI time scale of six months and (d) SPI time scale of six months for Period 1, three months for Period 2 and one month for Period 3.
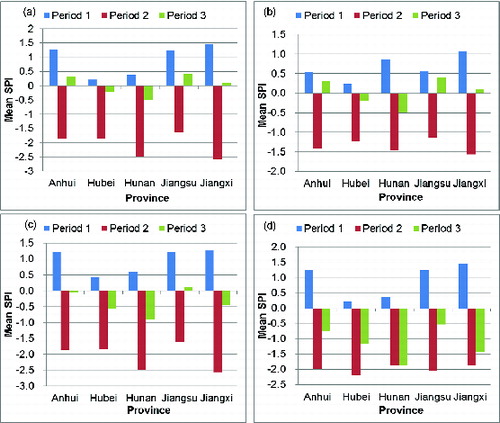
As can be seen in (d), the change from drought to flood in each province and period is very obvious. The five provinces in Period 1 were generally under minor flood or normal conditions, without drought or waterlogging. All the five provinces, though, had entered drought conditions by Period 2, with Hunan and Jiangxi in extreme drought and the other three provinces in severe drought. By Period 3, the drought was eased in all the five provinces by the sudden heavy rain in June 2011. The trend of changes in SPI in the three periods, which first decreased and then increased, was essentially similar to the trend of changes in the size of the wetlands.
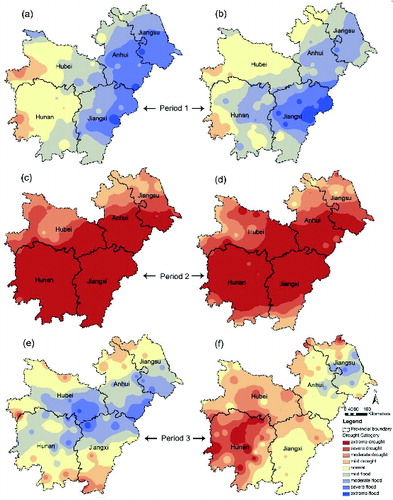
The interpolated SPI spatial distribution maps ( showed that small areas of western Hubei and Hunan had mild droughts in Period 1, and the other provinces had mild floods. By Period 2, more than 90% of the areas of the five provinces had extreme or severe droughts. The drought had eased by Period 3 in most areas of the five provinces due to the sudden turn from drought to flood. Integrating the SPI distributions of each province in the six months of the three periods indicated that the SPI distributions changed mainly in Hunan, Jiangxi, central and eastern Hubei and central and southern Anhui and Jiangsu, which were mostly consistent with the changes in the spatial distribution of the sizes of the wetlands.
Figure 6. Variation in the SPI spatial distribution in the five provinces and six months: (a) April 2010, (b) May 2010, (c) April 2011, (d) May 2011, (e) June 2011 and (f) July 2011.
The meteorological stations selected to calculate SPI were evenly distributed in the five provinces and the surrounding areas (), so the SPI values and their spatial distributions were able to reflect the changes caused by the droughts and floods throughout the study area. The analyses showed that the trends of mean SPIs were similar to the changes in the sizes of wetlands, indicating a good correlation between SPI and size change. This also further illustrates that the severity of droughts and floods is the most important impact factor in the variation of wetland spatial patterns.
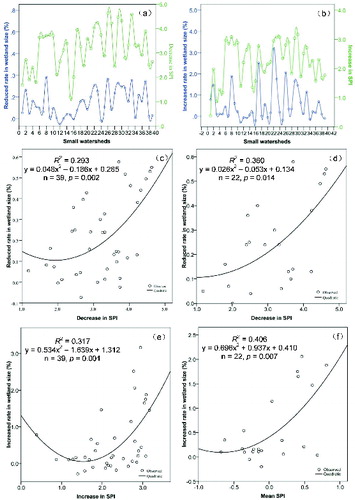
The decrease in the area of wetland from Period 1 to Period 2 () was positively correlated with the decrease in SPI ((c), R2 = 0.293, p < 0.01; (d), R2 = 0.360, p < 0.05). Similarly, the increase in the area of wetland from Period 2 to Period 3 was positively correlated with the increase in SPI ((e), R2 = 0.317, p < 0.01). In addition, the increase in the area of wetland was positively correlated with mean SPI in Period 3 ((f), R2 = 0.406, p < 0.01). Changes in the size of wetland were thus significantly correlated with changes in SPI on the scale of small watersheds. The relationship, however, differed among periods. Between Periods 1 and 2, the best correlation was between change in wetland size and change in SPI, whereas the best correlation for Periods 2 to 3 was between change in wetland size and SPI, rather than the change in SPI. This difference was due to the causes of the drought and the sudden flood. Droughts are the result of medium- and long-term changes in meteorological parameters such as precipitation, evaporation, temperature and wind. SPI, though, only depends on rainfall, so the SPI values did not correlate well with change in wetland size between Periods 1 and 2 during the drought (data not shown; R2 = 0.160, p > 0.05). The good correlation between changes in wetland area and changes in SPI during the drought indicates that rainfall is always the main factor in both droughts and floods on long time scales. Floods are caused by rapid increases in precipitation, so precipitation is the main cause of changes in wetland size and is far more important than temperature, wind and other factors. Changes in wetland size caused by flooding were thus better correlated with SPI values.
Figure 7. The relationship between SPI and changes in the size of the wetlands: (a) variation curve between decrease in wetland size and decrease in SPI (Period 2 relative to Period 1), (b) variation curve between increase in wetland size and increase in SPI (Period 3 relative to Period 2), (c) correlation between reduction in wetland size and decrease in SPI (Period 2 relative to Period 1) in 39 small watersheds, (d) correlation between reduction in wetland size and decrease in SPI (Period 2 relative to Period 1) in 22 small watersheds, (e) correlation between increase in wetland size and increase in SPI (Period 3 relative to Period 2) and (f) correlation between increase in wetland size (Period 3 relative to Period 2) and mean SPI in Period 3 in 22 small watersheds.
4.2. Influence of regional conditions and type on the response of wetlands to the sudden turn from drought to flood
The analyses in Section 4.1 suggested that the changing patterns in the areas with water and the key wetland regions in each province were not entirely consistent with the changes in the spatial distribution of SPI and that the correlation between the changes in wetland size and SPI values or variation was not high. The changes in the size of wetlands are impacted by climate, the regional ecological environment, the causes of wetland formation and wetland type. The six major lakes in our study area can serve as examples for analysing the effects of these factors on the response of wetlands to sudden floods. The sizes of the six lakes in the three periods are shown in .
Figure 8. Sizes of the six lakes in the three periods.
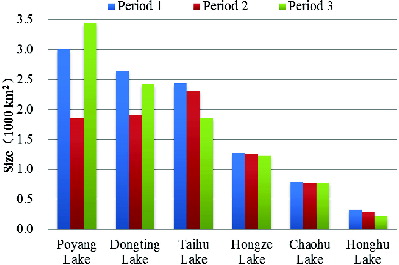
shows the changes in the sizes of Poyang Lake and Dongting Lake, which are the two largest freshwater lakes in China. and indicate that Poyang Lake and Dongting Lake were obviously impacted by the sudden turn from drought to flood. The sizes of these two lakes and their surrounding wetlands decreased sharply during the drought and then increased rapidly after the flood. Poyang Lake and Dongting Lake, both of which are swallow–spit and seasonal lakes, are similar and connect to the Yangtze River. They both experience substantial seasonal and inter-annual variations of water levels, especially during the flood season (Hu et al. Citation2010; Gan et al. Citation2011) and are thus affected by the run-off to the Yangtze River. Poyang Lake receives the run-off from five rivers in Jiangxi (Gan et al. Citation2011). Sustained drought and high temperatures reduce the run-off to the Yangtze River. The levels of the five rivers feeding the lake have rapidly dropped in recent years, which has hindered the ability of the Poyang Lake region to prevent and mitigate droughts (Gan et al. Citation2011). The amount of water flowing into Doingting Lake is highly dependent on the flood season, so the lake's level varies greatly throughout the year. The seasonal storage of the Three Gorges Reservoir may also lead to seasonal shortages of water in Dongting Lake and can repeatedly aggravate droughts (Li et al. Citation2009).
Figure 9. Changes in size of Poyang Lake (a) and Dongting Lake (b) in the three periods.
The sizes of Taihu Lake and Honghu Lake continued to decline during the three periods (). Both lakes are shallow with large, low-lying catchments that have uneven temporal–spatial distributions of rainfall. The terrain around Taihu Lake is similar to a dish, high on the periphery and low in the centre. This terrain leads to large differences in the temporal and spatial distributions of rainfall (Zhou Citation2006). Honghu Lake is the largest shallow lake on the Jianghan Plain and is generally unable to satisfy the demand for water. Moreover, other regions take a large proportion of the water that supply the lake, which contributes to the uneven temporal–spatial distribution of the natural precipitation and the instability of the external water supply that often result in droughts and floods (Xiao Citation2003; Chen Citation2004). The fluctuations in the levels of these two lakes thus depend mainly on regional precipitation and run-off from upstream areas. Continuous heat and drought caused mainly by inadequate rainfall rapidly evaporates the lake water, leading to rapid drops in water level and thus lake size. Many wetland ecosystemic functions such as water conservation and climate regulation are affected that indirectly influence climatic factors, such as local temperature, rainfall and evaporation, which in turn can aggravate droughts. Shallow lake wetlands have suffered very serious damage after a long drought, and the levels of these two lakes have not been able to rapidly increase even after an increase in rainfall. Sustained droughts have had a very large impact on this type of shallow lake.
The sizes of Hongze Lake and Chaohu Lake changed little, indicating that these two lakes were only slightly impacted by the sudden turn from drought to flood. Hongze Lake is a large shallow lake (Ye et al. Citation2005) whose changes in size are affected mostly by precipitation and temperature. The region around Hongze Lake had a lot of water in Period 1 () and was affected by drought less than the surrounding areas in Period 2. The abundant rainfall in Period 3 eased the drought very quickly, so Hongze Lake was not severely affected by the sudden turn from drought to flood. The terrain of the basin region around Chaohu Lake drops in elevation from north to south, gradually sloping to the lake. The regions to the west and south are mountainous, while the northern and eastern regions have hills and low mountains (Shi Citation2011). This terrain facilitates the ability of Chaohu Lake to collect water and enhances the effectiveness of regional water conservation and drought relief. SPI in the region surrounding Hongze Lake was higher than in nearby areas during Periods 1 and 2, indicating higher humidity. Moreover, SPI in this region was high only during a mild flood in Period 3, while SPI increased rapidly in most other regions during the flood. As with Hongze Lake, Chaohu Lake was not severely affected by the flood.
In summary, the factors that impacted the changes in wetland size were complex and diverse, but precipitation was the main factor causing droughts and floods. Changes in wetland sizes in response to the change from drought to flood were also affected by the causes of wetland formation, wetland types, regional ecological environments and many other factors.
4.3. Providing a scientific basis for disaster monitoring and relief and wetland conservation
The integrated analyses of the response and its impact factors suggested a basis of and recommendations for decision-making on disaster monitoring and relief and wetland conservation. The revisit cycle of the HJ-1A/B satellites is two days, so using HJ-1 data for the real-time and dynamic monitoring of droughts, floods and wetlands can provide a good means of monitoring and forecasting.
and the analyses in Section 4.2 showed that the regions of Poyang Lake and Dongting Lake were impacted most by the sudden turn from drought to flood and thus should be the key regions of disaster relief from both drought and flood. The regions of Honghu Lake and Taihu Lake, whose sizes continued to decline during the three periods, should be the foci of drought disaster relief. The eight areas highlighted in are also key areas for disaster mitigation. The water in regions 1, 4, 5 and 6 almost completely disappeared during the drought and did not increase rapidly after the flood, indicating poor relief from the drought. These regions should thus be the foci of drought prevention and rescue and should construct facilities to store and conserve water to be able to effectively alleviate drought. Most of the water in regions 2, 3, 7 and 8 disappeared in the drought and then rapidly increased after the flood, even more than in Period 1, so these regions appear to be both easily flooded and able to alleviate drought. These regions are generally vulnerable to the impacts of both droughts and sudden turn from drought to flood and thus need to pay particular attention to flood warnings and preventative measures during drought.
Droughts and floods first affect the sizes of wetlands and then the functions of wetland ecosystems, such as water conservation, protection of biodiversity and material production. Decreases in the functions in turn intensify droughts and floods (Cao et al. Citation2012). The wetlands seriously impacted by droughts and floods are also those most in need of conservation. Regional environmental problems and the main factors for the condition, maintenance and functioning of wetland ecosystems can thus be analysed by the methods described in this study. We can make recommendations for the protection of wetlands accordingly.
5. Conclusions
The lack of relevant quantitative research as a basis for making decisions is a challenge for disaster monitoring, disaster relief and wetland conservation in the middle and lower reaches of the Yangtze River system, a region with frequent sudden turn from drought to flood. Our study is an attempt to solve this problem by integrated analyses of the changes in the sizes of wetlands and in SPI.
Sudden changes from drought to flood are more harmful to humans and wetland ecosystems than are individual droughts or floods. The qualitative and quantitative analyses in this study were effective in analysing these changes. Our findings demonstrated that some of the changes in wetland size in response to the sudden turn from drought to flood were significant. The mean SPIs were consistent with the trends of variation on a provincial scale, and the variation in the spatial distribution of SPI was similar to that of wetland size. Quantitative analyses on a scale of small watersheds indicated that the variation in wetland size was significantly correlated with changes in SPI. Correlations, however, differed among the periods of the sudden turn from drought to flood. The responses were affected by precipitation, wetland regional conditions, wetland type and many other factors.
The dense network of rivers and lakes of various sizes in the middle and lower reaches of the Yangtze River system was vulnerable to damage from the sudden change, which led to large changes in the area of wetlands and to destruction of wetland ecosystems. This region should be a key focus of disaster relief and wetland conservation. Decision-making for disaster relief and wetland conservation should consider the regional conditions of the wetlands, the causes of wetland formation and the factors controlling water sources. Swallow–spit and seasonal lakes like Poyang Lake and Dongting Lake are connected to the Yangtze River, whose levels are greatly influenced by the inflow of water. The prevention of and relief from droughts and floods require simultaneous attention. Areas with large, low-lying catchments and uneven temporal–spatial distributions of rainfall, such as Honghu Lake and Taihu Lake, should be the foci of drought prevention and rescue. The wetland ecosystems of these types of lakes are vulnerable to damage and not easily restored, so their conversation is necessary.
This study demonstrated that the extraction of information on wetland sizes, pattern variation and spatial distribution from HJ-1A/1B data in a region of dense networks of rivers and lakes can provide a new tool for disaster monitoring and mitigation and wetland conservation. For further study, the development of automated methods for extracting information to improve accuracy in regions with dense water bodies can decrease the effort needed to extract information in larger areas.
Acknowledgements
We thank H.C. Jia, M. Xu, X.L. Ni, J. Zhao, W. Chen, S. Zheng, C. Liu, Y.M. Yu, P.S. Yan, S. Li and L.L. Gao for their participation in interpreting the sizes of the wetlands. The authors also would like to thank their several colleagues for reviewing the manuscript and providing valuable suggestions.
Additional information
Funding
Related Research Data
References
- Alley WM. 1984. The Palmer drought severity index: limitations and assumptions. J Clim Appl Meteorol. 23:1100–1109.
- Bai JF, Zhao HL, Jiang YZ, Zhang F. 2011. The applicability of GPCP dataset to the middle–lower Reaches of the Yangtze River. South-to-North Water Diversion Water Sci Technol. 9:33–38.
- Bond NR, Lake PS, Arthington AH. 2008. The impacts of drought on freshwater ecosystems: an Australian perspective. Hydrobiologia. 600:3–16.
- Burkett V, Kusler J. 2000. Climate change: potential impacts and interactions in wetlands of the United States. J Am Water Resour Assoc. 2:313–320.
- Cao CX, Zhao J, Gong P, Ma GR, Bao DM, Tian K, Tian R, Niu ZG, Zhang H, Xu M, et al. 2012. Wetland changes and droughts in southwestern China. Geomatics Nat Hazards Risk. 1:79–95.
- Chen P. 2004. A study on environmental evolution of Honghu Lake in the past 1300 years [dissertation]. Wuhan: Institute of Geodesy and Geophysics, Chinese Academy of Sciences.
- Colley J. 2004. Drought Preparedness Council Biennium Report 2003–2004. Austin (TX): Governor's Division of Emergency Management.
- Cui LJ, Zhang MY, Wang YF. 2006. The progress of wetland function research. World For Res. 19:18–23.
- Di LX, Feng Q. 2011. Dryness/wetness climate variation based on standardized precipitation index in northwest China. J Nat Resour. 26:847–857.
- Edwards DC. 1997. Characteristics of 20th century drought in the United States at multiple time scales [dissertation]. Fort Collins (CO): Colorado State University.
- Efron B. 1983. Estimating the error rate of a prediction rule: improvement on cross-validation. J Am Stat Assoc. 78:316–331.
- Feng GL, Yang HW, Zhang SX, Wang K, Sheng BZ. 2012. A preliminary research on the reason of a sharp turn from drought to flood in the middle and lower reaches of the Yangtze River in late spring and early summer of 2011. Chin J Atmos Sci. 36:1009–1026.
- Gan XY, Liu CL, Huang XM. 2011. Study on the drought in Poyang Lake. J Anhui Agric Sci. 39:14676–14678.
- Hanson PJ, Weltzin JF. 2000, Drought disturbance from climate change: response of United States forests. Sci Total Environ. 262:205–220.
- Hu ML, Wu ZQ, Liu YL. 2010. Characteristics of water level and its effects on water environmental factors in Hukou area of Poyang Lake. J Hydroecol. 3:1–5.
- Huang XY, Cheng JK. 2012. Extreme climate change and wetlands of the middle-lower reaches the Yangtze River from “the sudden turn from drought to flood” in 2011. Science. 6:35–37.
- Ignacio MP, Jose NP, Ignacio G, Magaly K. 2010. Detecting drought induced environmental changes in a Mediterranean wetland by remote sensing. Appl Geogr. 30:254–262.
- Kasei R, Diekkrüger B, Leemhuis C. 2010. Drought frequency in the Volta basin of West Africa. Sustain Sci. 5:89–97.
- Keddy PA. 2010. Wetland ecology: principles and conservation. New York (NY): Cambridge University Press.
- Kurtzman D, Kadmon R. 1999. Mapping of temperature variables in Israel: a comparison of different interpolation methods. Clim Res. 13:33–43.
- Li CR, Tang LL, Hu J, Li ZY, Jia YY. 2008, Potential applications of HJ-1 optical satellites. Rev Sci Technol. 26:1356–1359.
- Li JB, Chang J, Lv DQ, Zhu X, Lu CZ, Zhou YY, Deng CX. 2009. The hydrological effect between Jingjiang River and Dongting Lake during initial period of Three Gorges Project operation. Acta Geogr Sin. 64:1342–1352.
- Li M. 2013. The causes of abruptly drought-flooding turn in the Mid-Lower Reaches of Yangtze River during Spring to Summer in 2011 [dissertation]. Beijing: Chinese Academy of Meteorological Sciences.
- Li WG, Yi X, Hou MT, Chen HL, Chen ZL. 2012. Standardized precipitation evapotranspiration index shows drought trends in China. Chin J Eco-Agric. 5:643–649.
- Lin SJ, Zhang QQ, Yu CF, Xu YP. 2011. Application of drought indices in historical droughts and flood analysis in Hangzhou. China Rural Water Hydropower. 1:69–73.
- Liu FL, Huang GB. 2012. Research progress in formation mechanism of urban drought-flood abrupt alternation and urban waterlog prevention system. J Yangtze River Sci Res Inst. 29:69–73.
- Lu XN, Deng W. 2005. Review of flood effect on wetland system. Wetland Sci. 3:136–145.
- Lv XG, editor. 2008. Wetland ecosystem study in China. Shijiazhuang: Hebei Science and Technology Press.
- McKee TB, Doesken NJ, Kleist J. 1993. The relationship of drought frequency and duration to time scales. Proceedings of the 8th Conference on Applied Climatology; 17–22 January; Anaheim, CA. Boston (MA): American Meteorological Society; p. 179–183.
- Miller HJ. 2004. Tobler's first law and spatial analysis. Ann Assoc Am Geogr. 94:284–289.
- [NBS] National Bureau of Statistics. 2006. China Statistical Yearbook 2006. Beijing: China Statistics Press.
- Sánchez-Carrillo S, Álvarez-Cobelas M. 2010. Chapter 3. In: Sánchez-Carrillo S, Angeler DG, editors. Ecology of threatened semi-arid wetlands: long-term research in Las Tablas de Daimiel. New York (NY): Springer Science+Business Media; p. 45–83.
- Shi WJ. 2011. The flood and drought disasters of the Chaohu Lake basin in the past 600 years [dissertation]. Shanghai: Shanghai Normal University.
- Tian R, Cao CX, Jia HC, Xu M, Xiang HB, Lei GC, Tian K, Weng JN, Cao HH. 2012. Health assessment of the water-level-fluctuation zone (WLFZ) in the Three Gorges area based on spatial information technology. 2012 IEEE International Geoscience and Remote Sensing Symposium (IGARSS); 22–27 July; Munich. p. 7236–7239.
- Tian R, Cao CX, Ma GR, Bao DM, Xu M, Zhou JQ. 2011. Changes and driving factors of plateau wetlands in Maduo County. Wetland Sci. 1:61–68.
- Wang J, Liu YL, Tai WH, Guo J. 2011. Application of drought index SPI in drought monitoring and evaluation in Tongliao. Mod Agric Sci Technol. 15:62–63.
- Wang Q, Wu C, Li Q. 2010. Environment Satellite 1 and its application in environmental monitoring. J Remote Sens. 14:104–121.
- Wei ML. 2011. 3483.3 million people affected by drought of the five provinces in the middle and lower reaches of the Yangtze River. South China Morning Post. [cited 2012 Apr 19]. Available from: http://ngzb.gxnews.com.cn/html/2011-05/29/content_547220.htm
- Wei X. 2012. A preliminary research on the reason of a sharp turn from drought to flood in the middle and lower reaches of the Yangtze River in 2011. The 14th Annual Meeting of China Association for Science and Technology: Extreme Weather Events and Public Weather Services Development Forum Proceedings; 8–10 September; Shijiazhuang. p. 1–5.
- Withey P, van Kooten GC. 2011. The effect of climate change on optimal wetlands and waterfowl management in Western Canada. Ecol Econ. 70:798–805.
- Wu ZW. 2006. Understanding the occurrence of droughts and floods during the summer monsoon rainy season in the middle and lower reaches of the Yangtze River valley [dissertation]. Nanjing: Nanjing University of Information Science & Technology.
- Xiao F. 2003. Evaluation of ecological functions, structure and system stability of Honghu wetland [dissertation]. Wuhan: Institute of Geodesy and Geophysics, Chinese Academy of Sciences.
- Yao WL, Liu WB, Huang ZY. 2006. Application of remote sensing data to monitor water area change and its relationship with precipitation. Hubei Meteorol. 1:20–23.
- Ye ZW, Zhu GC, Jiang B. 2005. Analysis on features of Lake Hongze flood hazards for the recent 100 years. Water Resour Hydropower Eng. 36:62–65.
- Yu GY. 1999. Introspection of the flood disaster: on the flood control and wetland management. Chin J Ecol. 1:34–38.
- Zhang XW, Xu WG, Shi HJ, Han CS. 2007, Understanding and studies of law of sudden turn of drought and flood in Anhui Province. China Water Resour. 5:19.
- Zhao Y, Chen XF. 2012. Review on remote sensing monitoring of flood disaster. Sichuan Environ. 31:106–109.
- Zhou XL. 2006. Research on the drought features of Taihu basin using the nonparameter statistical method [dissertation]. Nanjing: HoHai University.