
Abstract
We compare the precursory behaviour of crustal movements with electromagnetic signatures for the 2011 off the Pacific Coast of Tohoku earthquake. First, we present the Global Positioning System (GPS) data on the co-seismic variations and pre-seismic precursors (medium-term, short-term and imminent precursors). Then, we will review recently published results on electromagnetic precursors, including mainly short-term subionospheric very low frequency (VLF)/LF propagation anomaly, ultralow frequency (ULF) magnetic field depression and ULF/extremely low frequency (ELF) atmospheric radiation. Finally, we examine the relationship between the crustal movements and electromagnetic phenomena. We conclude that at least short-term electromagnetic precursors are closely correlated in time with the corresponding crustal movements. This seems to provide evidence on the link between lithospheric and electromagnetic processes. Some discussions will be given on the possible mechanism of this link.
1. Introduction
On 11 March 2011, a huge earthquake (EQ hereafter) struck the north-eastern part of the Honshu island of Japan. The EQ was officially named “the 2011 off the Pacific Coast of Tohoku EQ” by the Japan Meteorological Agency (JMA Citation2011), but we simply call it “the 2011 Tohoku EQ” or just “the Tohoku EQ” in the following. The moment magnitude of the quake was recorded to be 9.0: the largest magnitude ever recorded in Japan. The source fault ruptured in an extremely extensive area of some 500 km long and 200 km wide with a large slip of some 50 m (Hirose et al. Citation2011), triggering strong ground motion, crustal movement and tsunami in the Tohoku district of Japan. It is supposed that there may be an extremely large area of pre-EQ fracture, in which various electromagnetic phenomena were generated.
The fatal victims of death and missing reached nearly 20,000 and various kinds of structures were badly damaged in a vast area of east Japan. Such large casualty of this EQ accentuated urgent necessity of short-term EQ prediction. Here, short-term means the time scale of a few days to a few weeks. Once short-term EQ prediction is realized, we could save a lot of human lives. Of course, it goes without saying that short-term EQ prediction absolutely needs precursors. There have been reports of many kinds of EQ precursors since old days until today (e.g. Rikitake Citation2001; Hayakawa & Molchanov Citation2002; Pulinets & Boyarchuk Citation2004; Molchanov & Hayakawa Citation2008; Hayakawa Citation2009, Citation2013; Uyeda et al. Citation2009; Hayakawa and Hobara Citation2010). They can be geodetic signals like tilt, GPS (Global Positioning System) data, hydrological data like water level, temperature and chemistry of underground water, electromagnetic fluctuations in various frequencies, emission of radon and other gases, and anomalous animal behaviour (Rikitake Citation2001). Seismological events like foreshocks and pre-seismic quiescence can also be precursors. However, the majority of the reported EQ precursors are non-seismological.
This paper intends to deal, first of all, with the precursory behaviour of crustal movements for the 2011 Tohoku EQ and then the corresponding electromagnetic precursors to be compared with crustal movements, since it is definite that the electromagnetic precursors have their origin in the lithosphere. We first study the co-seismic and pre-seismic crustal movements, which would include three kinds of precursors: medium term, i.e. a few months, short term, in a few days to a few weeks, and imminent, in less than one day before an EQ. Then, we review mainly our published electromagnetic precursors including subionospheric very low frequency (VLF) anomaly (ionospheric perturbations), ultralow frequency (ULF) magnetic field depression and atmospheric ULF/ELF (extremely low frequency) radiation. Finally, we compare the temporal evolutions of mechanical and electromagnetic precursors and conclude that at least short-term electromagnetic precursors are causally related to the short-term crustal precursors. Even though the coupling mechanism is poorly understood, we finally present some discussions on the electromagnetic consequences of the EQ preparation (fracture) process.
2. GPS study of crustal movements
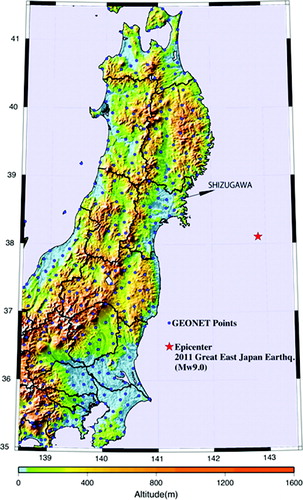
In the wake of the disastrous experiences of the 1995 Kobe EQ, the Japanese Government changed its attitude regarding EQ preparedness and established various kinds of scientific systems to monitor EQ-related phenomena. Included are the K-NET, KiK-net (Suzuki et al. Citation2011), Hi-net, F-net and GEONET systems. Among them, GEONET, GNSS (Global Navigation Satellite System) Earth Observation Network, is a system for measuring the crustal deformation of the Japanese islands using the GPS technique, while the others are systems for observing EQ motions. The GEONET system was officially established in the year of the 1995 Kobe EQ. Since then, its observation stations have increased year by year and now it amounts, as of 2011, to 1240 stations deployed over Japan. Its average station-to-station distance is about 25 km and the Geospatial Information Authority of Japan (GSI) has been operating all the stations continuously monitoring the deformations of the Japanese islands. The data collection rate has also been heightened year by year and a one-second rate has been realized nowadays; that is, it is now possible to grasp the absolute coordinates of the total 1240 observation stations every one second. The data of GEONET are widely available through the GSI website. shows the GEONET observation stations in east Japan.
Figure 1. Map of observation stations of GEONET (GSI Citation2011).
The GPS technique has become an essential tool for a millimetre to centimetre level of positioning. The accurate positioning methods by GPS are roughly divided into two categories: the differential GPS positioning (DGPS) method and the precise point positioning (PPP) method (Misra & Enge Citation2001). The DGPS method requires access to the observations of one or more reference stations with known coordinates, while the PPP technique needs only a single receiver for obtaining GPS satellite data. The PPP method, on the other hand, requires precise satellite orbits and clocks, meaning that the two methods have each advantage and disadvantage.
In order to achieve positioning of coordinates, in general, users have to carry out complicated calculations of either the DGPS technique or the PPP technique using observed data of GPS satellites. Such a process of calculations, however, is laborious, so that many institutes throughout the world provide positioning data processed by either technique, which are generally called the products, as well as raw GPS satellite data that have the so-called RINEX format. GEONET also provides the products of processed positioning data together with the RINEX data from each observation station. The positioning data resulting from the GEONET analyses are available in three different products: Q3, R3 and F3 with different accuracy. Among them, the F3 product is the most accurate one giving the absolute position of the observation station. GSI calls the F3 type of data “the daily coordinates at the GEONET observation station”. The F3 product, which is processed daily at 120,000 hours of the Coordinated Universal Time, UTC, is available every day through the GSI website. The F3 product is processed using the Bernese software that has its basis on the DGPS technique. In addition to such processed data, GSI provides the RINEX data sampled at a time interval of 30 seconds. We obtained the positioning of coordinates from such RINEX data by use of the PPP techniques such as the Gypsy software and the gLAB software while using the F3 products for long-period analyses of some 10 years. See Kamiyama et al. (Citation2011) for more details.
3. GPS data on crustal movements
3.1. Co-seismic crustal movements
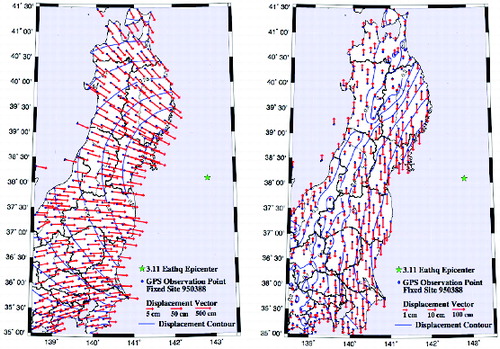
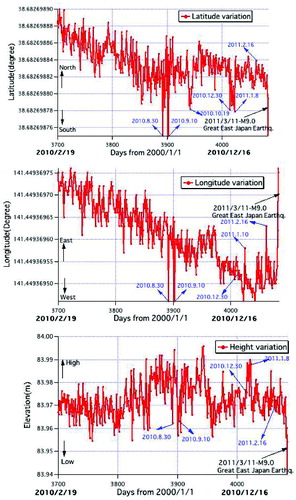
shows temporal variations of latitude, longitude and elevation of the F3 data obtained over the past 10 years at a representative observation station of GEONET, Shizugawa, whose position is shown in . presents also the occurrence dates of five damage-giving EQs including the 2011 Tohoku EQ during the period. It clearly illustrates how conspicuous were the movements of the crust at the Tohoku EQ, compared with the other EQs. From the F3 data of GEONET, it is possible to numerically obtain the co-seismic movements of each station due to an EQ (now the Tohoku EQ) by calculating the differences in absolute positions before and after the event. In order to obtain such co-seismic movements, we need a reference station because the F3 positioning data are due to the DGPS technique. We set here the Misumi station (the station number of 950388) in Shimane Prefecture as reference because of its long distance from the epicentre. At the same time, we need to determine here the reference times before and after the EQ. The official occurrence time of the Tohoku EQ is 054618 hours (UTC) on 11 March 2011, so the reference times for the pre- and post-EQ conditions of the F3 data were set up, respectively, to be 120,000 hours (UTC) on 10 March and 120,000 hours (UTC) on 12 March. We obtained numerically the displacements in the three directions of longitude, latitude and elevation at each observation station of GEONET using the three directional coordinates at these pre- and post-EQ times. shows the distributions of the horizontal and vertical displacements obtained. Both vectors of displacements were plotted in terms of logarithmic scale to clearly express their absolute values that are distributed broadly ranging from a large level of metre to a small one of centimetre. It is obvious at a glance in that the Honshu island of Japan moved greatly reaching some 5 m and 1 m in the horizontal and vertical directions, respectively, at some sites. The horizontal displacements occurred roughly toward the epicentre showing concentric circles of contour for their absolute values whereas the vertical ones showed subsidence and rise of land mainly depending on epicentral distance.
Figure 2. Time variations of latitude, longitude and height over the past 10 years at Shizugawa.
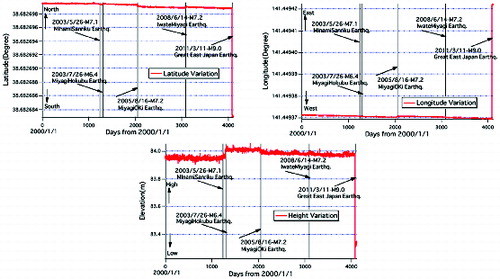
Figure 3. Co-seismic crustal movements obtained by GEONET (Left: horizontal component; right: vertical component).
3.2 Pre-seismic movements of the 2011 Tohoku EQ
3.2.1. Long-term variation and medium-term precursor
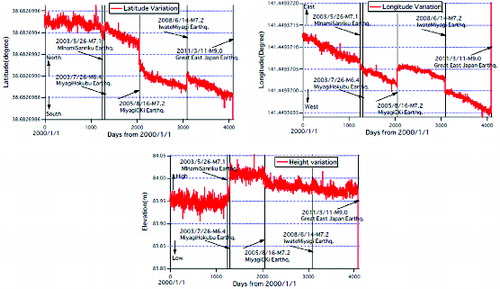
It was expected that pre-seismic movements would not be clearly seen in because they were usually much smaller than the co-seismic movements. In order to focus on the pre-seismic movements, the time variations are enlarged in the vertical axes of the three coordinates as shown in . does indicate that there are clear long-term trends in each coordinate: that is, a gradual displacement toward south in the latitudinal direction; a gradual displacement toward west and a small variation in the vertical direction. These long-term variations, especially the gradual movements in the latitude and longitude directions, might have resulted from the interaction between the movements of the plates surrounding Japan such as the Pacific Plate and North American Plate. The gradual trend toward south in the latitude direction does not necessarily agree with the well-known movements of the Pacific Plate, but the reason leading to such a trend is unclear in the present analysis. also shows abrupt co-seismic changes at the damage-giving EQs: they have a tendency to show zigzag movements reversely against the behaviour of the preceding or following EQs. It should be studied in the future whether or not this tendency has a relation to the mechanism of the EQs.
Figure 4. Time variations of latitude, longitude and height over the past 10 years at Shizugawa (enlarged in the vertical axes for each figure).
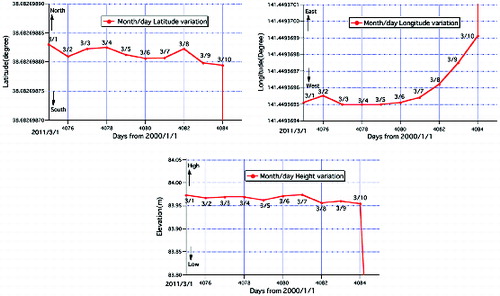
Medium-term pre-seismic movements for the case of the 2011 Tohoku EQ was further investigated by plotting the temporal variations of latitude, longitude and elevation for a period of about one year before the EQ as shown in . Although not so clear, one may recognize that the long-term trend toward south in latitude variation stops around six months before the EQ, showing a flat trend. The westward long-term trend of longitude changes also stopped about two months before the EQ. The variation trend of elevation showed a less number of changes. suggests that some medium-term pre-seismic movements of the crust might have occurred during several months before the Tohoku EQ.
Figure 5. Time variations of latitude, longitude and height over the past one year at Shizugawa (enlarged in the vertical axes for each figure).
3.2.2. Short-term precursor
shows the temporal variations of latitude, longitude and elevation for a period of about 10 days before the 2011 Tohoku EQ. also indicates day stamps to clearly show the daily variations. The time variations of movements are different for different directions, but the longitudinal direction indicates a remarkable precursory eastward variation, culminating in the final stage on 11 March.
Figure 6. Time variations of latitude, longitude and height over the past 10 days at Shizugawa (enlarged in the vertical axes for each figure).
is the result obtained only at a particular observation station, Shizugawa (see ). Similar movements of the crust simultaneously occurred at other observation stations. To show such results at many observation stations, we need displacements obtained by the fixed treatment for a reference observation station as mentioned in Section 3.1. The displacements at all the stations were numerically obtained by the fixed method of the reference station of Misumi similarly to the co-seismic displacements in . shows the locations of the eight representative observation stations near the epicentre of the 2011 Tohoku EQ, whose time variations of displacements are simultaneously compared. also provides the epicentres of the mainshock and the largest foreshock, which occurred with a magnitude of 7.3 on March 9. The temporal variations of displacements at these observation stations in the respective direction of east–west (EW), north–south (NS) and up–down (UD) for a period of some 10 days before the Tohoku EQ are plotted in . The time-varying trends of displacements at each observation station in are similar to those in .
Figure 7. Map of observation stations of GEONET (GSI Citation2011).
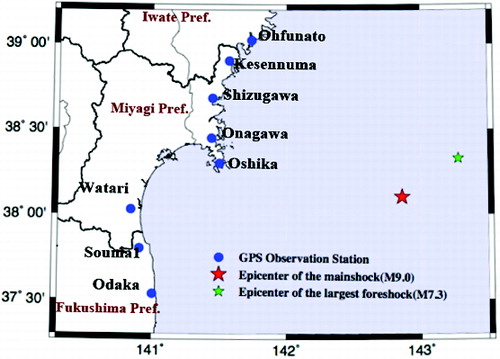
Figure 8. Time variations of displacements over the past 10 days at eight observation stations of GEONET.
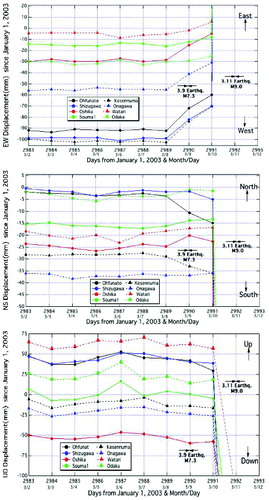
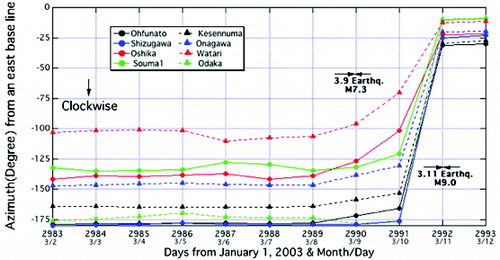
As to the clear trend of displacements in the EW direction, an alternative interpretation was presented that they are not the pre-seismic phenomena for the mainshock on 11 March, but the post-seismic movements of the largest foreshock on 9 March (Suito et al. Citation2012). It is difficult to definitely judge which interpretation is correct at this stage. Another parameter of time variations, the azimuth of the displacement vector, however, may provide a clue for this problem. shows the temporal variations of the azimuth of the horizontal displacement vector, which is measured counter-clockwise from the east base line, for the same period as in . The figure shows that the temporal variations of the azimuth of the horizontal displacement vector tend to stabilize after the mainshock on 11 March, whereas the azimuths continually increase from around 8 March to 11 March without stabilizing after 9 March when the largest foreshock occurred. Especially the increasing trends of the azimuth are more remarkable from 9 March to 10 March, which is a post-seismic period for the M7.3 largest foreshock, than the ones from 8 March to 9 March. Post-seismic variations after a shock may be smaller in magnitude compared with variations due to the shock itself. This interpretation leads to a judgment that the increasing trends of the azimuth in provide a pre-seismic sign before the 2011 Tohoku EQ rather than a post-seismic sign after the largest foreshock. This may mean that the time-varying trend of the azimuth can be an effective parameter to judge whether some variations are pre-seismic or post-seismic. The stability of displacement azimuth after mainshock should be further studied for many EQs, but characteristic time variations of the azimuth in at least suggest that those changes were a short-term precursory phenomenon to the occurrence of the 2011 Tohoku EQ.
Figure 9. Time variations of azimuth over the past 10 days at eight observation stations of GEONET.
3.2.3. Imminent precursor
– are the results from the F3 products of GEONET. As mentioned previously, the F3 products are positioning data analysed as a value at 120,000 hours (UTC) per day using the DGPS technique. It is thus impossible to analyse time variations of displacements at an interval shorter than one day as long as the F3 data are utilized. To overcome such a limit of the time resolution peculiar to the F3 data, we obtained positioning data sampled at a shorter interval of both 30 minutes and 30 seconds by applying the PPP technique to the 30-second RINEX data of GEONET. We used here the gLAB software as a PPP technique and the validity of the processed data was checked against the products due to the Gypsy software, which is similarly based on a PPP technique.
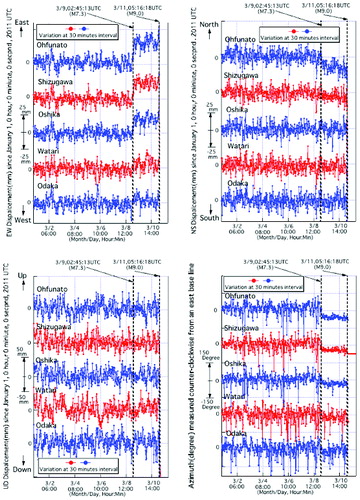
shows the temporal evolutions of displacements and azimuth, which are plotted in a similar manner to and , derived from the 30-minute analysis of the above-mentioned method. Note here that the displacements in are measured differently from the ones in , so the absolute amplitudes of the displacements and azimuth in differ from the ones in and . In addition, the number of the observation stations is reduced in for simplification. The displacements and azimuth in are found to fluctuate remarkably in time as a result of the interval of 30 minutes, but the amplitudes of fluctuations show a clear stepwise change around the time of the largest foreshock of M7.3, especially in both cases of the EW displacement and azimuth.
Figure 10. Time variations of displacements and azimuth at an interval of 30 minutes (five observation stations of GEONET).
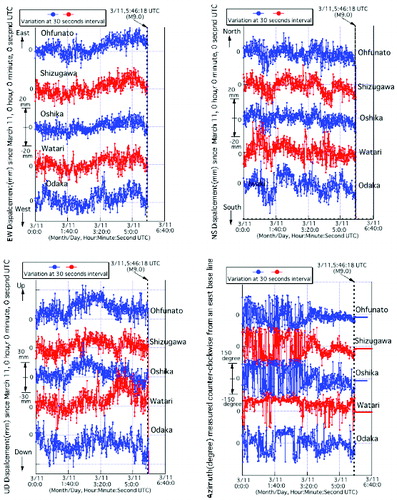
The 30-seconds analyses, on the other hand, are shown in for several hours before the EQ in a manner similar to . Note that the displacements in are measured from 00:00:00 hour, 11 March 2011 (UTC). The displacements and azimuth sampled at a 30-second interval in also fluctuate from time to time and the fluctuations differ depending on the parameter. Especially, it is notable that the EW displacements show an increasing trend starting from around three hours before the mainshock of M9.0 as an imminent precursor and the azimuth starts to stabilize its fluctuation around the same time. This means that a pre-seismic phenomenon existed for the time variations of displacements and azimuth even during a few hours immediately before the 2011 Tohoku EQ. Guglielmi et al. (Citation2013) have recently studied the foreshocks of strong EQs in light of catastrophe theory. Their analysis indicates a sharp increase of foreshock activity three hours before the main shock, including our 2011 Tohoku EQ, which is consistent with our GPS results.
Figure 11. Time variations of displacements and azimuth at an interval of 30 seconds (five observation stations of GEONET).
4. Electromagnetic phenomena in relation to crustal movements
4.1. Summary of crustal movements for the 2011 Tohoku EQ
Possibly precursory crustal movements appeared in GPS data before the 2011 Tohoku EQ with different time-scales: several months (medium term), about three days to one week (short term) and a few hours (imminent). Among them, short-term movements were sufficiently convincing as precursors. The reason that we regard these as the precursor to the EQ is based on the following three facts. The first is that abnormal and unusual variations appeared showing an explicitly different trend from the past, the second is that such abnormality was simultaneously detected at many sites, and the third is that such abnormal variations had a trend to increase day by day, especially in the variations of azimuth of displacements. Moreover, the precursor detected for this EQ on three days earlier than the event was interestingly consistent, in its time scale, with the abnormal phenomena of the crust experienced for the 1944 Tohnankai EQ (Mogi Citation1985).
In addition to the precursor spanning during one week to about three days, an imminent precursor was detected about three hours before the mainshock as a result of the 30-second analysis of the GEONET data.
The precursory displacements detected by GEONET imply that some pre-slips of faulting might have occurred in a large area of the seismic source far from the land. Because the detected precursory displacements range from some centimetres to 10 cm, the related pre-slips of faulting in the source area may amount to some 10 cm to 100 cm or even more. Such large pre-slips of faulting could have triggered not only crustal movements, but also various kinds of natural phenomena such as the electromagnetic effects, abnormal behaviour of animals, etc., on land.
4.2. Electromagnetic phenomena with crustal movements
In this section, we intend to show that the observed electromagnetic phenomena are possibly related with the precursory crustal movements by comparing the temporal evolutions of different kinds of seismo-electromagnetic phenomena with those of the GPS data. Then, in the discussion section, we try to infer what is happening within the lithosphere leading to the generation of seismo-electromagnetic signatures.
4.2.1. Medium-term (a few to several months) electromagnetic precursors
The GPS study in the previous section suggests the existence of medium-term precursor of crustal movements, about six months to approximately three months before the EQ, but unfortunately they were not sufficiently clear.
As is known from the investigation during the last 20 years, electromagnetic anomalies are known to have the lead time of a few days to a few weeks (at most one month) (e.g. Pulinets & Boyarchuk Citation2004; Varotsos Citation2005; Hayakawa et al. Citation2007; Molchanov & Hayakawa Citation2008; Fraser-Smith Citation2009). Larger lead time is generally attached with lower frequency signals such as direct current (DC) geoelectric signals or DC geomagnetic field. No observational data of DC geoelectric signals are available for the 2011 Tohoku EQ since there was no observation station in the area, but Kopytenko et al. (Citation2012) have investigated the DC and ULF geomagnetic data at Esashi in the Tohoku area, the closest geomagnetic station to the EQ epicentre (distance ∼ 170 km), for 10 years before the 2011 Tohoku EQ. Four local anomalies were observed in the secular variations of DC geomagnetic field, and the last one, being the largest, began three years prior to the EQ. On the other hand, lithospheric emissions in the ULF (f = 0.033 to 0.01 Hz) band exhibit the clearest anomaly from 22 February 2011 (Kopytenko et al. Citation2012), but there is no clear crustal movement in this time range. Sarlis et al. (Citation2013) and Skordas and Sarlis (Citation2014) have analysed the seismicity (not GPS data) in Japan by means of the natural time method, and have found that the fluctuations of the order of the parameter κ exhibited an unprecedented minimum around 5 January 2011, i.e. about two months before the 2011 Tohoku EQ. This date could have coincided with the initiation of a SES (DC geoelectric signal) activity if measurements were made, when considering the earlier cases in Japan (Varotsos et al. Citation2013) where both seismic and geoelectrical data were available. Xu et al. (Citation2013) have found that the anomalous magnetic field (Z component) variations at the same Esashi station as in Kopytenko et al. (Citation2012) started on 4 January 2011 approximately on the same date, and this anomaly lasted for about 10 days. These medium-term electromagnetic anomalies are compared with the GPS data, but there seems to be no definite correlation between them.
4.2.2. Short-term (a few days to a few weeks) electromagnetic precursors
The clearest anomaly in crustal movements presented in the previous section is the short-term precursor before the 2011 Tohoku EQ as shown in . The longitude exhibited a sharp increase on March 6–10, and it stayed flat just like a transitional plateau for the period of March 3–6.
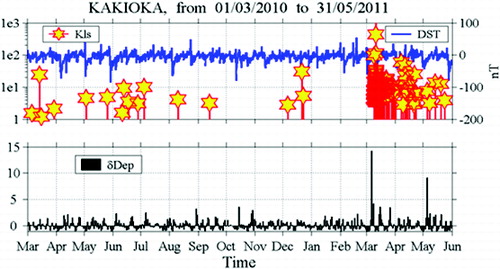
This period of 3–6 March has recently been reported to be full of electromagnetic signatures (Hayakawa et al. Citation2012; Hayakawa, Hobara, et al. Citation2013; Hayakawa, Rozhnoi, et al. Citation2013). illustrates the VLF propagation anomaly for a particular propagation path ((a)) which is characterized in (b) by a conspicuous decrease in the trend (average night-time amplitude) (Hayakawa, Hobara, et al. Citation2013; Hayakawa, Rozhnoi, et al. Citation2013). This VLF anomaly indicates that the lower ionosphere was perturbed on 5 and 6 March. Next, illustrates the temporal evolutions of a few related electromagnetic phenomena (after Schekotov et al. (Citation2013)). The top panel refers to the temporal evolutions of geomagnetic activity (Dst index) and of seismic activity expressed by Kls (the detailed expression is given in Molchanov and Hayakawa (Citation2008)) as a function of EQ magnitude and epicentral distance (Molchanov & Hayakawa Citation2008). The bottom panel indicates the magnetic field depression of ULF waves (of magnetospheric origin). (The detailed definition of the magnetic field depression is described in Schekotov et al. (Citation2013).) The frequency range is 0.03–0.05 Hz, and only the local night-time data are used. This ULF magnetic field depression, which is also found to be attributed to the same lower ionospheric perturbation as subionospheric VLF/LF propagation anomalies (Hayakawa, Rozhnoi, et al. Citation2013), took place on 6 March. So, we can conclude that the ionospheric perturbations have definitely occurred on 5 and 6 March, and they were electromagnetic precursors to the EQ.
Figure 12. (a) The relative locations of one Japanese VLF/LF transmitter (with call sign of JJY (Fukushima) indicated by blue diamonds) and VLF/LF receiving stations (Moshiri (MSR), Chofu (CHF), Kasugai (KSG) and Kochi (KCH) shown with red stars). The wave-sensitive area defined by the Fresnel zone (elliptic zone) for the propagation path of JJY-MSR is plotted, and also that for the propagation path of NLK (Seattle, USA)-CHF is plotted. Further, the great-circle paths (in red thin lines) and the corresponding wave-sensitive areas (in black thin lines) are indicated for the paths of NLK-KSG and NLK-KCH. The epicentres of the main shock and its foreshock are indicated with red stars in the sea with the corresponding dates (GSI Citation2011). (b) Temporal evolutions of the propagation characteristics for one particular path of NLK-CHF. The top panel refers to the average night-time amplitude (called trend) and the bottom, to the dispersion. Both values are normalized by their corresponding standard deviations (σ). A clear anomaly is seen on 5 and 6 March.
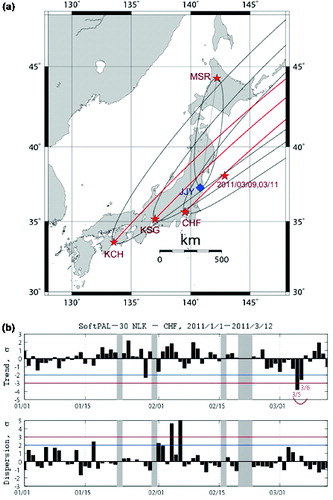
Figure 13. Top panel: temporal evolutions of geomagnetic (Dst index) and seismic activities expressed by Kls (defined by Molchanov and Hayakawa (Citation2008)) (EQ as yellow with its height indicating its value of Kls). Bottom panel: the normalized magnetic field depression δDep at a frequency in the range 0.03–0.05 Hz, with its definition being described in Schekotov et al. (Citation2013). To view this figure in colour, please see the online version of the journal.
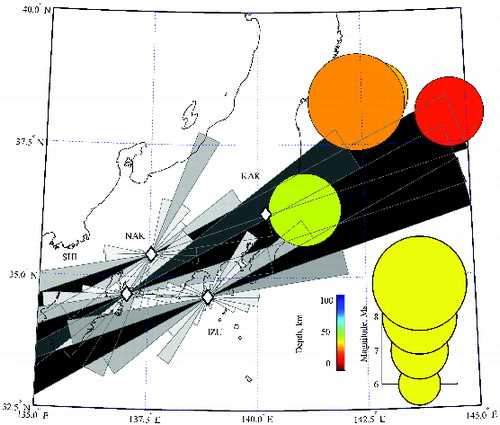
The last short-term electromagnetic precursor was reported in Ohta et al. (Citation2013). The ULF/ELF electromagnetic radiation, which is considered to be generated in the near-Earth surface or in the atmosphere, was maximized on 6 March, and the azimuthal directions of these emissions from their three stations (Nakatsugawa, Shinojima and Izu) on that day coincided with the direction to the EQ epicentre, as shown in . So, this ULF/ELF emission is likely to be generated in an area around the EQ epicentre.
Figure 14. The ELF radiation was recorded on 6 March at three observatories of Nakatsugawa (NAK), Shinojima (SHI) and Izu (IZU), whose positions are shown by diamonds, and the corresponding azimuthal directions of ELF radiation from the three observatories, in good agreement with EQ epicentral position. Magnitudes and depths of EQs are represented by the size and colour of circles. After Ohta et al. (Citation2013). Reprinted by permission of American Geophysical Union. To view this figure in colour, please see the online version of the journal.
From the above-described temporal synchronizations, we can infer that there exists some process in the ground which may be closely related to the generation of subsequent electromagnetic phenomena.
4.2.3. Imminent-term (less than one day) electromagnetic signature
We have already indicated that the EW displacements show an increasing trend and the fluctuation of azimuth decreased at about three hours before the EQ ().
In response to this change of crustal movements, we have tried to look for the corresponding electromagnetic signature such as imminent ULF emissions (Fraser-Smith et al. Citation1990; Molchanov et al. Citation2005). However, it seems difficult for us to detect any imminent electromagnetic precursors because the time period in question was daytime when the electromagnetic noise environment remains bad at our Japanese stations.
5. Conclusion and discussion
Crustal movements precursory to the 2011 Tohoku EQ have been extensively studied by means of the GPS data for 10 years before the main shock in three time frames: (1) medium-term (about six to approximately three months), (2) short-term (about one week to a few days) and (3) imminent-term (starting three hours before the EQ). Among the three, conspicuous precursors were found for short-term movements.
Then, a review has been made on published electromagnetic precursors, including subionospheric VLF propagation anomaly (i.e. ionospheric perturbations), ULF magnetic field depression (again the signature of the same ionospheric perturbation) and atmospheric ULF/ELF radiation. All of these electromagnetic precursors were found to take place in the period of 3–6 March 2011, just before the 2011 Tohoku EQ, when the crustal movements exhibited the short-term abnormal behaviour.
Establishment of the short-term synchronization between crustal movements and electromagnetic phenomena is the main outcome of this paper, which would lend strong evidence on the link between them. This would lend a further support to the concept of lithosphere–atmosphere–ionosphere (LAI) coupling, even though the details are to be investigated in future.
In the following, we try to discuss the fracturing process taking place in the EQ focal region at some depth, because electromagnetic phenomena are not expected to be generated on the Earth's surface monitored by the GPS technique, but within the lithosphere. That is, we are obliged to investigate the mechanism how and why such electromagnetic phenomena are generated in the EQ preparation process, even though these processes themselves are still far from complete understanding (Pulinets & Boyarchuk Citation2004; Molchanov & Hayakawa Citation2008). There have been some seismological models to explain short-term precursors, as summarized in Molchanov and Hayakawa (Citation2008): (1) nucleation due to stick-slip instability on the active fault (dry dilatancy), (2) mechanism for EQ nucleation based on the microcracks coalescence and (3) dilatancy diffusion of the crack ensemble (wet dilatancy). Recently, there have been more arguments to link the electromagnetic precursors with the corresponding EQ preparation (fracture) process on the basis of laboratory experiments and theoretical studies of fracture dynamics (Kapiris et al. Citation2004; Eftaxias et al. Citation2013; Eftaxias & Potirakis Citation2013). Though it is simplified, Eftaxias et al. (Citation2013) have proposed a two-stage model of EQ dynamics as follows: (1) the initial emissions of very high frequency (VHF) waves originating from the cracking in the highly heterogeneous material that surrounds the backbone of asperities distributed along the stressed fault and (2) the abrupt emergence of strong avalanche-like ELF/VLF electromagnetic emissions thought to be due to the fracture of the family of the asperities themselves. Based on their own observations at VHF and VLF, they consider that VHF emission is a typical signature of the first stage, whereas VLF kHz emission is the peculiar phenomenon of the second stage, which takes place from a few tens of hours to a few minutes before the EQ occurrence. In our present case, unfortunately no VHF emission data are available for the Tohoku EQ. ULF lithospheric emissions were not clearly observed either, while ELF radiation of atmospheric origin was observed on 5 and 6 March (see ). Based on the direction finding of ULF/ELF emissions in , they were probably generated in the epicentral area. Disturbances of the upper atmosphere or ionosphere in the period 3–6 March were also supported by the ULF magnetic field depression observed at the Kakioka station in .
Though the main topic of this paper is not going into the details of LAI coupling, we are obliged to make a brief comment on this mechanism. There have been proposed a few hypotheses on this LAI coupling mechanism, such as (1) a chemical channel in which radon emanation plays the main role (Pulinets & Boyarchuk Citation2004), (2) an electrostatic channel due to the subsurface generation of charges (positive holes) (Freund Citation2009) and (3) an atmospheric oscillation (acoustic and atmospheric gravity waves) channel, in which some actions on the ground surface excite atmospheric oscillations, propagating upwards to the ionosphere (Molchanov & Hayakawa Citation2008). As for the second channel, there have been accumulated various observational facts supporting this channel, including the associated field ionization of air molecules at the ground-to-air interface due to the bulid-up of electric fields at the Earth surface (Bleier et al. Citation2012). Similarly, Hayakawa et al. (Citation2011) have summarized numerous evidence in support to the third channel, such as a lot of indirect evidence on the enhancement in VLF/LF fluctuation spectra in the frequency rages of atmospheric gravity waves before an EQ, direct evidence on VLF Doppler results, etc. Moreover, a new idea of the generation of electromotive force, due to the emanation of charged ions simultaneously with the radon emanation, has been proposed to explain satisfactorily both a negligible variation of the near-Earth surface electric field and a significant increase in the ionospheric electric field (Sorokin and Hayakawa Citation2013). However, it is definite that much more work is required on this coupling mechanism. Apparently, all of the short-term electromagnetic phenomena we observed are the signatures of the first stage in the two-stage model, i.e. when microcracks are generated. The imminent precursors may be in the second avalanche stage, but no significant electromagnetic effects were detected from our data-set in the second avalanche stage.
The electromagnetic precursors for the 2011 Tohoku EQ are not so abundant as compared with those for the 1995 Kobe inland EQ (Nagao et al. Citation2002), which may be related to either a difference in the location of the EQ hypocentre in the sea or land or to a difference simply in focal distance to the stations. Including these subjects, we do think that further thorough study is highly required on the generation of lithospheric and atmospheric electromagnetic emissions and the LAI coupling mechanism.
Acknowledgements
The authors are grateful to two unknown referees and the editor for their extremely useful suggestions and comments, which helped us improve this paper very much.
References
- Bleier T, Dunson C, Roth S, Heraud J, Lira A, Freund F, Dahlgren R, Bambery R, Bryant N. 2012. The frontier of earthquake prediction studies. In: Hayakawa M, editor. Ground-based and space-based electromagnetic monitoring for pre-earthquake signals. Tokyo: Nihon-senmontosho-Shuppan; p. 282–305.
- Eftaxias K, Potirakis SM. 2013. Current challenges for pre-earthquake electromagnetic emissions: shedding light from micro-scale plastic flow, granular packings, phase transitions and self-affinity notion of fracture process. Nonlinear Process Geophys. 20:771–792.
- Eftaxias K, Potirakis SM, Chelidze T. 2013. On the puzzling feature of the silence of precursory electromagnetic emissions. Nat Hazards Earth Syst Sci. 13:2381–2397.
- Fraser-Smith AC. 2009. Electromagnetic phenomena associated with earthquakes. In: Hayakawa M, editor. The ultralow-frequency magnetic fields associated with and preceding earthquakes. Trivandrum: Transworld Research Network; p. 1–20.
- Fraser-Smith AC, Bernardi A, McGill PR, Ladd ME, Helliwell RA, Villard OG. 1990. Low-frequency magnetic field measurements near the epicenter of the Ms 7.1 Loma Prieta Earthquake. Geophys Res Lett. 17:1465–1468.
- Freund F. 2009. Electromagnetic phenomena associated with earthquakes. In: Hayakawa M, editor. Stress-activated positive hole charge carriers in rocks and the generation of pre-earthquake signals. Trivandrum: Transworld Research Network; p. 41–96.
- [GSI] Geospatial Information Authority of Japan. Home page. Available from: http://www.gsi.go.jp
- Guglielmi AV, Sobisevich AL, Sobisevich LE, Lavrov IP. 2013. On the foreshocks of strong earthquakes in the light of catastrophe theory. arXiv:1310.7060 [ physics.geo-ph].
- Hayakawa M, editor. 2009. Electromagnetic phenomena associated with earthquakes. Trivandrum: Transworld Research Network.
- Hayakawa M, editor. 2013. Earthquake prediction studies: seismo electromagnetics. Tokyo: TERRAPUB.
- Hayakawa M, Hattori K, Ohta K. 2007. Monitoring of ULF (ultra-low-frequency) geomagnetic variations associated with earthquakes. Sensors. 7:1108–1122.
- Hayakawa M, Hobara Y. 2010. Current status of seismo-electromagnetics for short-term earthquake prediction. Geo Nat Hazards Risk. 1:115–155.
- Hayakawa M, Hobara Y, Rozhnoi A, Solovieva M, Ohta K, Izutsu J, Nakamura T, Kasahara Y. 2013. The ionospheric precursor to the 2011 March 11 earthquake based upon observations obtained from the Japan-Pacific subionospheric VLF/LF network. Terr Atmos Ocean Sci. 24:393–408.
- Hayakawa M, Hobara Y, Yasuda Y, Yamaguchi H, Ohta K, Izutsu J, Nakamura T. 2012. Possible precursor to the March 11, 2011, Japan earthquake: ionospheric perturbations as seen by subionospheric very low frequency/low frequency propagation. Ann Geophysics (Italy). 55(1): 95–99.
- Hayakawa M, Kasahara Y, Nakamura T, Hobara Y, Rozhnoi A, Solovieva M, Molchanov OA, Korepanov, V. 2011. Atmospheric gravity waves as a possible candidate for seismo-ionospheric perturbations. J Atmos Electr. 31:129–140.
- Hayakawa M, Molchanov OA, editors. 2002. Seismo electromagnetics: lithosphere-atmosphere-ionosphere coupling. Tokyo: TERRAPUB.
- Hayakawa M, Rozhnoi A, Solovieva M, Hobara Y, Ohta K, Schekotov A, Fedorov E. 2013. The lower ionospheric perturbation as a precursor to the 11 March 2011 Japan earthquake. Geo Nat Hazards Risk. 4(3): 275–287.
- Hirose F, Miyaoka K, Hayashimoto N, Yamazaki T, Nakamura M. 2011. Outline of the 2011 off the Pacific coast of Tohoku earthquake (Mw 9.0) – Seismicity: foreshocks, mainshock, aftershocks, and induced activity. Earth Planets Space. 63:513–518.
- [JMA] Japan Metrological Agency. 2011. The 2011 off the Pacific coast of Tohoku earthquake. A Quick Report on Damage Earthquake and Tsunami. Japanese.
- Kamiyama M, Matsukawa T, Anazawa M. 2011. [Comparisons between damages and motion parameters caused by the 2008 Iwate-Miyagi Nairiku Earthquake]. J Jpn Assoc Earthquake Eng. 11:53–67. Japanese.
- Kapiris PG, Eftaxias KA, Chelidze TL. 2004. Electromagnetic signature of prefracture criticality in heterogeneous media. Phys Rev Lett. 92:065702. doi:10.1103/PhysRevLett.92.065702.
- Kopytenko YuA, Ismaguilov VS, Hattori K, Hayakawa M. 2012. Anomaly disturbances of the magnetic fields before the strong earthquake in Japan on March 11, 2011. Ann Geophys (Italy). 55:101–107.
- Misra P, Enge P. 2001. Global positioning system. Massachusetts (MA): Ganga-Jamuna Press.
- Mogi K. 1985. Temporal variation of crustal deformation during the days preceding a thrust-type great earthquake – the 1944 Tonankai Earthquake of magnitude 8.1, Japan. Pure Appl Geophys. 122:765–780.
- Molchanov OA, Hayakawa M. 2008. Seismo electromagnetics and related phenomena: history and latest results. Tokyo: TERRAPUB.
- Molchanov OA, Schekotov A, Solovieva M, Fedorov E, Gladyshev V, Gordeev E, Chebrov V, Saltykov D, Sinitsin VI, Hattori K, Hayakawa M. 2005. Near-seismic effects in ULF fields and seismo-acoustic emission: statistics and explanation. Nat Hazards Earth Syst Sci. 5:1–10.
- Nagao T, Enomoto Y, Fujinawa Y, Hata M, Hayakawa M, Huang Q, Izutsu J, Kushida Y, Maeda K, Oike K, et al. 2002. Electromagnetic anomalies associated with 1995 Kobe earthquake. J Geodynamics. 33:477–487.
- Ohta K, Izutsu J, Schekotov A, Hayakawa M. 2013. The ULF/ELF electromagnetic radiation before the 11 March 2011 Japanese earthquake. Radio Sci. 48:589–596.
- Pulinets S, Boyarchuk K. 2004. Ionospheric precursors of earthquakes. Berlin: Springer.
- Rikitake T. 2001. Predictions and precursors of major earthquakes: the science of macro-scopic anomalous phenomena. Tokyo: TERRAPUB.
- Sarlis NV, Skordas ES, Varotsos PA, Nagao T, Kamogawa M, Tanaka H, Uyeda S. 2013. Minimum of the order parameter fluctuations of seismicity before major earthquakes in Japan. Proc Natl Acad Sci. 110:13734–13738.
- Schekotov A, Fedorov E, Hobara Y, Hayakawa M. 2013. ULF magnetic field depression as a possible precursor to the 2011/3.11 Japan earthquake. J Atmos Electr. 33:41–51.
- Skordas ES, Sarlis NV. 2014. On the anomalous changes of seismicity and geomagnetic field prior to the 2011 Mw 9.0 Tohoku earthquake. J Asian Earth Sci. 80:161–164.
- Sorokin V, Hayakawa M. 2013. Generation of seismic-related DC electric fields and lithosphere-atmosphere-ionosphere coupling. Mod Appl Sci. 7:1–25.
- Suito H, Nishimura T, Kobayashi T, Ozawa S, Tobita M, Imakiire T. 2012. [Co- and post-seismic deformation and fault model of the 2011 off the Pacific coast of Tohoku earthquake]. Zishin. 65:95–121. Japanese.
- Suzuki W, Aoi S, Sekiguchi H, Kunugi T. 2011. Rupture process of the 2011 Tohoku-Oki mega-thrust earthquake (M9.0) inverted from strong-motion data. Geophys Res Lett. 38:L00G16.
- Uyeda S, Nagao T, Kamogawa M. 2009. Short-term earthquake prediction: current state of sesimo-electromagnetics. Tectonophysics. 470:205–213.
- Varotsos PA. 2005. The physics of seismic electric signals. Tokyo: TERRAPUB.
- Varotsos PA, Sarlis NV, Skordas ES, Lazaridou MS. 2013. Seismic electric signals: an additional fact showing their physical interconnection with seismicity. Tectonophysics. 589:116–125.
- Xu G, Han P, Huang Q, Hattori K, Febriani F, Yamaguchi H. 2013. Anomalous behaviors of geomagnetic diurnal variations prior to the 2011 off the Pacific coast of Tohoku earthquake (Mw9.0). J Asian Earth Sci. 77:59–65.