
 ?Mathematical formulae have been encoded as MathML and are displayed in this HTML version using MathJax in order to improve their display. Uncheck the box to turn MathJax off. This feature requires Javascript. Click on a formula to zoom.
Abstract
The March 22, 2014 Oso mudslide at Washington was an extreme event costing nearly 40 deaths and damaging civilian properties. Historic record indicates that there have been serial events in decades. In our study, the combination of multi-source digital elevation models (DEMs), interferometric synthetic aperture radar (InSAR), and time-series InSAR analysis allowed us to characterize the Oso mudslide. The difference of shuttle radar topography mission (SRTM) and 2003 light detection and ranging (LiDAR) DEM indicated the topographic changes before 2006 mudslide, and the combination of time-series InSAR analysis and old-dated DEM (2000 SRTM, 2003 LiDAR DEM) revealed topographic changes associated with the 2006 sliding event. InSAR results from advanced land observing satellite (ALOS) phased array type L-band synthetic aperture radar (PALSAR) and LiDAR DEMs show that there were no significant topographic changes between 2007 and 2013 before the 2014 mudslide. The lasting toe erosion and logging near the landslide site could affect the 2006 mudslide event. Elevated discharges during wet seasons after 2006 accelerated the erosion of slumps deposited after the 2006 mudslide, which lessened the beneficial buttressing effect of the landslide toe with increased pore pressure during relatively higher rainfall after 2006. The vicious toe erosion within a relatively short period of eight years might play a critical role on the run-away event at Oso in 2014.
1. Introduction
Landslide is the downslope movement of soil and/or rock under the influence of gravity. The landslide hazard can be triggered by physical (increased moisture, volcanic eruption, earthquake), natural (erosion, wildfire), or human (overdevelopment, mining, deforestation) causes (Highland & Bobrowsky Citation2008), annually costing $3.5 billion (in 2005 dollars) and casualties between 25 and 50 in the United States (USGS Citation2005). Due to a variety of landslide types (Varnes Citation1978), the event can happen anywhere with instability of fine or coarse soil elements, regardless of steep or flat terrains. It is generally supposed to be unpredictable in terms of occurrence time of the landslide. However, many landslides are repetitive, and therefore careful observation of critical factors, such as ground displacement, precipitation, stratigraphy, groundwater level, and stream flow, can reduce the risk of property damage and casualty loss (Anderson & Holcombe Citation2013). In particular, frequent observations over areas with high precipitation and deforestation can play a role in identifying the precautionary regions exposed to recurring landslides (Giannecchini et al. Citation2012; George & Iverson Citation2014). Nevertheless, when a mountainous and steep region is our interest, acquiring the valuable spatio--temporal information can be challenging due to the lack of in situ data and disturbance by weather condition and rugged topography.
Interferometric synthetic aperture radar (InSAR) has proved valuable in mapping ground surface movement and landscape under inclement weather conditions (e.g. Lu et al. Citation2010; Lu & Dzurisin Citation2014). Conventional InSAR technique (e.g. Carnec et al. Citation1996; Fruneau et al. Citation1996) and advanced InSAR methods including short baseline subset (SBAS) InSAR (e.g. Berardino et al. Citation2002; Lanari et al. Citation2004; Casu et al. Citation2006) and persistent scatter InSAR (e.g. Ferretti et al. Citation2000, Citation2001; Colesanti, Ferretti, Locatelli et al. Citation2003) have provided critical information on landslide location, slump delineation, and analysis of sliding mechanics (Colesanti, Ferretti, & Prati Citation2003; Colesanti & Wasowski Citation2006; Farina et al. Citation2006; Greif & Vlcko Citation2012; Zhao et al. Citation2012; Tofani et al. Citation2013; Bardi et al. Citation2014). However, InSAR application to landslide has been challenging, because radar geometry causes layovers or shadows in steep areas and temporal and spatial decorrelations degrades the coherence of interferograms. Moreover, over landslides where the topography is frequently modified, imprecise DEM (digital elevation model) can induce significant artifacts in InSAR imagery, which is a formidable obstacle in precise tracking of landslide motions.
Our report here stemmed from an idea that topographic error in the InSAR process is not merely an error, which is usually disregarded, but can indicate the landslide and thereby mass movement between the time when the used DEM was produced and InSAR acquisition dates. Our study focused on quantifying topographic changes and the ground deformation caused by landslides using InSAR methods and multi-source DEMs over a mudslide in Oso, Washington that has a long history of sliding events and killed nearly 40 people in the recent catastrophic movement on March 22, 2014.
2. Site characterization and data
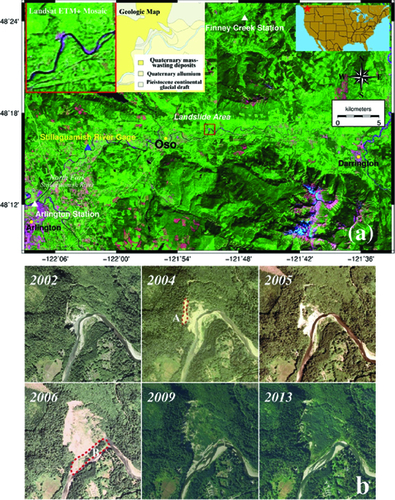
Our study region is located in the east of Oso, Washington ((a)) alongside the Whitman Bench, a large and flat terrace remnant of the glacier-associated valley-filling deposits (inset of (a)). Traditionally, the Whitman Bench has been managed for timber production, and the stratigraphy of the area consists of thick sequence of glaciofluvial sediments overlaying lacustrine silts and clays (Miller & Sias Citation1998). The Oso landslide, historically, occurred along the downhill with the steep topography, edging the Whitman Bench bounded by the Stillaguamish River. The landslide has a long history of serial sliding events for decades (in 1937, 1951, 1952, 1967, 1988, and 2006) (Miller & Sias Citation1997) with dormant periods (i.e. between 1967 and 1988), leading to the difficulty in forecasting the run-away event. Aerial photography ((b)) could delineate the catastrophic events (2006 mudslide event), but it had limits in capturing three-dimensional movements in the landslide site.
Figure 1. (a) Landsat overview map including the region of the Oso mudslide (red-boxed area). The landslide site was ∼6.4 km east of Oso, Washington. White and blue triangles indicate the location of weather station and river gage site, respectively. Geologic map (inset of figure) includes three geologic units of quaternary mass-wasting deposits, quaternary alluvium, and Pieistocene continental glacial drift. (b) Aerial photographs over the Oso mudslide site in 2002, 2004, 2005, 2006, 2009, and 2013. “A” region was collapsed before 2004, and slumps and debris by the Oso mudslide in 2006 disrupted the river flow of the North Fork of the Stillaguarmish River (“B” region). Vegetation returned in 2009 and the landslide toe has been eroded by the river. To view this figure in colour, please see the online version of the journal.
In this report, we used SAR images as well as available DEMs to quantify the deformation and topographic changes caused by mass movements over the Oso landslide. The SAR data used for this study were from advanced land observing satellite (ALOS) phased array type L-band synthetic aperture radar (PALSAR), which has the advantage in coherence due to relatively deep penetration of L-band radar signal over the vegetated regions. In contrast, both C-band environmental satellite (ENVISAT) and Radarsat-1 SAR images could not keep high coherence in our study area due to dense vegetation. Nineteen SAR data, acquired between February 2007 and January 2011, were used for our analysis. The ascending-mode acquisition from the west of the landslide site made subtle shadow over the head scarp, causing the loss of useful observations over shadowed area. Only 13 InSAR pairs, which suffered less in temporal and spatial decorrelations, were useful, because the geometrical distortion in steep topography and the temporal variation of vegetation weakened coherence in most interferograms. Multi-source DEMs from shuttle radar topography mission (SRTM) and light detection and ranging (LiDAR) were used to supplement our analysis for detecting and validating mass movements. SRTM DEM was acquired in 2000, and LiDAR DEMs in 2003 and 2013. Their acquisition dates are notable, because they facilitated long-term monitoring between 2000 and 2013. In addition, the LiDAR DEM term can be separated into digital surface model (DSM) reflecting heights of trees and digital topography model (DTM) representing the elevation of bare earth. SRTM is between DTM and DSM due to the penetration of C-band radar signal, and LiDAR generates both DSM and DTM.
3. Method
The SBAS InSAR method has the capability to estimate temporal deformation and topographic errors (here topographic changes) from multiple InSAR pairs in contrast to conventional InSAR method. Because the deformation correlates with time and the topographic error of the DEM used in SBAS method correlates with the perpendicular baseline, the SBAS procedure extracting topographic changes in the SBAS method depends on
(1)
(1) where
is unwrapped interferometric phase of InSAR pair from time
and
,
is topographic changes,
is perpendicular baseline of the InSAR pair,
is a slant range between a satellite and target, and
is an incidence angle (Samsonov Citation2010). Therefore, robust SBAS process extracting the DEM error artifact requires that InSAR pair with large perpendicular baselines should maintain coherence in the landslide site. Generally, the SBAS processing that exploits multiple interferograms can suppress the phase changes related to spatially correlated but temporally uncorrelated atmospheric variations. However, the Oso landslide area is small (0.8 × 1 km in dimension), occupying only 80 × 100 pixels in the original scale of SAR images and 27 × 34 pixels in the multi-looked InSAR images. Therefore, the atmosphere-related phase variation over our study area was not considered as a major contribution in our interferograms. In this study, we used multi-temporal InSAR images to retrieve both the topographic changes and landslide motion. Moreover, differencing multi-source DEMs from SRTM and LiDAR was also used for the same purpose. To clarify, the topographic change represents a sudden change of terrain height between the time when the DEM (used in InSAR processing) was acquired and the time of the first SAR image. The deformation refers to a relatively gradual movement of the landslide during the time when SAR images were acquired.
4. Result
The topographic changes at Oso mudslide before 2014 were estimated by using the differences of SRTM DEM (acquired in 2000) and LiDAR DSM/DTM (acquired in 2003 and 2013), and the SBAS InSAR method based on SAR images of 2007--2011 and DEMs. Deformation between early 2007 and 2011 was also derived from the SBAS InSAR method. Because the grid size of SRTM (∼30 m) is different from that of LiDAR DEMs (1.83 m for 2003 LiDAR DEM, 0.91 m for 2013 LiDAR DEM), we resampled DEMs to 10 m to match the resolution of the ALOS PALSAR imagery. Also, the offsets between multi-source DEMs can induce errors in the analysis, and therefore should be corrected based on cross-correlation among DEMs.
The difference map ((a)) of 2000 SRTM DEM and 2003 LiDAR DTM describes the topographic changes between 2000 and 2003 that occurred in the lower scarp. The topographic changes from the SBAS method based on SRTM ((b)) and LiDAR DTM ((c)) represented elevation changes, which occurred between 2000 (SRTM) or 2003 (LiDAR) and 2007 (the first SAR acquisition date). The SBAS method can estimate time-series deformation as well as topographic changes, but the time-series deformation between 2007 and 2011 was negligible ((d)). The slumps from downslope movement were described as positive topographic changes ((b) and (c)) in relatively low-lying lands, and the collapse and erosion of the lower scarp were expressed as negative topographic changes in the steep edge of the Whitman Bench. The mudslide occurred in January 2006, as reported by a county officer and confirmed by aerial photography (see (b)). The coherence in the SBAS method was affected by temporal and spatial decorrelations, and that resulted in noisy appearance due to topographic changes ((b) and (c)).
Figure 2. (a) Difference map between 2000 SRTM and 2003 LiDAR DTM. (b) Topographic error (i.e. topographic change) estimated from SBAS method using SRTM. (c) Topographic change estimated from SBAS method using 2003 LiDAR DTM. (d) Average deformation map estimated from topography-changes corrected InSAR results. (e) Difference map between SRTM and 2013 LiDAR DSM. (f) Difference map between 2003 and 2013 LiDAR DSM. (g) Difference map between 2003 and 2013 DTM. To view this figure in colour, please see the online version of the journal.
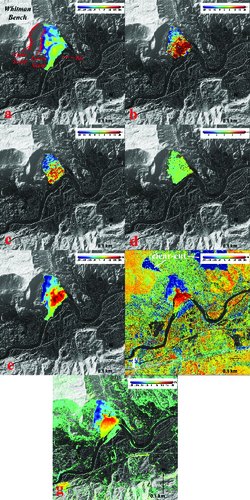
As the topography-change corrected InSAR shows that there was no deformation from early 2007 to 2011 ((d)), the InSAR result using 2013 LiDAR DEMs as the topographic correction also pointed out no deformation in the InSAR pairs. The difference maps of SRTM and 2013 LiDAR DTM ((e)), 2003 and 2013 LiDAR DSM ((f)), and 2003 and 2013 LiDAR DTM ((g)) consistently replicated the topographic change occurred by the sliding event, erosion, and timber harvest. In particular, the overall pattern of topographic changes in (e) and (g) is similar, meaning that even low-resolution (1-arcsec) SRTM can be used to detect sliding events for long-term analysis. Moreover, the pattern of topographic changes is close to those ((b) and (c)) estimated from the SBAS InSAR method. The difference of LiDAR DSMs is noisy due to spatial gaps of the DEM sources, but it is useful to identify clear-cuts by logging and the toe erosion along a river ((f)).
5. Discussion
In chronological order, there was likely a sliding event ((a)) between 2000 and 2003, which has not been documented yet. Although it is hard to specify when the landslide occurred, the downward movement (up to 15 m) happened alongside the lower scarp and deposits up to 5 m were accumulated in the toe. The aerial photography in 2002, 2004, and 2005 (“A” region of (b)) verifies the existence of the landslide event suggested by the difference of SRTM and 2003 LiDAR DEM ((a)).
The mudslide in January 2006 (figures 2(b) and (c)) was measured by topographic changes from SBAS InSAR analysis using ALOS PALSAR imagery and DEM sources and the results were further confirmed by the difference of LiDAR DEMs (figures 2(f) and (g)). Because of the existence of sliding event(s) between 2000 and 2003 ((a)), the estimates on subsidence and slumps for the 2006 mudslide event based on the 2000 SRTM DEM ((b) and (e)) are larger than those using LiDAR DEMs ((c) and (g)). In another word, the results based on the 2000 SRTM DEM captured both the 2000–2003 and the January 2006 slide events. Since the mudslide in 2006, there was not significant deformation between 2007 and 2011 ((d)) based on SBAS InSAR processing. Furthermore, regardless whether the SBAS InSAR processing utilized SRTM or 2003 LiDAR DEM for correcting topography-change related artifacts, the results indicating no significant deformations during this period (2007–2011) remained the same. When we used 2013 LiDAR DEM for InSAR processing, the phase components of interferograms did not include topography-changes or deformation occurred in 2006 or after 2006. It implies that the landslide site had been stable during SAR data acquisition period (2007–2011) as well as there was no significant topographic change in our study area between 2011 (when the last ALOS PALSAR image was acquired) and 2013 (when the LiDAR was acquired).
Our results show the unpredictability of the Oso mudslide. Before the mass movement in 2006, portion of the steep slope had already collapsed (“A” region of (b)) and deposits were being stacked. In contrast, the mountainous side had been stable without significant deformation or topographic change after 2006 till the extreme 2014 run-away event. Intense precipitation, bank erosion of the landslide toe, and increased groundwater level by clear-cut logging have been suggested as the most likely triggering mechanisms among other influential factors in the recurring Oso mudslide (Heiken Citation1997; Miller & Sias Citation1997).
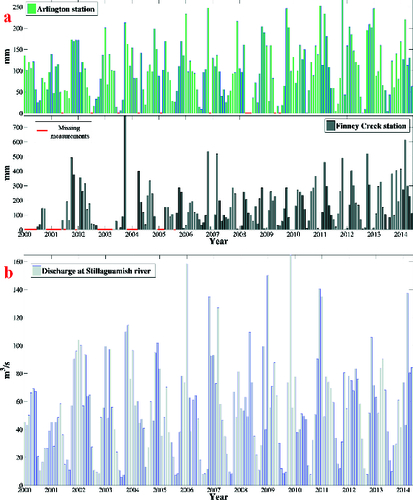
Mean monthly precipitations during wet seasons (November--March) in Arlington Station were 124.16 mm (before 2006) and 149.27 mm (after 2006) and those in Finney were 169.39 mm (before 2006) and 184.13 mm (after 2006). The mean discharges during the wet season were 67.99 m3/s (before 2006) and 80.35 m3/s (after 2006), respectively. Therefore, the precipitations during wet seasons and discharges from the Stillaguamish River were generally higher after 2006. However, this is not a clear trend of increasing precipitation or discharge during 2006--2014 (). Therefore, relatively higher precipitation and discharge during 2006–2014 facilitated the 2014 run-away event (see discussions below), but they were not the only controlling factors. Instead, long-term toe erosion and clear cutting around the mudslide site (dark blue area of the Whitman Bench in (f)) resulted in a drastic increase on the probability of landslides occurring (Heiken Citation1997).
Figure 3. (a) Monthly precipitation (unit mm) at Arlington and Finney Creek Station (white triangles in (a)). Missing precipitation data were marked by red lines. (b) Discharge (unit m3/s) at a gage in North Fork Stillaguamish River (blue triangle in (a)). To view this figure in colour, please see the online version of the journal.
Because there had not been significant land motions at Oso since 1988, logging has been one of major industries at Oso (Miller Citation1997; Miller and Sias Citation1998) without any concern about future catastrophic consequence it might cause. The logging activities had increased groundwater level as well as pore water pressure (Heiken Citation1997), and therefore resulted in an increase in the probability of landslides.
Since 1937, each Oso mudslide event had a dormant interval from 14 (1937–1951) to 21 years (1967–1988). The toe erosion for decades along a river channel lessened the beneficial buttressing effect against the slope movement from higher grounds (Eberhardt et al. Citation2007), and resulted in a collapse of hillsides before 2006. After 2006 mudslide event occurred, the accumulated slumps at the toe could have functioned as buttress against potential land motions. The deposited sediments played a significant role during dormant periods among previously occurred mudslides (Eberhardt et al. Citation2007). According to a report (Miller Citation1999), there had not been major activities along hillside from 1967 to 1988 due to a large block of slumps and push-backed river channel accompanying the 1967 mudslide. The perpetual erosion at the toe (see 2006 and 2009 aerial photography of (b) and negative values in the toe of (f)) by increased discharge since 2006 ((b)) and the elevated pore water pressure threatened the beneficial function of previously deposited sediments and potentially triggered the extreme mudslide event in March 2014.
The discharges during high water period (November--March) after 2006 were larger than those before 2006, and the intense river flow accelerated the toe erosion (“B” region in (b)). The accumulated pore water pressure exceeding water holding capacity amplified even the instability of the upper scarp. The previous landslides occurred along the lower scarp ((a)), but the increased instability of the downhill can possibly cause 2014 Oso mudslide along both the upper and lower scarps in the unprecedented scale with heavy rainfall in March 2014.
6. Conclusion
The 2014 Oso mudslide was an extreme disaster costing a lot of casualties. Our study demonstrated that exploiting SAR data and multi-source DEMs could be used for describing the behaviour of landslides including radical mass movements (topographic changes) and relatively small displacement (deformation). The topographic changes were estimated by the SBAS method from SAR data and DEMs and verified by the difference of multiple DEMs. Applying InSAR techniques to landslide study is challenging due to the steep terrain slope and the loss of coherence, but the elaborate extraction of mass movements is still possible through using multi-interferogram InSAR processing technique. Quantifying the topographic changes and the use of multi-source DEMs allowed us to estimate deformation before 2014 Oso mudslide and unknown hillside collapse before 2006 landslide. It is hard to discriminate and clarify the major cause of 2006 and 2014 Oso landslides based upon our results and available supplementary information of precipitation and discharge, because the natural hazard events like landslides, generally, are caused by the complicated combination of hydrologic triggers and human intervention. Nevertheless, based on limited information over Oso landslide, 2006 landslide is suspected as the result of decadal toe erosion, precipitation, the change of porosity, and weakened slope stability. The large settlement by 2006 landslide might provide a beneficial effect in stabilizing the steep topography of the Oso landslide, resulting insignificant deformation between 2006–2013 before the 2014 event. However, the increased discharge and relatively high precipitation since 2006 could lessen the buttressing effect of lower settlement part such that the heavy rainfall in March 2014 triggered the run-away event. However, this description is merely one hypothesis from our results to quantify Oso landslides using multi-source DEMs and InSAR. Future studies using in situ measurements of soil porosity and potential influential factors of the stratigraphy and groundwater level will reveal more sophisticated characteristics of previous landslides and 2014 Oso mudslide.
Disclosure statement
No potential conflict of interest was reported by the authors.
Correction Statement
This article has been corrected with minor changes. These changes do not impact the academic content of the article.
Additional information
Funding
References
- Anderson MG , Holcombe E . 2013. Community-based landslide risk reduction: managing disasters in small steps. Washington ( DC ): World Bank.
- Bardi F , Frodella W , Ciampalini A , Bianchini S , Del Ventisette C , Gigli G , Fanti R , Moretti S , Basile G , Casagli N . 2014. Integration between ground based and satellite SAR data in landslide mapping: the San Fratello case study. Geomorphology. 223:45–60.
- Berardino P , Fornaro G , Lanari R , Sansosti E . 2002. A new algorithm for surface deformation monitoring based on small baseline differential SAR interferograms. IEEE Trans Geosci Remote Sensing. 40:2375–2383.
- Carnec CD , Massonnet D , King C . 1996. Two examples of the use of SAR interferometry on displacement fields of small spatial extent. Geophys Res Lett. 23:3579–3582.
- Casu F , Manzo M , Lanari R . 2006. A quantitative assessment of the SBAS algorithm performance for surface deformation retrieval. Remote Sensing Environ. 102(3–4):195–210.
- Colesanti C , Ferretti A , Locatelli R , Novali F , Savio G . 2003. Permanent scatterers: precision assessment and multi-platform analysis. Toulouse : IGARSS; p. 1–3.
- Colesanti C , Ferretti A , Prati C . 2003. Monitoring landslides and tectonic motions with the permanent scatterers technique. Eng Geol. 68:3–14.
- Colesanti C , Wasowski J . 2006. Investigating landslides with space-borne synthetic aperture radar (SAR) interferometry. Eng Geol. 88:173–199.
- Eberhardt E , Bonzanigo L , Loew S . 2007. Long-term investigation of a deep-seated creeping landslide in crystalline rock. Part II. Mitigation measures and numerical modeling of deep drainage at Campo Vallemaggia. Can Geotech J. 44:1181–1199.
- Farina P , Colombo D , Fumagalli A , Marks F , Moretti S . 2006. Permanent scatterers for landslide investigations: outcomes from the ERS-SLAM project. Eng Geol. 88:200–217.
- Ferretti A , Prati C , Rocca F . 2000. Nonlinear subsidence rate estimation using permanent scatterers in differential SAR interferometry. IEEE Trans Geosci Remote Sensing. 38(5):2202–2212.
- Ferretti A , Prati C , Rocca F . 2001. Permanent scatterers in SAR interferometry. IEEE Trans Geosci Remote Sensing. 39(1):8–20.
- Fruneau B , Achache J , Delacourt C . 1996. Observation and modeling of the Saint–E ́tienne–de–Tin ́ee landslide using SAR interferometry. Tectonophysics. 265:181–190.
- George DL , Iverson RM . 2014. A depth-averaged debris-flow model that includes the effects of evolving dilatancy. II. Numerical predictions and experimental tests. Proc Royal Soc. A470:20130820. Available from:
- Giannecchini R , Galanti Y , Avanzi GD . 2012. Critical rainfall thresholds for triggering shallow landslides in the Serchio River Valley (Tuscany, Italy). Nat Hazards Earth Syst Sci. 12:829–842.
- Greif V , Vlcko J . 2012. Monitoring of post-failure landslide deformation by the PS-InSAR technique at Lubietova in Central Slovakia. Environ Earth Sci. 66(6):1585–1595.
- Heiken D. 1997. Landslides and clear cuts -- what does the science really say [Internet]. Umpqua Watersheds, Inc; [cited 2014, Oct 7]. Available from: http://www.umpqua-watersheds.org/archive/local/landslides/slide_studies.html
- Highland LM , Bobrowsky P . 2008. The landslide handbook – a guide to understanding landslides. Reston (VA): U.S. Geological Survey. U.S. Geological Survey Circular 1325; p. 129.
- Lanari R , Mora O , Manunta M , Mallorquí JJ , Berardino P , Sansosti E . 2004. A small baseline approach for investigating deformation on full resolution differential SAR interferograms. IEEE Trans Geosci Remote Sensing. 42(7):1377–1386.
- Lu Z , Dzurisin D . 2014. InSAR imaging of Aleutian volcanoes: monitoring a volcanic arc from space. Springer Praxis Books, Geophysical Sciences. New York (NY): Springer; p. 388.
- Lu Z , Dzurisin D , Jung HS , Zhang JX , Zhang YH . 2010. Radar image and data fusion for natural hazards characterization. Int J Image Data Fusion. 1:217–242.
- Miller DJ. 1999. Hazel/gold basin landslides: geomorphic review draft report. Seattle (WA): M2 Environmental Services.
- Miller DJ , Sias J . 1997. Environmental factors affecting the Hazel landslide. Seattle (WA): M2 Environmental Services.
- Miller DJ , Sias J . 1998. Deciphering large landslides: linking hydrological, groundwater and slope stability models through GIS. Hydrological Processes. 12:923–941.
- Samsonov S. 2010. Topographic correction for ALOS PALSAR interferometry. IEEE Trans Geosci Remote Sensing. 48(7):3020–3027.
- Tofani V , Raspini F , Catani F , Casagli N . 2013. Persistent scatterer interferometry (PSI) technique for landslide characterization and monitoring. Remote Sensing. 5(3):1045–1065.
- [USGS] US Geological Survey . 2005. Landslide hazards – a national threat. Reston (VA): Geological Survey. U.S. Geological Survey Fact Sheet 2005-3156; p. 1–2.
- Varnes DJ. 1978. Slope movements: types and processes. In: Schuster RL, Krizek RJ, editors. Special Report 176: Landslides: Analysis and Control. Washington (DC): National Academy of Science, Transportation Research Board.
- Zhao CY , Lu Z , Zhang Q , de la Fuente J . 2012. Large-area landslide detection and monitoring with ALOS/PALSAR imagery data over Northern California and Southern Oregon, USA. Remote Sensing Environ. 124:348–359.