
Abstract
This is one of the first studies that has been conducted in Mongolia on the distribution of lightning incidents. The study covers a 10-year period from 2004 to 2013. The country records a human death rate of 15.4 deaths per 10 million people per year, which is much higher than that of many countries with similar isokeraunic level. The reason may be the low-grown vegetation observed in most rural areas of Mongolia, a surface topography, typical to steppe climate. We suggest modifications to Gomes–Kadir equation for such countries, as it predicts a much lower annual death rate for Mongolia. The lightning incidents spread over the period from May to August with the peak of the number of incidents occurring in July. The worst lightning affected region in the country is the central part. Compared with impacts of other convective disasters such as squalls, thunderstorms and hail, lightning stands as the second highest in the number of incidents, human deaths and animal deaths. Economic losses due to lightning is only about 1% of the total losses due to the four extreme weather phenomena. However, unless precautionary measures are not promoted among the public, this figure of losses may significantly increase with time as the country is undergoing rapid industrialization at present.
1. Introduction
A careful survey on lightning-related research publications may reveal that the lightning phenomenon is basically studied with the view of investigating its impact on engineering systems or analysis of the properties and characteristics of it as a standalone physical phenomenon. Such trends are also evident as per the contents of many international conferences on lightning phenomenon (such as International Conference on Lightning Protection). However, in the recent years, there has been a surge of research reports which have addressed the impacts of lightning on living beings and the dependence of such impacts on meteorological, geographical and sociological factors (Gomes & Kadir Citation2011; Gomes Citation2012; Lubasi et al. Citation2012; Mary & Gomes Citation2012, Citation2014; Mulder et al. Citation2012; Peppas et al. Citation2012). Many of these studies emphasized the need for investigating the injuries and economical losses due to lightning phenomena in a global perspective rather than repeating the studies only in developed countries where the significance of such renewed information has diminished due to the declination of lightning accidents during the last century (Coates et al. Citation1993; Curran et al. Citation2000; Holle & López, Citation2003; Holle et al. Citation2005). Such reduction of casualties has been contributed by several factors, such as promotion of safety awareness, ready availability of structures with protection, lightning detection and warning systems, high literacy rate and urbanization, etc. (López & Holle Citation1998; Gomes & Kadir Citation2011). In this respect, a majority of developing countries are most often lagging behind the developed countries by 50–60 years as per the studies done in Uganda (Mary & Gomes Citation2012, Citation2014); Zambia, (Lubasi et al. Citation2012); Bangladesh and Sri Lanka (Gomes et al. Citation2006), etc.
The development of lightning safety models and protection guidelines essentially needs a clear understanding of the lightning and related accident environment of a given region. Usually, in many countries, such awareness programmes are integrated into the national-level natural disaster management plan. To be considered as a part of such national plan, any given type of natural disaster should have a significant impact on the general public and/or economy of the country. For example, in a country such as Malaysia, there is no need for including a hailstorm or snowstorm protection scheme into the disaster prevention plan as such phenomena are extremely rare in the country. Therefore, it is an essential requirement for a country to have quantitative information regarding where it stands with respect to a particular natural hazard, before investing on disaster prevention programmes.
In some cases, natural hazards with apparently low probability of occurrence in a country may have large impact on society and/or economy in some parts of the country. One good example is the lightning accidents in Saudi Arabia. In many parts of Saudi Arabia, the lightning ground flash density is less than 1 km−2 yr−1 (isokeraunic level is less than 10), which is par below the world average (NASA Citation2004). A detailed study on the lightning environment in Saudi Arabia by Shwehdi (Citation2006) shows that lightning-related power outages in southwestern part of Saudi Arabia is much higher than that one would expect in a country with such low isokeraunic level. The reason seems to be the very high lightning density in this particular region (compared to that in many other parts of the country) and the relatively high exposure of power transmission network to lightning strikes due to the topographical features in the region. Such information prompted Saudi Electric Company to adopt rigorous protection measures to minimize such failures in the southwestern part.
This study has been done in Mongolia in the above backdrop. So far no research has been conducted in Mongolia with respect to lightning casualties; human, animal or property. However, as per some news reports and societal observations made by the authors for the last few years, the number of lightning accident occurrence density in Mongolia is not insignificant, despite the country is well known to have one of the lowest population densities in the world; 1.8 km−2 in 2011 (UN Department of Economic and Social Affairs, Population Division, Population Estimates and Projections Section Citation2012). However, unfortunately the lack of published information and data analysis on lightning-related incidents (and their stand among the other atmospheric extreme events), prevents Mongolia from developing their own disaster prevention scheme for lightning. Such lightning accident statistics are not available for many other countries in Central Asia as well. In order to develop lightning safety and protection modules for safeguarding the public and property, statistics and information of nature and outcome of lightning accidents are essentially required. This study has been conducted to fulfil this void. Apart from providing lightning accident record for 10 years (from 2004 to 2013), we also present and discuss the damage records due to other extreme atmospheric events during the same period to establish an opinion on the significance of taking lightning incidents into account in the development of safety policies against natural hazards.
2. Facts of Mongolia
Mongolia is a landlocked country in Central Asia bordering Russia in North and China in other directions (). The country lies between latitudes 41° N and 52° N and longitudes 87° E and 120° E and has land area of 1,564,116 km2. Being a continental land block, Mongolia has an average altitude of 1500 m above mean sea level; starting from high mountains in the north and ending up with Gobi desert in the south which is located at much lower altitudes. The country can basically be divided into four zones; western, central, eastern and southern; for the convenience of analysis. The country has a population of approximately 2.8 million in 2012.
Figure 1. Map of Mongolia that shows the parts of the country and bordering countries. Locations of weather stations (where the data has been collected) are also indicated in the map.
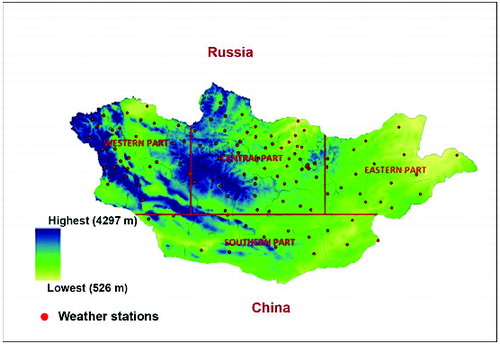
As per the data extracted from the archives of the National Agency of Meteorology and Environmental Monitoring (NAMEM), the long winter in the country is characterized by extremely low temperatures followed by a short hot summer. Winter starts in November and continues until late March. Spring-like climate could be observed from March to May which is followed by summer and autumn in June–August and September–October, respectively. The average summer temperature is about +20 °C and average winter temperature is –20 °C. The average rainfall is 200–220 mm. Precipitation is highest in the north, with annual rainfall averages 200–350 mm, and lowest in the south, with 100–200 mm. The country experiences about 250 sunny days a year on average; days with clear cloudless skies.
Mongolia is characterized by a large variation of climate both in space and time of the year. The topography varies both from north to south and from east to west. The country is covered by mountains in the north and west, which blocks moist winds from entering the country, thus making the eastern and central parts experiencing steppe climate. A steppe climate is found in the mid continental regions where high mountains block wet air streams through oceans or tropical climates from reaching the covered slopes. The lack of precipitation prevents large trees from growing, resulting wide spans of grasslands or low-growing bushes having extensively spread root system. Such low-grown mountain slopes and vast flat land exposes even objects of average heights, such as single story houses, tents, isolated trees with medium heights and even human beings and animals to lightning flashes that reach ground.
3. Methodology
The accident records and relevant data analyzed in this paper have been collected by Institute of Meteorology, Hydrology and Environment (IMHE) of Mongolia through various information sources during the 10-year period 2004–2013. The data have been cross checked through several sources before taking into account for the analysis. The meteorological data have been collected through 118 country-wide meteorological stations, which have been operated by the NAMEM for the last many decades. The data analyzed in this study is pertinent to the period that coincides with the period of lightning casualty data (2004–2013). Locations of meteorological stations where the data has been collected are given in .
For the data analysis presented in this paper, the information regarding four extreme atmospheric phenomena, described below, have been collected from the sources mentioned.
3.1 Squall
A squall is defined as a drastic increment of wind speed in the presence of heavy precipitation or snow storms where the wind persists over a short period of time with fluctuations above 8 ms−1 with maximum reaching at least 11 ms−1 (Hamilton & Archibald, Citation1945). In Mongolia, the squalls are observed with much higher gusts during an event which may last for 1–5 minutes. They usually occur in the central part of Mongolia where strong mid-level height falls or mid-level tropospheric cooling that triggers strong localized upward motions at the leading edge of the region of cooling, which then enhances local downward motions just in its wake (Fang Citation1997; Hu & Guang Citation1996). Data on squalls presented in this paper have been gathered from meteorological databases maintained by the NAMEM. Squalls may cause damage due to mechanical failures of structures such as buildings, bridges, masts, etc. and uprooting of vegetation. Such damage may cause human and animal injuries due to the impact of falling debris and structural components.
3.2 Thunderstorms
A thunderstorm is defined as the presence of a cumulonimbus cloud, which is identified by the hearing of thunder or/and visual observation of lightning. In this case, thunderstorm identification data have been collected by 118 meteorological centres. As the possible multiple counting of some thunderstorm by more than one centre has not been filtered off, the numbers given may be a higher estimation. Thunderstorm-related losses are usually due to flash floods and high wind. Impacts of lightning and hail which may be related with thunderstorms have been excluded from this database and treated separately under lightning and hail damage.
3.3 Hail
Hail is defined as a form of solid precipitation in the form of layered, irregular and clumped ice that is usually accompanied with thunderstorm under cold weather. In Mongolia, size of such hailstones may vary in a wide range; from 5 mm to as high as 15 cm. An incident is recorded as a hail damage if the disaster is mainly due to the bombardment of hailstones, even if it happens during a thunderstorm.
3.4 Lightning
Transfer of electrical energy from cloud to ground in the form of an arc. This study does not analyze lightning occurrence or distribution data (except adopting approximate data from satellite observations from NASA databases for qualitative analysis). Instead, we analyze lightning incident data and information (injuries, deaths and property damage). Hence, we are unable to confirm whether the accident is due to negative cloud-to-ground, positive cloud-to-ground or cloud lightning. However, the chances of damage or injuries due to cloud lightning is almost zero due to the nature of location of almost all incidents. The data have been collected by Meteorology Department Mongolia.
4. Results and discussion
Mongolia is a country with moderate lightning occurrence density. As per the satellite data based on world lightning map issued by NASA (NASA Citation2004), the average total lightning flash density in Mongolia varies in the rage of 0.4–8 flashes km−2 yr−1, depends on the region of the country. However, as it was shown by Gomes and Kadir (Citation2011), lightning occurrence density (or isokeraunic level) may not be the sole parameter that determines the lightning threat level to living beings and properties. There may be many other parameters such as surface topology (both geographical features and vegetation), socio-economic factors, literacy rate, etc. (Gomes & Kadir Citation2011; Mary & Gomes Citation2014). We move to the presentation of our data analysis in the above backdrop.
depicts the atmospheric weather event-related incidents, human deaths and animal deaths. During the period covered by this study, there were 43 human deaths which leads to an average of 4.3 deaths per year. Although the number of deaths per year gives an opinion on the severity of lightning in a given country, the real socio-economic impact of such parameter becomes meaningful only if the figure is given with respect to the population. Hence, we define a new parameter, “the number of deaths per 10 million of population per year”, which is the normalized figure of annual deaths to 10 million people. With respect to this definition, the annual death rate in Mongolia is equal to 15.4 deaths per 10 million per year (dptm yr−1). In , we normalized the lightning-related deaths reported in various countries to dptm yr−1. As it is depicted by the information in , the death figure in Mongolia is much larger than that of countries in Europe, North America and Australia. It is even close to four times the dptm yr−1 in Malaysia, a country with one of the highest isokeraunic levels in the world (over 250 thunder days per year). The death figure in Mongolia is somewhat lower than few other countries with the highest lightning occurrence density in the world. Apart from Sri Lanka and Singapore, many of these countries have very low literacy level (TWF Citation2013). However, note that the figures given for Zimbabwe and Singapore are pertinent to the databases collected in the 1970s. The figures, by now, may be reduced due to the increment of literacy rate and urbanization (Gomes & Kadir Citation2011). It should also be noted that in this study we could not gather reliable information on the number of injured people or animal (those who did not succumb to their injuries). An injured commercial animal may be as invaluable as a dead animal. Primary and secondary injuries to human beings due to lightning may vary from a minor burn to third degree burns and from a temporary shock to life-long paralysis (Cooper & Andrews Citation1995). As per the empirical relations developed in the literature, the number of cases of injuries in a given region may be 10 times more than the death toll (Holle & López Citation2003). Thus, the number of human victims that survive with injuries after their encounters with lightning may be in the order of 150 dptm yr−1 in Mongolia. This observation gives a clear message that Mongolia needs proper national plan of curbing the lightning accidents in the country.
Table 1. Number and percentage of incidents, human deaths and animal deaths due to atmospheric extreme events. Percentages are given to two significant figures.
Table 2. Number of deaths reported in several countries per year normalized to 10 million population.
The reason for the higher number of human casualties with respect to the population in Mongolia, despite its moderately low isokeraunic level can be explained as due to the surface topography of the country and the open field agriculture base of the population. A vast majority of the landscape in Mongolia are grasslands or lands with low-grown vegetation typical to areas with steppe climate. In such cases, most often, the prime target of a downward stepped leader can be a human being or a man-made structure such as a domestic installation. Almost 100% of the human casualties have been reported while the victims were either in the open fields or inside remote isolated buildings. The large number of livestock casualties may also be due to the same reason.
To justify our reasoning, we apply the Gomes–Kadir equation (Gomes & Kadir Citation2011), which has been validated against data pertinent to USA and elsewhere (Cardoso et al. Citation2014; Nicora et al. Citation2013).
Gomes–Kadir equation, given below, is an empirical formula to estimate the annual lightning related deaths (σ) in a given country.where Ng: lightning flash density in km−2 year−1
DF: demographic factor in km−2
A: area of the region in km2.
where PD is the population density given in km−2 and UF is the urban factor given as a fraction.
UF = Urban population/total population.
For Mongolia (population-related data pertinent to 2010),
UF = 0.575 (UN Department of Economic and Social Affairs, Population Division, Population Estimates and Projections Section Citation2012)
DF = 1.8/0. 575
= 3.13
A = 1.56 × 10⁶ km−2
Ng = 6 yr−1 (NASA Citation2004)
σ = 0.8 deaths per year.
This figure is much lower than the figure 4.3 deaths per year, obtained in the data analysis of this study. The major reason for this difference, in our opinion, is the non-consideration of surface topography in the development of Gomes–Kadir equation. The equation and it's validations may well satisfy most of the regions in the world with high-grown vegetation or tall bushes that one can find in many rural areas. However, for a country such as Mongolia with steppe climate, the equation needs modification; a term should be included to take the surface topography in populated areas into account.
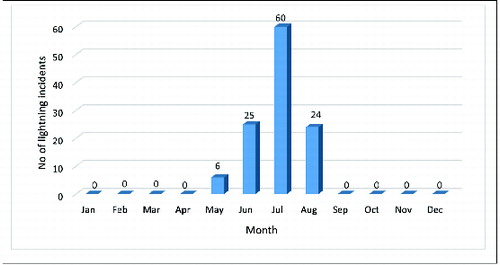
The variation of the number of lightning incidents over the period 2003–2014 () and the pattern of rainfall during the same period () show a close correlation (both are incremental) which is expected. Similarly, the variation of mean monthly rainfall pattern () and accumulated monthly thunderstorm occurrence pattern () for the 10-year period show remarkable similarity with the accumulated monthly variation of lightning incidents () over the same period. All the three curves show apparently bell-shaped distribution with July as the month of peak occurrence. Lightning incident distribution spans over May–August period with the peak in July stands well above the rest. Such distribution makes the design, preparation and execution of lightning awareness promotion campaigns easier. In countries with such distribution, the awareness promotion by various means (promotion through electronics, audio-visual and printed media, school and community programs, government warnings etc.) could be started in the mid-April and intensify during the month of July.
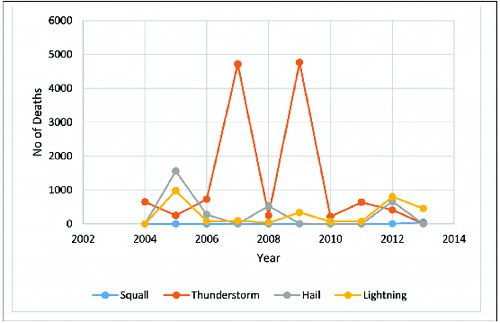
Figure 2. Variation of atmospheric extreme event-related incidents (2004–2013).
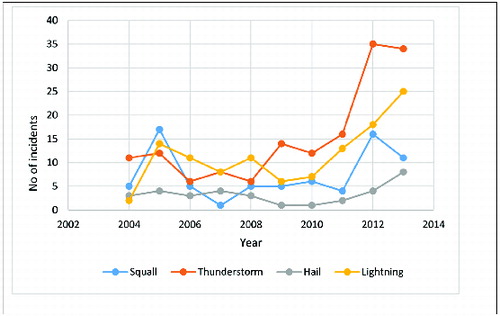
Figure 3. Mean annual precipitation per month in Mongolia over the period 2004–2013.
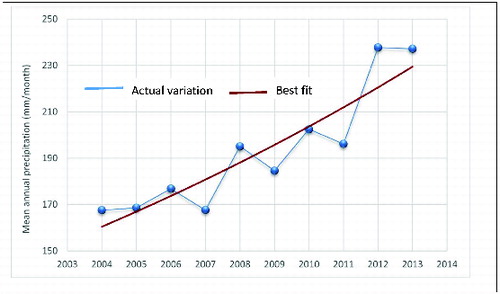
Figure 4. Mean monthly precipitation during the 10-year period 2004–2013.
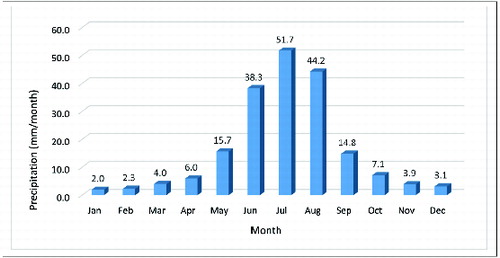
Figure 5. Accumulated monthly thunderstorm occurrences during the 10-year period 2004–2013.
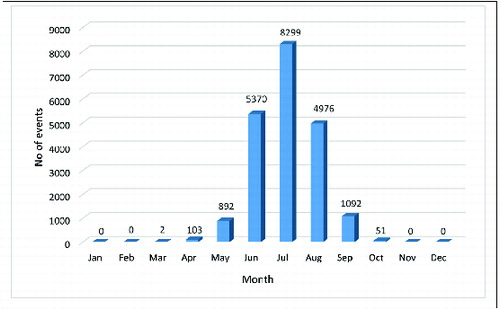
Figure 6. Accumulated monthly variation of lightning incidents during the 10-year period 2004–2013.
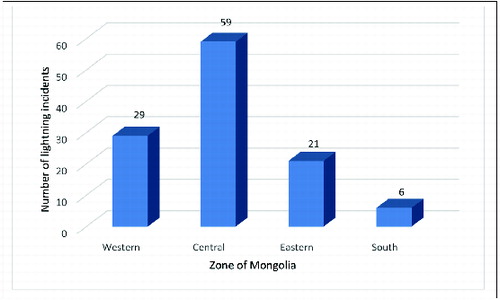
The highest number of lightning incidents are recorded in the central part of the country (). This may most probably be due to the high population density in the region and the steppe climate that leads to highly exposed landscapes with low grown bushes or grasslands. Western region also records somewhat high number of incidents (49% of that in the central region). Eastern region has recorded 21 lightning incidents during the recorded period. Southern parts of the country have rather low numbers of lightning incidents. This may be due to the low rainfall and thunderstorm density distribution in this part of the country.
Figure 7. Number of lightning incidents in each zone of Mongolia during the 10-year period 2004–2013
shows the occurrence statistics of the incidents, human deaths and animal deaths due to the four types of atmospheric extreme events discussed in the study. In the context of this paper, animals are referred to the livestock (commercial animals); cattle, horses, sheep and goats. The distribution shows that the most destructive phenomenon is the thunderstorm which usually affect the geo-surface due to flash floods. In both cases of human deaths and animal deaths, thunderstorms accounts for more than 50% of the casualties. Lightning comes in the second position with more than three times the number of incidents and human deaths pertinent to the third placed phenomenon, hail. In the case of animal deaths, lightning is in par with the casualties due to hail. In all the three categories, lightning-related statistics are well above that due to squalls. This re-justifies the significance of addressing lightning-related disasters as an integrated part of a natural disaster management programme.
The number of incidents pertinent to all four phenomena apparently shows slightly increasing trends over the 10 years (). This may be coincident with the incremental trend of precipitation () as it was discussed earlier with regard to lightning. and depicts the atmospheric severe event-related incidents human deaths and animal deaths. It should be noted that in the case of thunderstorm-related accidents; the human deaths in 2009 and the animal deaths in 2007 and 2009, have vastly changed the accumulated statistics of two respective death tolls. Apart from these exceptional years, the respective casualties due to lightning over the 10-year period is not very different from those related to thunderstorms.
Figure 8. Variation of annual human deaths due to atmospheric severe events during the 10-year period 2004–2013.
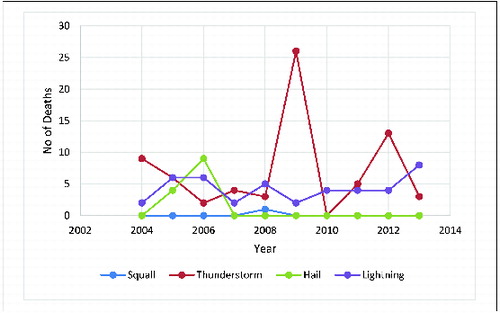
Figure 9. Variation of annual animal deaths due to atmospheric severe events during the 10-year period 2004–2013.
depicts the annual financial losses due to the damage caused by the four atmospheric extreme cases. The statistics are crude estimations made by the IMHE based on inspections by regional authorities. In this case, thunderstorms contributes to nearly 74% of loses, squalls and hail accounts for nearly 12.5% each and lightning accounts only for 1%. The loss due to lightning for the 10-year period is about USD 164,000 which is in the order of USD 16,400 per year. Although the real cost may be higher than this estimation due to unreported damage and indirect losses, the figure is par below that in most developed countries where the occurrence density of human casualties may be much lower than that in Mongolia. For example, in Canada where the lightning-related human death rate is 3 dptm yr−1, the annual lightning-related losses are in the tunes of USD 600 to 1000 million (Mills et al. Citation2010). The low number of financial losses due to lightning is understandable as the country is far from being industrialized and the national electric power network is not having a total coverage of the country. In many countries, the heavy lightning-related losses are due to power outages and equipment damage in the industrial and commercial sectors rather than structural damage. In USA, the annual loss due to lightning-related power outages exceeds USD 1 billion, which is about 30% of the total losses in the power industry (IEEE Standards Citation1997). As the countries are being industrialized and the electric power grid spreads over the entire region, exposure to lightning effects and vulnerability to lightning threats (level of risk of failure) increases. As Mongolia is in a rapidly industrializing phase at present, it is the high time for the authorities to pay special attention to the precautions against lightning hazards. It should also be noted that there may be exceptional years where the loss due to lightning could be extraordinarily high. Similar case could be seen with respect to thunderstorms in year 2012 () where the losses stands way beyond the rest of the years.
Table 3. Losses due to atmospheric extreme events. Figures are given in 1000 USD.
A majority of the lightning-related losses in Mongolia are due to death of commercial animals. As the livestock industry is popular source of income in the country, both at mass scale and domestic level, the loss of such animals has a significant impact on the livelihood of people. It is recommended that the government encourage public to adopt affordable protection measures to prevent livestock being affected by lightning. Such low cost techniques are described in Gomes (Citation2012).
The location of human casualties is basically the exposed grasslands or agricultural landscapes where a standing human body may be a prime target due to its protruding height over the relatively flat area. As these landscapes are very large, the possibility of accessing a sturdy building in the event of an approaching thunderstorm may be quite remote, the public should be guided for adopting lightning safety position (Gomes Citation2008) in the event of overcast conditions.
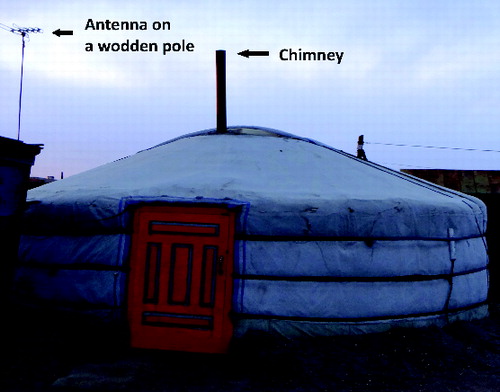
There are several casualties reported due to the lightning strikes to traditional Mongolian houses termed “Ger” or “Yurt” mostly used by nomadic tribes in Central Asia. In the construction of a ger, layers of felt are draped mainly over the wooden frame, and the entire structure except for the space for door is covered with white cotton. The materials are hold together by several rounds of ropes. Usually the extremely cold winter in Mongolia yields several additional layers of felt and cotton. A metal pipe or wooden hollow cylinder protrudes above the roof to act as the chimney for smoke emitted by the stove. Some modern ger are equipped with television antenna arrangement mounted on a tall metal or wooden mast that is supported at the vertical edge of the ger structure. shows a typical ger which are usually built in isolation in large bare landscapes. Such housing structures have a high possibility of being struck by lightning, as the chimney or other protrusions (of the ger) may send the answering leader to meet the downward-progressing stepped leader, before any other low-lying object in the surrounding could do so. In the event of such a strike, total destruction of the structure is very possible due to the highly inflammable constituent of the house. The unprotected structure may give rise to side flashers to the occupants and bystanders and also create lethal step potentials. It is highly recommended that local authorities guide these nomadic communities to adopt low-cost structural protection systems that minimize risk of human casualties (Gomes et al. Citation2012).
Figure 10. Ger, a nomadic house in a remote area in Mongolia. Such isolated structures made of highly inflammable material, without any lightning protection measures may invite death and destruction in the event of a thunderstorm.
5. Conclusions
It has been shown that lightning is a significant threat in Mongolia, especially with respect to human and animal casualties. The outcome of this 10-year data analysis (2004–2013) shows that the country has a high rate of human deaths, 15.4 dptm yr−1, which is an order greater than that in many developed countries in Europe, North America and Australia. The monthly distribution of lightning incidents closely follows the precipitation pattern and thunderstorm occurrence pattern in Mongolia over the 12 months of the year. Lightning incidents spread over the period from May to August with the peak in July. The variation of the number of lightning incident has an increasing trend over the 10 years which is analogous to the variation of precipitation during the same period.
The monthly distribution of lightning incidents closely follow the precipitation pattern and thunderstorm occurrence pattern in Mongolia over the 12 months of the year. Lightning incidents spread over the period from May to August with the peak in July. The variation of the number of lightning incident have an increasing trend over the 10 years which is analogous to the variation of precipitation during the same period.
Maximum number of lightning incidents are reported in the central part of the country and the minimum in southern parts. Further studies should be conducted to confirm the exact reason/s for such observations.
Compared with other atmospheric extreme events, lightning has a significant impact on human and animal deaths. It is second in this regard only to thunderstorms that result flash floods. If it is not for few exceptional years, lightning may have somewhat similar impact on the human and animal safety as that due to thunderstorms. In the case of economic losses, the impact of lightning is insignificant compared to that of the other three types of atmospheric extreme events. However, as the country is in a rapid process of industrialization and the national power grid may be spread over the country soon, the impact of lightning on the economy may also be felt significantly if proper protection measures are not adopted at this stage.
In designing nationwide programmes for lightning safety and protection, it is important to consider lightning occurrence pattern, types of lightning losses and regional variation of lightning incidents. It should be noted that most of the rural housing structures in Mongolia are made to serve the purpose of securing warmth during the harsh winter; thus, such structures become vulnerable to fire, side flashes and step potentials in the event of a lightning strike. The housing structures run a high risk of being the target for the attachment of stepped leader due to their protruding nature over a vast exposed area. During the investigation of this study, there were several accidents to the occupants and bystanders of these structures have been observed in several parts of the country.
Acknowledgements
The authors would like to acknowledge the facilities and support rendered by the NAMEM, IMHE of Mongolia and the Centre for Electromagnetic and Lightning Protection, University Putra Malaysia in making this project a success.
Disclosure statement
No potential conflict of interest was reported by the authors.
References
- Cardoso I, Pinto O, Pinto IRCA, Holle R. 2014. Lightning casualty demographics in Brazil and their implications for safety rules. Atmospheric Res. 135–136:374–379.
- Coates L, Blong R, Siciliano F. 1993. Lightning fatalities in Australia, 1824–1993. Nat Hazards. 8:217–233.
- Cooper MA, Andrews CJ. 1995. Lightning injuries. In: Auerbach P, editor. Wilderness medicine: management of wilderness and environmental emergencies. 3rd ed. St Louis, MO: Mosby; p. 261–290.
- Cooper MA, Andrews CJ, Holle RL. 2007. Lightning injuries. In: Auerbach PS, editor. Wilderness medicine. 5th ed. St Louis, MO: Mosby; p. 67–108.
- Curran EB, Holle RL, López RE. 2000. Lightning casualties and damages in the United States from 1959 to 1994. J Climate. 13:3448–3464.
- Elsom DM. 2001. Deaths and injuries caused by lightning in the United Kingdom: analyses of two databases analyses of two databases. Atmospheric Res. 56:325–334.
- Eriksson A, Örnehult L. 1988. Death by lightning. Am J Forensic Med Pathol. 9(4):295–300.
- Fang ZY. 1997. Dust storms in China. Beijing: Meteor Publisher. Chinese.
- Gomes C. 2008. Handbook on lightning safety. Colombo: South Asian Technology Research and Information Centre.
- Gomes C. 2012. Lightning safety of animals. Int J Biometeorol. 56:1011–1023.
- Gomes C, Ab. Kadir MZA. 2011. A Theoretical approach to estimate the annual lightning hazards on human beings. Atmospheric Res. 101:719–725.
- Gomes C, Ab Kadir MZA, Cooper MA. 2012. Lightning safety scheme for sheltering structures in low-income societies and problematic environments. In: ICLP Committee, editor. 31st International Conference on Lightning Protection-2012; 2012 Sep 2–7; Vienna: IEEE.
- Gomes C, Ahmed M, Abeysinghe KR, Hussain F. 2006. Lightning accidents and awareness in South Asia: experience in Sri Lanka and Bangladesh. In: ICLP Committee, editor. Proceedings of the 28th International Conference on Lightning Protection (ICLP); 2006 Sep 18–22; Kanasawa: ICLP.
- Gourbière E. 1998. Lightning injury to human beings in France. In: ICLP Committee, editor. 24th International Conference on Lightning Protection, Staffordshire University; 1998 Sep 14–18; Birmingham: Staffordshire University.
- Hamilton RA, Archibald JN. 1945. Meteorology of Nigeria and adjacent territory. Quarterly J Royal Meteorol Soc. 71:231–265.
- Holle RL, López RE. 2003. A comparison of current lightning death rates in the U.S. with other locations and times. In: ICOLSE Committee, editor. International Conference on Lightning and Static Electricity; 2003 Sep 16–18; Blackpool: Royal Aeronautical Society.
- Holle RL, López RE, Navarro BC. 2005. Deaths, injuries, and damages from lightning in the United States in the 1890s in comparison with the 1990s. J Appl Meteorol. 44:1563–1573.
- Hu YQ, Guang TY. 1996. Mechanism Analysis on development of strong dust storm and formation of dry squall line and black storm. Plateau Meteorol. 15:178–185. Chinese.
- IEEE Standards. 1997. IEEE design guide for improving the lightning performance of transmission lines. New York, NY: IEEE Power & Energy Society.
- Kompacher M, Kindermann G, Pack S. 2012. Fire losses and human accidents caused by lightning – an Austrian overview. In: ICLP Committee, editor. 31st International Conference on Lightning Protection-2012; 2012 Sep 2–7; Vienna: IEEE.
- López RE, Holle RL. 1998. Changes in the number of lightning deaths in the United States during the twentieth century. J Climate. 11:2070–2077.
- Lubasi FC, Gomes C, Ab Kadir MZA, Cooper MA. 2012. Lightning related injuries and property damage in Zambia. In: ICLP Committee, editor. 31st International Conference on Lightning Protection-2012; 2012 Sep 2–7; Vienna: IEEE.
- Mary AK, Gomes C. 2012. Lightning accidents in Uganda. In: ICLP Committee, editor. 31st International Conference on Lightning Protection-2012; 2012 Sep 2–7; Vienna: IEEE.
- Mary AK, Gomes C. 2014. Lightning safety of under-privileged communities around Lake Victoria, Geomatics. Nat Hazards Risk. Available from: http://dx.doi.org/10.1080/19475705.2014.922506
- Mills B, Unrau D, Parkinson C, Jones B, Yessis J, Spring K. 2006. Striking back: an assessment of lightning-related fatality and injury risk in Canada. Gatineau: Environment Canada.
- Mills B, Unrau D, Pentelow L, Spring K. 2010. Assessment of lightning-related damage and disruption in Canada. Nat Hazards. 52(2):481–499.
- Mulder MB, Msalu L, Caro T, Salerno J. 2012. Remarkable rates of lightning Strike mortality in Malawi. PLoS One. 7:1–4. doi:10.1371/journal.pone.0029281
- NASA. 2004. Available from: http://www.nasa.gov/centers/goddard/news/topstory/2004/0621lightning_prt.htm
- Nicora MG, Quel EJ, Burgesser RE, Ávila EE. 2013. Electric atmospheric activity in Argentina, a study for estimating the annual death rate by lightning. In: SIPDA Committee, editor. 2013 International Symposium on Lightning Protection, SIPDA 20136729213; 2013 Oct 7–11; Belo Horizonte: IEEE.
- Pakiam JE, Chao TC, Chia J. 1981. Lightning fatalities in Singapore. Meteorol Magazine. 110:175–187.
- Peppas GD, Bekas KI, Naxakis IA, Pyrgioti EC, Charalampakos VP. 2012. Analysis of Lightning Impacts in Greece. In: ICLP Committee, editor. 31st International Conference on Lightning Protection-2012; 2012 Sep 2–7; Vienna: IEEE.
- Shwehdi MH. 2006. Reliable maps of lightning thunderstorms for Saudi Arabia. IEEE Trans Power Delivery. 21(3):1571–1577.
- TWF (The World Factbook). 2013. Central intelligence agency. Washington, DC: CIA.
- Virenque C, Laguerre J. 1976. Les accidents de la fulguration [Accident fulguration]. Anesthesie Analgesie Réanimation. 33:775–784.
- UN Department of Economic and Social Affairs, Population Division, Population Estimates and Projections Section. 2012. World Population Prospects: the 2012 Revision.
- UN Department of Economic and Social Affairs, Population Division, Population Estimates and Projections Section. 2012. World Urbanization Prospects: the 2011 Revision.