
Abstract
A method to improve the detection of seismo-magnetic signals is presented herein. Eight events registered for periods of 24 hours with seismic activity were analyzed and compared with non-seismic periods of the same duration. The distance between the earthquakes (EQs) and the ultra-low frequency detector is of ρ = (1.8) 100.45M, where M is the magnitude of the EQ reported by the Seismological National Service of Mexico, in a period of three years. An improved fast Fourier transform analysis in the form of the ratio of the vertical magnetic field component to the horizontal one (Q = Bz/Bx) has been developed. There are important differences between the frequencies obtained during the days of seismic activity compared with those with no seismic activity.
1. Introduction
There has been a substantial accumulation of convincing evidence of electromagnetic phenomena associated to earthquakes (EQs) in the last decades (e.g. Hayakawa Citation1999, Citation2009; Hayakawa & Molchanov Citation2002; Molchanov & Hayakawa Citation2008). We can indicate a few examples of those seismo-electromagnetic effects which might be used for the short-term EQ prediction: (1) ULF (ultra-low frequency) electromagnetic emissions from the lithosphere (e.g. Fraser-Smith et al. Citation1990; Kopytenko et al. Citation1993; Hayakawa et al. Citation1996) and (2) seismo-ionospheric perturbations in the lower ionosphere (D/E regions) (e.g. Hayakawa et al. Citation2007) and in the upper ionosphere (F layer (or so) (e.g. Pulinets & Boyarnuch Citation2004; Liu et al. Citation2006). A recent monograph edited by Hayakawa (Citation2009) includes several review papers on different seismogenic aspects containing recent progress, present knowledge and future work (Biagi Citation2009; Fraser-Smith Citation2009; Freund Citation2009; Molchanov Citation2009; Parrot Citation2009; Pulinets Citation2009).
It is well known that a great quantity of evidence on such seismo-electromagnetic phenomena has already been accumulated, though few papers have been recently published criticizing the presence of seismogenic ULF emissions for earlier events (Campbell Citation2009; Thomas et al. Citation2009) (although there is no guarantee that the conclusions of those papers are right). Further evidence in support of the presence (or absence) of seismo-electromagnetic phenomena is still highly required. In this paper, a new possibility is proposed; a study of spectra fluctuation (or modulation) of time series data of seismo-electromagnetic activity, in which attention is given to the modulations of different kinds of physical processes possibly taking place in the lithosphere, atmosphere and ionosphere/magnetosphere. The investigation of these modulations of the seismo-electromagnetic phenomena allows offering further support to the presence of those anomalies and also provides further understanding on their generation mechanisms. Furthermore, the slope of spectra fluctuation provides additional useful information on the self-organized criticality taking place in the lithosphere.
Evidence of electromagnetic emission at several frequencies associated with EQs has been accumulated over the years (e.g. Hayakawa & Molchanov Citation2002; Molchanov & Hayakawa Citation2008). The presence of strong interferences hampers the accumulation of the experimental data to test existing ideas on the mechano-electromagnetic conversion in the Earth's crust (Guglielmi et al. Citation2006). In addition, many authors perform signal processing in a wide range of frequencies for reported geomagnetic perturbations related to EQs. Such anomalies have been reported for several decades (Parrot & Johnston Citation1989; Johnston Citation1997; Kushwah et al. Citation2009). Seismogenic phenomena in the ULF range related to EQs with frequencies ranging from 0.005 to 1 Hz (Kopytenko et al. Citation1993) have been studied since Fraser-Smith et al. (Citation1990) and a number of papers have been published on this topic since then (Smirnova et al. Citation2004; Serita et al. Citation2005; Kushwah et al. Citation2009). This frequency range is of practical importance for EQ activity, since these waves propagate easily on the Earth's surface where ULF sensors are installed (Ida et al. Citation2008).
One problem regarding these seismogenic ULF emissions is their detection as their signals are weak. Different methods of analysis have been developed: polarization analysis based on the ratio of the vertical magnetic field component to the horizontal (Hayakawa et al. Citation1996), fractal analysis (mono- and multi-) (Hayakawa et al. Citation1999; Gotoh et al. Citation2004; Kotsarenko et al. Citation2004, Citation2005, Citation2007; Smirnova et al. Citation2004; Ida et al. Citation2005; Ida & Hayakawa Citation2006), principal component analysis (Hattori et al. Citation2004; Kotsarenko et al. Citation2005) and singular value decomposition (Hattori et al. Citation2006) among others.
All the aforementioned methods are applied to improve both the detection of the ULF signals associated with seismogenic phenomena at different frequencies (Hayakawa et al. Citation2008), and the understanding of electromagnetic phenomena associated with tectonic and volcanic activity. In this paper, a simple analysis involving the ratio between vertical and horizontal components has been used. This analysis is completed with a statistical method applied to the FFT ULF data observed in Mexico during the years 2009, 2010 and 2011. Significant differences were found for the data obtained in periods of 24 hours with seismic activity and random signals of the same duration with no seismic activity for eight EQs recorded in Mexico near the observing station, considering a distance of ρ = (1.8) 100.45M (Chavez et al. Citation2011), where M is the magnitude of the EQ reported by the Seismological National Service of Mexico.
2. ULF geomagnetic data and EQs
ULF geomagnetic data was obtained at the Juriquilla (JU2) observatory, located at the geographic coordinates: –100.45° N, 20.70° E. In this site, three geomagnetic components (Bx; N–S component, By: E–W component and Bz: vertical component) are recorded using fluxgate sensors. The sampling frequency is 1 Hz. The analysis is focused on eight big EQs (with magnitude greater than 6.0) within a distance to the station of ρ as described previously. The events occurred between the years 2009 and 2011. The main characteristics of the EQs are presented in . The period of time analyzed for each event was of 24 hours. The distance between the EQs and the geomagnetic observatory is consistent with that used in previous studies (Chavez et al. Citation2010; Chavez et al. Citation2011). In those studies, the perturbations associated with the magnitude of the EQs could be observed.
Table 1. Earthquakes occurred in Mexico during the year 2008–2010. Magnitude greater than 6 was selected for this analysis (E), and magnitude less than 4.5 was selected for the random analysis (S). Year/month/day/hour/min are: the exact time of the EQ (local time), latitude and longitude: the geographic coordinates of the epicenter, magnitudes and depth: magnitude and depth of the EQ, distance: the distance between the epicenter and Juriquilla station and ρ: the radius of the EQ preparation zone estimated by the proposed equation. The EQ magnitudes are presented in bold (catalogue of National Seismological Service, Mexico).
3. FFT ratio Analysis
The polarization method developed by Hayakawa et al. (Citation1996) is based on the measurement of the ratio of spectral power of the vertical magnetic field (Z) to the horizontal magnetic field (Bx and By). This ratio provides information on the variation of the geomagnetic field of ionospheric origin (or solar-terrestrial effect) or seismic origin (Ida et al. Citation2008). In this paper, the proposed ratios for the analysis are Q = Bz/Bx and R = Bz/By, representing the relation between the vertical and the horizontal components. These ratios are analogue to those previously used in other publications (e.g. Hayakawa et al. Citation2007).
The time series of the ULF data were processed to obtain the Q and R ratios of the magnetic field. Furthermore, the fast Fourier transform (FFT) was applied to the signals to obtain the power spectrum. shows three ratio signals corresponding to the FFT spectra for each one of the eight seismic events. This treatment was performed in order to analyze the components of the frequencies associated to seismogenic ULF emissions (Hayakawa et al. Citation2007). It can be observed that the FFT spectrum results in significant differences between the Bz/Bx components of the magnetic field.
Figure 1. FFT-based spectrum of the Bx, By and Bz components from ULF geomagnetic data. The blue lines show non-seismic spectra (XS, YS, ZS) while the red lines are seismic (XE, YE, ZE). FFT-based analysis does not show important differences between seismic and non-seismic data from the Bx, By and Bz components. To view this figure in colour, please see the online version of the journal.
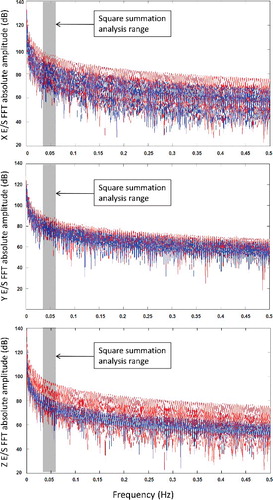
The aforementioned behaviour is common to the eight analyzed seismic events. There are some important attenuation patterns during the days when the EQs occurred in all the analyzed frequency ranges (from 0.0 to 0.5 Hz). Those results can be associated with the distance, location, depth and magnitude of the EQs.
4. Observation and FFT analysis results
The proposed method allows observing some differences between the FFT analyses for the Bx, By and Bz components compared with the Q and R ratio signals. As aforementioned, each event's signal consisted in 24 hour data which was sampled at 1 Hz frequency using a fluxgate magnetometer.
The analysis procedure consisted in performing a 1024-point FFT for each event's signal from directions Bx, By, Bz, Q and R to obtain its spectrum followed by a scaling procedure where the spectrum was converted to dB scale to clarify results. The results for the Bx, By and Bz axes can be observed in , where the blue lines correspond to superposed epochs with non-seismic signals while the red lines correspond to superposed epochs associated to seismic signals. As can be observed in , there is no significant difference between non-seismic and seismic spectra in the Bx, By and Bz components because seismic and non-seismic spectral amplitude overlaps on most part of the signal. Furthermore, shows the same procedure performed for Q and R ratios signals. An interesting attenuation in the seismic signal spectrum for the Q ratio (red line) is observed when compared to the non-seismic spectrum (blue line). On the other hand, the R spectrum shows a similar behaviour to the Bx, By and Bz components with no difference between seismic and non-seismic spectra.
Figure 2. FFT-based spectrum of the Q = Bz/Bx and R = Bz/By ratio signals from ULF geomagnetic data. The blue line indicates epochs with no seismic activity (QS and RS) while the red line represents the seismic activity (QE and RE). FFT-based analysis does not show important differences on R ratio but an interesting attenuation in seismic (red line) data from Q ratio spectra can be observed. To view this figure in colour, please see the online version of the journal.
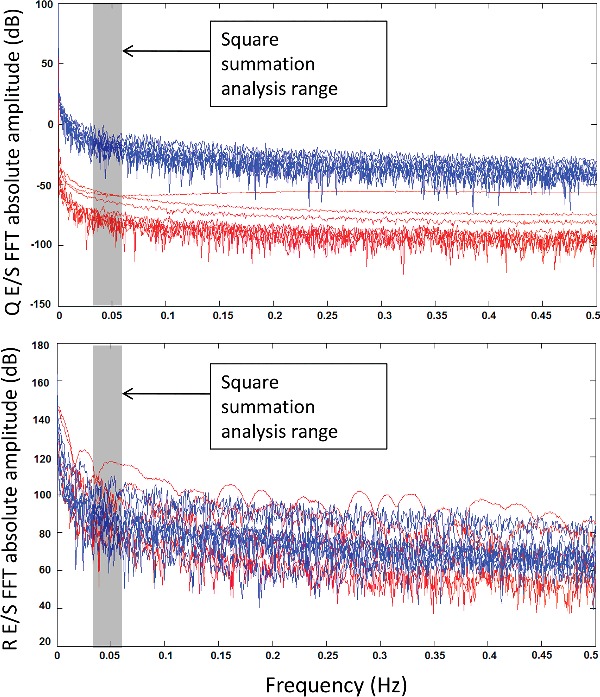
Accordingly, a post processing analysis based on the minimum square procedure was performed for a certain range of the Bx, By, Bz and R spectra to obtain a quantitative measurement of the peak amplitude of FFT-based analysis. The minimum square range was established between 0.0303 and 0.616 Hz and was determined experimentally. and show the selected frequency range for the minimum square procedure. We know that the geomagnetic field is affected by solar activity as shown by Wen et al. (Citation2012). However, as will be seen in this paper, the FFT analysis results in geomagnetic relations on the Q ratio only, which indicates that the solar activity can be discriminated for this purpose.
5. Square summation-based quantitative analysis
In order to quantify the FFT-based results, a well-known square summation procedure was applied to the resulting FFT spectra by performing a summation of the square of each point in the spectrum in the range b–a as indicated by Equation equation (1)(1) where w is the frequency of the FFT domain, B(w) is the FFT spectrum of the magnetic field B, a is the lower limit, b is the upper limit and Square sum (Sqsum) is the result of the summation procedure. Consequently, a scalar value is obtained from each FFT signal that represents a quantitative measurement of its spectrum amplitude in the aforementioned b–a range.
(1)
6. Statistical analysis results
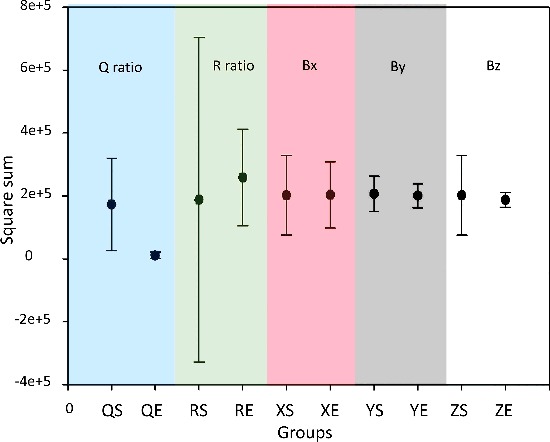
Furthermore, a statistical analysis was performed using t-test and Mann–Whitney algorithms to compare the statistical properties in each axis under calm conditions and seismic activity. It means that the analysis focused on the existence of statistical differences between calm and seismic periods for each axis from the data extracted during FFT analysis and quantified by Equation equation (1)(1) . The statistical analyses groups were organized by choosing an N number of elements per group of eight (N = 8). Therefore, eight signals from non-seismic readings (Bx = XS, By = YS, Bz = ZS components and RS and QS ratios) and eight during seismic conditions (Bx = XE, By = YE, Bz = ZE components, RE and QE ratios) from each axis were used for this analysis as it can be observed in .
Table 2. Proposed statistical tests.
Mean values and standard deviations of each group were obtained using Sigma Plot 11 software. shows the results of the aforementioned statistical analysis for each group including the mean value and the +/− standard deviation bar. This plot shows that, when comparing each component or their ratio during seismic and non-seismic conditions, an overlap occurs for axis Bx (XE–XS), By (YE–YS), Bz (ZE–ZS) components Q (QE–QS) and R (RE–RS) ratio. However, there is no overlap between calm and seismic periods for the Q ratio. These results indicate that the Q ratio may be a means to identify seismic events.
Figure 3. Statistical analysis for Bx (XE–XS), By (YE–YS), Bz (ZE–ZS), Q = Bz/Bx (QS–QE) and R = Bz/By (RS–RE). Mean +/− three sigma bars for each statistical analysis group where only QS and QE groups have a good statistical correlation.
In order to identify how different are calm and seismic periods in each axis, statistical tests were performed for the pairs of values shown in .
Different statistical tools can be used to compare different kinds of experimental data. However, this project requires statistical comparisons between seismic and calm periods for each axis. The t-test has shown to be appropriate to statistically compare two groups (Rice Citation2006). In that sense, this test was selected as the statistical analysis tool to compare the Bx and By components of the magnetic field. However, the t-test is not recommended for non-parametric or highly scattered data, and therefore, it results inadequate for the Bz component and Q and R ratios as they are of non-parametric nature. Because of this, the Mann–Whitney rank sum test was selected to statistically compare the calm and seismic periods for the Bz component and the Q and R ratios (Fay & Proschan Citation2010).
On the other hand, the p-value represents a probability of obtaining the same sample results when the null hypothesis is true. Where null hypothesis means that there is no relationship between two phenomena. In order to perform a comparison tests, a constant value for the p-value must be chosen. When the p-value resulting from a comparison test between two groups is less than 0.05, it is considered that there is statistical difference between these groups. However, if the p-value obtained from a comparison test exceeds the 0.05 threshold, it is considered that there is no statistical difference between these groups.
The statistical analysis performed in this study shows p-values during calm and seismic periods exceeding the 0.05 threshold for the Bx (XE–XS), By (YE–YS) and Bz (ZE–ZS) components and the R (RE–RS) ratio (0.934, 0.466, 0.878 and 0.442, respectively) which means that it is impossible to distinguish between seismic and calm signals for these components, as it can be observed in . However, the Q ratio showed a p = 0.001 which indicates that it can be a promising index to discriminate between seismic QE from non-seismic QS events due to its highly significant statistical difference gathered by the Mann–Whitney rank sum test.
Table 3. Statistical analysis for paired groups Bx (XS–XE), By (YS–YE), Bz (ZS–ZE), Q = Bz/Bx (QS–QE) and R = Bz/By (RS–RE).
7. Conclusions
There are seismo-magnetic signals related to EQs disturbing the earth's electromagnetic field. The main problem of the signal detection is the discrimination of the background noise. For that reason, the use of the FFT-based analysis on Q and R ratio signals is proposed. Additionally, an improved statistical ratio analysis method has been applied to the ULF geomagnetic data at Juriquilla station in Mexico. The three geomagnetic field components recorded behave in different ways, for that reason a general spectrum analysis is performed for the Bx, By and Bz components. Also, the spectrum analysis methodology is proposed for the Q and R ratio signals with interesting results. It is well known that the spectra in the Bz (XE–XS), By(YE–YS) and Bz (ZE–ZS) axis do not provide significant information to discriminate between seismic and non-seismic events. The same happens with the R (RE–RS) ratio signal spectrum which does not provide with any interesting information. However, the Q (QE–QS) ratio signal showed an interesting attenuation in its spectrum when seismic events occur. By using the well-known minimum square methodology to quantify the data dispersion in the resulting spectra, a significant difference between the Q ratio for seismic and non-seismic data was confirmed. The minimum square methodology used for the Q ratio spectrum shows to be enough robust to discriminate seismic from non-seismic electromagnetic signals. The p-value obtained from the Mann–Whitney rank sum test for eight different events is far below the threshold that indicates statistical difference between two groups (p = 0.001). This methodology can be useful in future projects to accurately discriminate seismic from calm periods.
Acknowledgements
The authors are grateful to CONACyT for their support and collaborations in this research under the SNI assistance under the project number 54600. The authors would also like to thank PhD Hilda Romero Zepeda for editing the English version and to LAV Rodrigo Beltrán Soria for editing the figures of this paper. The authors thank to the anonymous referees for their observations and recommendations to improve this paper.
Disclosure statement
No potential conflict of interest was reported by the authors.
Additional information
Funding
References
- Biagi PF. 2009. Pre- and post-seismic disturbances revealed on the geochemical data collected in Kamchatka (Russia) during the last 30 years. In: Hayakawa M, editor. Electromagnetic phenomena associated with earthquakes. Vol. 4. Trivandrum: Transworld Research Network; p. 97–117.
- Campbell WH. 2009. Natural magnetic disturbance fields, not precursors, preceding the Loma Prieta earthquake. J Geophys Res. 114:A05307:1–7.
- Chavez O, Millan-Almaraz JR, Perez-Enrıquez R. Arzate-Flores JA, Kotsarenko A, Cruz-Abeyro JA, Rojas E. 2010. Detection of ULF geomagnetic signals associated with seismic events in Central Mexico using Discrete Wavelet Transform. Nat Hazards Earth Syst Sci. 10:2557–2564.
- Chavez O, Pérez-Enríquez R, Cruz-Abeyro JA, Millan-Almaraz R, Kotsarenko A, Rojas E. 2011. Detection of electromagnetic anomalies of three earthquakes in Mexico with an improved statistical method. Nat Hazards Earth Syst Sci. 11:2021–2027.
- Fay MP, Proschan MA. 2010. Wilcoxon–Mann–Whitneyor t-test? On assumptions for hypothesis tests and multiple interpretations of decision rules. Stat Surv. 4:1–39.
- Fraser-Smith AC. 2009. The Ultralow-frequency magnetic fields associated with and preceding earthquakes. In: Hayakawa M, editor. Electromagnetic phenomena associated with earthquakes. Vol. 1. Trivandrum: Transworld Research Network; p. 1–20.
- Fraser-Smith AC, Bernardi A, McGill PR, Ladd ME, Helliwell RA, Villard Jr OG. 1990. Low-frequency magnetic field measurements near the epicenter of the Ms 7.1 Loma Prieta earthquake. Geophys Res Lett. 17:1465–1468.
- Freund F. 2009. Stress-activated positive hole charge carriers in rocks and the generation of pre-earthquake signals. In: Hayakawa M, editor. Electromagnetic phenomena associated with earthquakes. Vol. 3. Trivandrum: Transworld Research Network; p. 41–96.
- Gotoh K, Hayakawa M, Smirnova NA, Hattori K. 2004. Fractal analysis of seismogenic ULF emissions. Phys Chem Earth. 29:419–424.
- Guglielmi A, Hayakawa M, Potapov A, Tsegmed B. 2006. Polarization method to detect the co-seismic magnetic oscillations. Phys Chem Earth. 31:299–304.
- Hattori K, Serita A, Gotoh K, Yoshino C, Harada M, Isezaki N, Hayakawa M. 2004. ULF geomagnetic anomaly associated with 2000 Izu Islands earthquake swarm. Jpn Phys Chem Earth Parts A/B/C. 29:425–435.
- Hattori K, Serita A, Yoshino C, Hayakawa M, Isezaki N. 2006. Singular spectral analysis and principal component analysis for signal discrimination of ULF geomagnetic data associated with 2000 Izu Island earthquake swarm. Phys Chem Earth. 31:281–291.
- Hayakawa M, editor. 1999. Atmospheric and ionospheric electromagnetic phenomena associated with earthquakes. Tokyo: TERRAPUB. p. 997.
- Hayakawa M. 2007. VLF/LF radio sounding of ionospheric perturbations associated with earthquakes. Sensors. 7:1141–1158.
- Hayakawa M, editor. 2009. Electromagnetic phenomena associated with earthquakes. Trivandrum: Transworld Research Network. p. 279.
- Hayakawa M, Hattori K, Ohta K. 2007. Monitoring of ULF (ultralow-frequency) geomagnetic variations associated with earthquakes. Sensors. 7:1108–1122.
- Hayakawa M, Hattori K, Ohta K. 2008. Observation of ULF geomagnetic variations and detection of ULF emissions associated with earthquakes: review. Electric engineering in Japan. 162:1–8. Translated from Denki Gakkai Ronbunshi. 126-A:1238–1244.
- Hayakawa M, Ito T, Smirnova N. 1999. Fractal analysis of ULF geomagnetic data associated with the Guam earthquake on 8 August 1993. Geophys Res Lett. 26:2797–2800.
- Hayakawa M, Kawate R, Molchanov OA, Yumoto K. 1996. Results of ultra-low-frequency magnetic field measurements during the Guam earthquake of 8 August 1193. Geophys Res Lett. 26:2797–2800.
- Hayakawa M, Molchanov OA, editors. 2002. Seismo-electromagnetics: lithosphere-atmosphere-ionosphere coupling. Tokyo: TERRAPUB; p. 477.
- Ida Y. Hayakawa M. 2006. Fractal analysis for the ULF data during the 1993 Guam earthquake to study prefracture criticality. Nonlin Process Geophys. 13:409–412.
- Ida Y, Hayakawa M, Adalev A, Gotoh K. 2005. Multifractal analysis for the ULF geomagnetic data during the 1993 Guam earthquake. Nonlin Process Geophys. 12: 157–162.
- Ida Y, Yang D, Li Q, Sun H, Hayakawa M. 2008. Detection of ULF electromagnetic emissions as a precursor to an earthquake in China with an improved polarization analysis. Nat Hazards Earth Syst Sci. 8:775–777.
- Johnston MJS. 1997. Review of electric and magnetic fields accompanying seismic and volcanic activity. Surv Geophys. 18:441–475.
- Kopytenko YA, Matiashvili TG, Veronov PM, Molchanov OA. 1993. Detection of ultra-low frequency emissions connected with Spitak earthquake and its aftershock activity, based on geomagnetic pulsation data at Dusheti and Vardzia. Phys Earth Planet Int. 77:85–95.
- Kotsarenko A, Molchanov O, Hayakawa M, Koshevaya S, Grimalsky V, Pérez Enríquez R, López Cruz-Abeyro JA. 2005. Investigation of ULF magnetic anomaly during Izu earthquake swarm and Miyakejima volcano eruption at summer 2000, Japan. Nat Hazards Earth Syst Sci. 5:63–69.
- Kotsarenko A, Pérez Enríquez R, López Cruz-Abeyro JA, Koshevaya S, Grimalsky V, Yutsis V, Kremenetsky I. 2007. ULF geomagnetic anomalies of possible seismogenic origin observed at Teoloyucan station, México, in 1999–2001: intermediate and short-time analysis. Tectonophysics. 431:249–262.
- Kotsarenko A, Pérez Enríquez R, López Cruz-Abeyro JA, Koshevaya S, Grimalsky V, Zúñiga FR. 2004. Analysis of the ULF electromagnetic emission related to seismic activity, Teoloyucan geomagnetic station, 1998–2001. Nat Hazards Earth Syst Sci. 4:679–684.
- Kushwah V, Singh V, Singh B. 2009. Ultra low frequency (ULF) amplitude observed at Agra (India) and their association with regional earthquakes. Phys Chem Earth. 34:367–272.
- Liu JY, Chen YI, Chuo YJ. 2006. A statistical study of pre-earthquake ionosphere anomaly. J Geophys Res. 111:A05304. doi:10.1029/2005JA011333
- Molchanov OA. 2009. Lithosphere-atmosphere-ionosphere coupling due to seismicity. In: Hayakawa M, editor. Electromagnetic phenomena associated with earthquakes. Vol. 10. Trivandrum: Transworld Research Network; p. 255–279.
- Molchanov OA, Hayakawa M. 2008. Seismo-electromagnetics and related phenomena: history and latest results. Tokyo: TERRAPUB.
- Parrot M. 2009. Anomalous seismic phenomena: view from space. In: Hayakawa M, editor. Electromagnetic phenomena associated with earthquakes. Vol. 8. Trivandrum: Transworld Research Network; p. 205–234.
- Parrot M, Johnston MJS. 1989. Seismoelectromagnetic effects. Phys Earth Planet Int. 57:1–177.
- Pulinets S. 2009. Lithosphere-atmosphere-ionosphere coupling (LAIC) model. In: Hayakawa M, editor. Electromagnetic phenomena associated with earthquakes. Vol. 9. Trivandrum: Transworld Research Network; p. 235–254.
- Pulinets S, Boyarnuch K. 2004. Ionospheric precursors of earthquakes. Berlin: Springer.
- Rice JA. 2006. Mathematical statistics and data analysis. 3rd ed. Belmont, CA: Thomson Higher Education.
- Serita A, Hattori K, Yoshino C, Hayakawa M, Isezaki N. 2005. Principal component analysis and singular spectrum analysis of ULF geomagnetic data associated with earthquakes. Nat Hazards Earth Syst Sci. 5:685–689.
- Smirnova N, Hayakawa M, Gotoh K. 2004. Precusory behavior of fractal characteristics of the ULF electromagnetic fields in seismic active zones before strong earthquakes. Phys Chem Earth. 29:445–451.
- Thomas J, Love J, Johnston M. 2009. On the reported magnetic precursor of the 1989 Loma Prieta earthquake. Phys Earth Planet Int. 173:207–215.
- Wen S, Chen CH, Yen HY, Yeh TK, Liu JY, Hattori K, Han P, Wang CH, Shin TC. 2012. Magnetic storm free ULF analysis in relation with earthquakes in Taiwan. Nat Hazards Earth Syst Sci. 12:1747–1754.