
 ?Mathematical formulae have been encoded as MathML and are displayed in this HTML version using MathJax in order to improve their display. Uncheck the box to turn MathJax off. This feature requires Javascript. Click on a formula to zoom.
Abstract
Research on the emergency facility location-allocation problem has important theoretical and practical significance for responses to large-scale emergencies. During the actual planning of disaster supply warehouses (DSWs), reconstruction and expansion projects usually need to fully exploit different levels of designated facilities to achieve resource integration. This article presents a hierarchical supplement location-allocation (HSLA) optimization model for DSWs in both the preparedness and response phases to address the above concerns. The model minimizes the total number and cost of DSWs for the facility location problem and the total distance for delivering supplies at all levels for the supply allocation problem. A modified particle swarm optimization algorithm is applied to derive solutions to the HSLA model. The model is demonstrated for the Beijing–Tianjin–Hebei (BTH) region in China. The results show that twelve of the 180 counties, which account for 6.03% of the total area of the BTH region are not covered by county-, prefectural- and provincial-level DSWs. In addition, three sets of optimization schemes for the location-allocation problem for DSWs at the three levels and one final mixed optimal scheme (one county-level DSW, two prefectural-level DSWs, and one provincial-level DSW should be newly built or upgraded in four counties) are suggested based on the supplemental optimization site selection. This model is believed to remain more consistent with the knowledge of DSW planners and policy makers by incorporating the multi-level coverage and supplemental site selection concept into the location-allocation problem. The method can be easily duplicated to expand or build new emergency facilities at different levels in addition to DSWs. The results provide a scientific reference for DSW location-allocation planning in the BTH region.
1. Introduction
From 1970 to 2017, natural disasters led to the annual loss of more than 52,000 people (including those who were missing) and estimated economic losses of USD 95.4 billion globally (Swiss Re Institute, Citation2018). China experiences almost all potential hazards observed worldwide, and they all present a high frequency, high intensity, large disaster losses, and a high proportion of global disaster losses (Shi et al. Citation2018). The losses caused by ineffective emergency logistics, such as emergency relief supplies and emergency personnel, account for 15–20% of the total losses (Fan et al. Citation2009). The issue of emergency natural disaster relief has been emphasized by the Chinese government. Since the establishment of a state-level reserve system of disaster supplies in 1998, 10 state-level disaster supply warehouses (DSWs) have been set up and are still under construction (Xiao and Hou Citation2013). China’s 13th Five-Year Plan for Comprehensive Disaster Reduction and the National Emergency Plan for Natural Disaster Relief of China clearly indicate that emergency supply warehouses must be further set up and optimized (Lu et al. Citation2011). Efficient emergency facility location-allocation planning has been the subject of growing public concern and research interest. Nevertheless, research on emergency logistics is simply not commensurate with its crucial role (Holguín-Veras et al. Citation2012), particularly concerning quantitative models.
Emergency logistics quantitative models can be classified into facility location, supply allocation and integrated location-allocation models. Optimizing the facility location of emergency supplies is one mechanism of increasing the preparedness for natural disasters, and the related studies are abundant (Yushimito et al. Citation2012; Huang et al. Citation2010; Rawls and Turnquist Citation2011). Jia et al. (Citation2007) developed models to optimize the locations of facilities for medical supplies during large-scale emergencies in the Los Angeles area. Balcik and Beamon (Citation2008) developed a maximal covering location model that determined the number and locations of distribution centres in a relief network. Doerner et al. (Citation2009) presented a multi-objective location optimization model with respect to the location of public facilities for hurricane disaster evacuation. Rawls and Turnquist (Citation2010) developed a mixed-integer stochastic programming model that incorporates multiple commodities and the possibility of damage to roads and damage to prepositioned warehouses and thus supplies. Yang et al. (Citation2016) illustrated how to establish a reserve network composed of the number of warehouses, the location of the warehouse and the inventory quantities of relief supplies for best integration effect. The location model estimated the associated cost, risk and utility values of potential reserve networks, which enabled the best allocation decision of relief supplies in different warehouses according to different principles.
Supply allocation is also vitally important to the response phase of the disaster relief process, and a vast amount of research works have been conducted in this area. For example, Tzeng et al. (Citation2007) developed a deterministic multi-objective model to distribute commodities to demand points with regards to costs, service time, and demand satisfaction. Fan et al. (Citation2009) established a mathematical model with the objective of minimizing the total distribution time of vehicles for the process of relieving the goods distribution when a natural disaster erupts. Rawls and Turnquist (Citation2012) extended their prior work by constructing a dynamic allocation model to optimize prevention planning for satisfying short-term shelter demands for emergency supplies under uncertainty. Özdamar and Demir (Citation2012) focused on coordinating the logistics of the last mile delivery and proposed an efficient mathematical model based on a hierarchical cluster and route procedure to find the optimal allocation of warehouses and hospitals to demand cluster centres. However, the facility location and supply allocation model should not be developed separately during an actual emergency.
Emergency logistics models should drive coordination to the forefront by planning the facility location and supply allocation in tandem so that they correspond to the preparedness and response phases; in addition, location-allocation frameworks should be used in which the prepositioning of warehouses is accompanied by a resource allocation plan to satisfy the demand when disaster strikes (Caunhye et al. Citation2016). Duran et al. (Citation2011) devised a typical location-allocation model where warehouse locations and inventory levels are determined and resources are allocated to regional demand locations. Mete and Zabinsky (Citation2010) developed a two-stage stochastic programming model to first locate possible medical storage centres and the required inventory levels before the disaster and then deliver medical supplies to hospitals for each disaster scenario. Caunhye et al. (Citation2016) proposed a two-stage location-routing model with recourse for integrated prepositioning and relief distribution planning under uncertainty. Davis et al. (Citation2013) proposed a stochastic programming model to determine how supplies should be positioned and distributed among a network of cooperative warehouses. The model incorporated constraints that enforce equity in service while also considering traffic congestion resulting from possible evacuation behaviour and time constraints for providing effective response. Alem et al. (Citation2016) developed a new two-stage stochastic network flow model under practical assumptions that have rarely been considered in previous papers, such as the dynamic multi-period nature of disaster relief operations, limited budgets, fleet sizing, and a variety of uncertain data. An unprecedented amount of work has been performed on the application of quantitative emergency location-allocation models, for example, Chang et al. (Citation2007), Salmerón and Apte (Citation2010), Noyan (Citation2012), Bozorgi-Amiri et al. (Citation2013), Rennemo et al. (Citation2014), Ahmadi et al. (Citation2015), Noyan et al. (Citation2015), Zhao et al. (Citation2017) and Xu et al. (Citation2018). However, in the case of complex, high-dimensional problems related to large areas, the existing optimization algorithms are highly time consuming and difficult to find the global optimal solution when solving the above models (Xu et al. Citation2018).
Specifically, our article makes the following contributions to the literature. We focus on coordinating the preparedness phase and the response phase via the integrated planning of two of their most important problems: a facility location problem to locate new DSW sites and a supply allocation problem to supply the affected people. The integrated planning of these problems is essential for combined pre- and post-disaster risk management. Second, we consider that designated warehouses with different levels should be prioritized for reconstruction and expansion projects to achieve resource integration, which is also effective for solving complex, high-dimensional location-allocation problem by reducing dimensions. To the best of our knowledge, this paper is the first in both the preparedness and response domains to consider supplemental optimization in large-scale emergency planning.
The Beijing–Tianjin–Hebei (BTH) region is a historically earthquake-prone area, and although it initially established a disaster supply reserve network by integrating different levels of DSWs, problems remain, such as a small number of DSWs and an unreasonable layout. In addition, it calls for prioritizing the multi-level designated DSWs before new warehouses are supplemented so that these DSWs are fully exploited. This article establishes a hierarchical supplement location-allocation optimization model for both the preparedness and response phases based on a multi-level coverage and supplemental site selection concept. The model is then implemented in the BTH region as an illustrative example. The model is solved by a modified particle swarm optimization (PSO) algorithm, and then four sets of supplemental location-allocation schemes based on the existing three-level DSWs are proposed and discussed. The study can provide a scientific and technical support plan for improving the emergency management system in the region.
2. Data and methods
The sources of data for the case study area, the hierarchical supplement location-allocation optimization model for DSW, and the model hypotheses are presented in this section.
2.1. Study area and database
The Beijing–Tianjin–Hebei region is located in the North China earthquake zone and had an area of 217,000 km2 and a population of 0.11 billion in 2013 (National Bureau of Statistics Citation2015). A number of shallow, strong and destructive earthquakes have occurred in this region throughout history, such as the M8.0 earthquake in Sanhe-Pinggu in 1679, the M7.2 earthquake in Xingtai in 1966, and the M7.8 earthquake in Tangshan in 1976.
After the Zhangbei earthquake in 1998, a reserve system of disaster supplies was established throughout China (Xiao and Hou Citation2013). As of 2016, three provincial-level DSWs are located in the BTH region (located in Beijing, Tianjin and Hebei, respectively), 11 prefectural-level DSWs are located in Hebei, and 79 county-level DSWs are located in Beijing (16) and Hebei (63). The total number and spatial pattern of the DSWs in the BTH region are shown in and , respectively.
Figure 1. Distribution of DSWs in the BTH region.
Source: © The Authors.
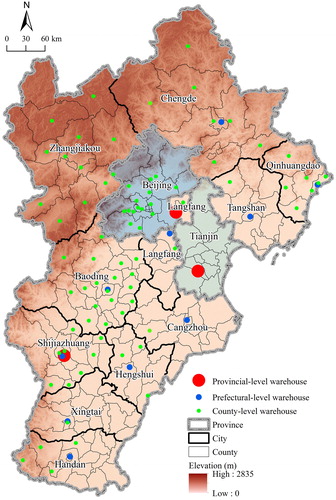
Table 1. Statistics of the current situation of DSWs in the BTH region.
2.2. Location-allocation optimization model for DSWs
2.2.1. Model hypotheses
Each DSW as a supply facility can provide services for many demand points, and its service capacity greatly depends on the types and number of relief materials and the spatial distance. Generally, short distances ensure the quick arrival of relief material at the demand points. The maximal service distances from the provincial-level, prefectural-level and county-level DSWs to the demand points are set to 120 km, 60 km and 30 km, respectively. Each county (or county-level city and district) has only one demand point, which is assumed to be concentrated in the geometric centre. If the demand point of a county is covered by several DSWs, then it will receive the service only from its nearest DSW. The distance between any supply facility and demand point is the straight-line distance. In addition, the administrative boundaries are not considered as the restriction for the service area of DSWs, which can guarantee the shortest time and lowest cost of the transportation for the delivery of relief supplies.
The construction costs of the prefectural- and provincial-level DSWs are assumed to be two and four times that of a county-level DSW, respectively. Additionally, if a high-level DSW is upgraded from a low-level DSW, the upgrading cost should subtract the cost of the original low-level DSW. In addition, the scheme with fewer DSWs provides better management cost savings when the construction costs of different schemes are the same. This set of assumptions is used to evaluate the mixed expansion and newly built schemes.
2.2.2. Hierarchical supplement location-allocation optimization model (HSLA model) for DSWs
The HSLA model for DSWs involves a facility location problem to locate new DSW sites and a supply allocation problem to serve the demand points. The facility location problem in the HSLA model takes all counties not covered by an existing DSW as the demand points and all counties as the candidate sites of DSWs.Footnote1 New DSWs are suggested for counties that are not covered by any designated DSWs as a supplemental site selection for the DSW. The objective function of the facility location problem is to minimize the total number of DSWs and construction costs to determine the minimum number of newly built or upgraded DSWs at all levels with the lowest cost. The supply allocation problem in the HSLA model takes all of the counties as demand points and all designated DSWs and newly built DSWs as supply facilities. The objective function of the supply allocation problem is to minimize the total distance from the DSWs to demand points to determine the final allocation schemes of the three levels of DSWs and counties that they serve. To summarize, the ultimate goal of the HSLA model is to minimize the total number and cost of the DSWs while the total distance must be a minimum at all levels as shown in EquationEquations (1)(1)
(1) and Equation(2)
(2)
(2) :
(1)
(1)
(2)
(2)
(3)
(3)
subject to
(4)
(4)
(5)
(5)
(6)
(6)
(7)
(7)
(8)
(8)
where, x is the type of model hierarchies; a represents the county level; b represents the prefectural level; c represents the provincial level; Ix is the set of candidate DSWs, with Ix = (1, 2, … i, … Nx); Na, Nb and Nc represent the number of the three levels of DSWs;
Jx is the set of demand points for counties, with Jx = (1,2, … j, … Mx); Ma, Mb and Mc represent the number of demand points in the three-level model; cx is the construction cost for a DSW of level x; Z is the set of designated DSWs, with is the length of the shortest distance between the demand point j and DSW i at level x; and
is the maximal service distance for DSW i at level x and corresponds to 30 km, 60 km and 120 km for the county, prefectural and provincial levels.
Our HSLA model first solves the facility location problem with the objective (fl) of minimizing the total number of newly built or upgraded DSWs and construction costs denoted in EquationEquations (1)(1)
(1) and Equation(2)
(2)
(2) . Then, the model will assign the supplies to demand points with the objective (fa) of minimizing the total distance between them to solve the supply allocation problem denoted in EquationEquation (3)
(3)
(3) . Both of the objectives are subject to the distance constraint expressed in EquationEquation (4)
(4)
(4) . The distance constraint requires that the distance from demand point j to a candidate DSW i should be less than
. EquationEquation (5)
(5)
(5) ensures that each district and county will be served by only one DSW. EquationEquation (6)
(6)
(6) ensures that the designated DSWs are selected. EquationEquations (7)
(7)
(7) and Equation(8)
(8)
(8) define the decision variables in the model.
The proposed model involves in a real-world large-scale location-allocation optimization problem for relief material depositories that is an NP-hard problem. Precision algorithms and general commercial optimization software present difficulties solving the problem in a reasonable amount of time. Therefore, heuristics or approximate algorithms are usually employed to find approximate solutions. Among them, the PSO algorithm has been applied successfully to facility location-allocation problems (Bozorgi-Amiri et al. Citation2012). To effectively solve complex and discrete optimization problems, Zhao et al. (Citation2015) modified the PSO algorithm which had successfully performed in large-scale location-allocation problems by applying a von Neumann structure in the former generations, adding global structure in the later generations, and combining a simulated annealing algorithm to help obtain the global optimum. The modified PSO algorithm was used to solve the HSLA model in this study.
3. Results
In this section, we present the allocation and location optimization results of the DSW based on the HSLA model. The coverage areas of the designated DSWs within their service capacity and the uncovered areas that need to build new DSWs are first discussed, and then the DSWs that need to transfer relief supplies across municipal administrative divisions are also indicated. Then, four sets of optimized supplemental location-allocation schemes are suggested based on the proposed HSLA model to solve the problem of inadequate capacity of the designated DSWs.
3.1. Allocation optimization for the designated DSWs
The results for the demand points covered by designated DSWs are shown in . Within the 30 km service distance of the county-level designated DSW, 70 of the 180 counties (including county-level districts and cities), which represents 30.53% of the total area of the BTH region, are not covered by the county-level DSWs as shown in . Among them, nine districts in Beijing are equipped with county-level DSWs, which cover 83.17% of the area of Beijing. Tianjin does not have county-level DSWs. With the exception of one district in the west, which is covered by a county-level DSW in the south of Langfang City of Hebei, the other 12 counties of Tianjin, with a total area of 80.05%, are not covered. A total of 59 of 149 counties in Hebei are equipped with county-level DSWs. With the exception of Qinhuangdao City, the other 10 prefectural-level cities are only partly covered by county-level DSWs, with 71.07% of the total area of Hebei. Among them, Cangzhou City has the largest number of uncovered counties at 13, which account for 80.68% of the area of the city, and it is followed by Tangshan City, Xingtai City, Handan City, Shijiazhuang City, Langfang City, Hengshui City, Zhangjiakou City, Chengde City and Baoding City at 9, 10, 9, 4, 2, 3, 3, 2 and 1 uncovered counties, respectively, which account for 68.43%, 49.99%, 43.53%, 35.88%, 29.31%, 26.55%, 17.91%, 12.09% and 10.52% of each city's total area, respectively.
Figure 2. Spatial allocation schemes for the designated DSWs.
Source: © The Authors. Note: the green, blue and red lines represent the spatial allocation scheme corresponding to the minimal-distance solution obtained using the county-level, prefectural-level and provincial-level HSLA models, respectively.
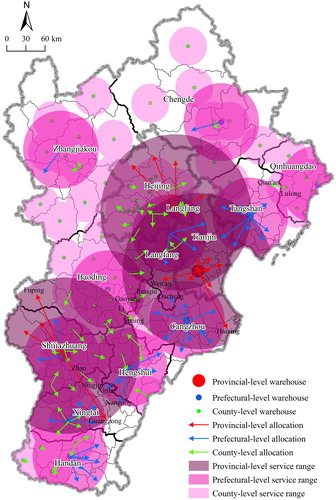
Table 2. Statistics on the number and area ratio of counties that are not covered by the three levels of DSWs in the BTH region.
Based on the county-level DSWs, 28 of the 180 counties, which account for 12.27% of the total area of the BTH region, are not covered by the designated county-level and prefectural-level DSWs within their radiation range. In Beijing, 16.51% of the area is uncovered, which has barely changed. A prefectural-level DSW is not located in Tianjin. However, certain western counties are covered by the prefectural-level DSW in the north of Langfang City of Hebei. The other 8 counties of Tianjin, with a total area of 38.39%, are not covered. Each of the 11 prefectural-level cities in Hebei is equipped with a prefectural-level DSW, and they can cover the area that is not covered by the county-level DSWs, which reduces the uncovered area to 10.48% of the total area of Hebei. Hengshui City is completely covered. The numbers of uncovered counties in Xingtai City, Shijiazhuang City, Handan City, Zhangjiakou City, Langfang City, Tangshan City, Baoding City, Cangzhou City and Chengde City are 4, 2, 3, 2, 1, 2, 1, 2 and 1, respectively, and they account for 19.39, 18.35, 14.48, 13.88, 13.74, 11.07, 10.52, 8.30 and 5.13% of each city's total area, respectively.
Based on the county-level and prefectural-level DSWs, the statistics of the uncovered counties are shown in and . Twelve of the 180 counties, which accounts for 6.03% of the total area of the BTH region, are not covered by the county-, prefectural- and provincial-level DSWs. The situation of Beijing and Tianjin has been totally changed, with all counties having coverage because each of them is equipped with a provincial-level DSW. A provincial-level DSW in Shijiazhuang City and other county- and prefectural-level DSWs result in 93.07% coverage of the total area of Hebei. The number of uncovered counties in Handan City, Xingtai City, Zhangjiakou City, Tangshan City, Chengde City and Cangzhou City is 3, 3, 2, 2, 1 and 1, respectively, which account for 14.48, 14.29, 13.88, 11.07, 5.13 and 4.16% of each city’s total area, respectively.
Table 3. Statistics on the areas of counties that are not covered by any level of DSW in the BTH region.
The optimization results for the demand points served by each designated DSW facility are shown in . Arrows indicate the connection between the DSWs and the demand points (counties) that they serve. A county with no DSWs will be preferentially serviced by the closest county-level DSWs in its neighbouring counties followed by prefectural- and provincial-level DSWs if it is not covered by any county-level DSW. shows the counties that will receive relief supplies across municipal administrative divisions in the BTH region.
Table 4. Statistics on the DSWs that need to transfer relief supplies to other cities’ counties in the BTH region.
3.2. Location-allocation optimization for the newly built DSWs
Twelve of the 180 counties, which account for 6.03% of the total area of the BTH region, are not covered by the existing DSWs based on the analysis in Section 3.1. The facility location method involved in the proposed HSLA model should complementarily build new DSWs in the uncovered counties to solve the problem of inadequate capacity. A total of four sets of optimized supplemental location-allocation schemes are provided and discussed based on the proposed HSLA model in this section. show the optimization schemes of the location-allocation problem for the DSWs at the county, prefectural and provincial levels and the mixed optimal scheme in the BTH region after the supplemental optimization site selection.
Figure 3. Spatial optimization location-allocation schemes for setting up new or upgrading current DSWs in the BTH region. (a) Only building new county-level DSWs; (b) only building new or upgrading to prefectural-level DSWs; (c) only building new or upgrading to provincial-level DSWs; and (d) mixed scheme.
Source: © The Authors.
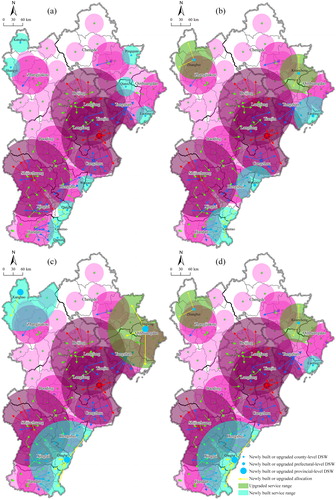
Scheme 1 is shown in , and it suggest that nine county-level DSWs (total) should be built in Pingquan of Chengde City, Kangbao and Shangyi of Zhangjiakou City, Laoting and Qianxi of Tangshan City, Wuqiao of Cangzhou City, Daming and Guantao of Handan City and Qinghe of Xingtai City to ensure coverage for all counties. These nine counties are not equipped with county-level DSWs and are far away from prefectural- and provincial-level DSWs; in addition, they are not covered by surrounding county-level DSWs. The newly built county-level DSW in the first seven counties are used to meet their own demands, and the new DSWs in the latter two counties will also serve 1 and 2 neighbouring counties.
Scheme 2 is shown in , and it suggests that five prefectural-level DSWs (total) should be implemented in Zhangbei of Zhangjiakou City, Kuancheng of Chengde City, Laoting of Tangshan City, Wuqiao of Cangzhou City and Guantao of Handan City to guarantee that all counties are within the service range. Among these counties, Zhangbei and Kuancheng have been equipped with county-level warehouses, although after upgrading them to prefectural-level DSWs, they can each serve two neighbouring counties. The other three counties are not equipped with county-level DSWs. Newly added prefectural-level DSWs in Laoting and Wuqiao can meet their own demands. The newly built prefectural-level DSW in Guantao will also serve six neighbouring counties.
Scheme 3 is shown in , and it suggests that provincial-level DSWs should be newly built or upgraded in three counties (total), that is, Kangbao of Zhangjiakou City, Qinglong of Qinhuangdao City and Qinghe of Xingtai City, to cover the entire region. Among them, Qinglong has been equipped with a county-level DSW that could be upgraded to a provincial-level DSW to serve three neighbouring counties in Chengde City and Tangshan City. The other two counties are not equipped with county-level DSWs. The new provincial-level DSW in Kangbao is used to serve itself and one neighbouring county, and if a new provincial-level DSW is added in Qinghe, then it could serve six neighbouring counties in addition to Qinghe.
The final optimal scheme is shown in , and it suggests the construction of one county-level DSW in Laoting of Tangshan City, two prefectural-level DSWs in Zhangbei of Zhangjiakou City and Kuancheng of Chengde City, and one provincial-level DSW in Qinghe of Xingtai City to ensure coverage for all counties with a minimal construction cost corresponding to the cost of seven county-level DSWs. Among them, the two prefectural-level DSWs are upgraded by the county-level DSWs in Zhangbei and Kuancheng in the north of the BTH region, which can ensure that all counties in Zhangjiakou and Chengde City are covered without the need to build new provincial-level DSWs. Simultaneously, a new county-level DSW in Laoting of Tangshan City can ensure that the county is covered without requiring a new prefectural-level DSW.
4. Discussion
As to achieve resource integration, a HSLA model was developed in this study to address the actual planning concerns for DSWs, which can fully exploit different levels of designated facilities and it is the first in both the preparedness and response domains to consider supplemental optimization in large-scale emergency planning.
Managers can consider either the former three sets of optimized location-allocation schemes or the mixed scheme to expand and build new DSWs based on their desired decision objectives, thus avoiding resource waste. Our final proposed mixed optimal scheme should be a suitable choice for managers with regard to minimizing the total number and cost of the DSWs. Certainly, managers who have other decision-making objectives may also consider other feasible schemes. As shown in , in the spatial allocation results obtained using the HSLA model, a portion of victims is rescued by the designated DSWs and the new DSWs are responsible for the remaining counties that are not covered based on the supplemental location-allocation optimization method. However, the newly built DSWs may be better choices for counties served by the designated DSWs. Consequently, the final spatial allocation schemes of the HSLA model remained slightly irrational as shown in , which was directly related to the priorities of the designated DSWs. Managers can combine the actual situation of the designated and newly built DSWs to make slight adjustments to the proposed allocation schemes so that the counties that originally needed transfers of relief supplies across administrative divisions can be served by the newly built DSWs.
In this study, the service distance for the provincial-, prefectural- and county-level DSWs were preliminarily set to 120 km, 60 km and 30 km, respectively, and these values can be easily adjusted according to the recommendation of the manager. In future work, the service capacity of each DSW and the number and spatial distribution of victims should also be considered. Therefore, the expansion schemes related to the lack of capacity can be provided to the manager, although all levels of the DSW can completely cover all areas of the study area. In addition, the objective function of the location-allocation model can be further improved with the support of construction area data for DSWs at all levels, landscapes and terrain (Venema and Calamai Citation2003), actual evacuation roads and traffic indicators, and the regional risk of the study area. For example, the objective function of the minimum total number of DSWs at all levels can be changed to the minimum construction area. Nevertheless, the two objectives have a certain degree of substitutability because the scheme of the smallest area usually corresponds to the smallest number. Therefore, the results of this study have theoretical and practical significance for optimizing the location and allocation of DSWs in the BTH region.
5. Conclusion
Combined with the actual location-allocation requirements, a multi-level coverage and supplemental site selection concept was adopted to establish a HSLA model for the preparedness and response phases that can minimize the total number and cost of the DSWs for the facility location problem and the total distance at all levels for the supply allocation problem. Solutions were derived by applying a modified PSO algorithm to the HSLA model, which optimizes the location and allocation of DSWs in the BTH region by proposing four sets of supplemental location-allocation schemes. The results show that twelve of the 180 counties, which account for 6.03% of the total area of the BTH region are not covered by county-, prefectural- and provincial-level DSWs. Three sets of optimization schemes for the location-allocation problem for DSWs at the three levels and one final mixed optimal scheme are suggested based on the supplemental optimization site selection. The study can provide scientific, theoretical and technical support for regional government agencies tasked with making emergency management decisions for the preparedness and response phases by illustrating the associated spatial optimization distribution of each scheme.
Acknowledgements
The authors are grateful to the editor and anonymous reviewers for their critical comments and valuable suggestions, which helped to improve the quality of this manuscript substantially.
Disclosure statement
No potential conflicts of interest are reported by the authors.
Additional information
Funding
Notes
1 A county is considered not covered by a DSW if it has no DSW and more than half of its area is not covered by neighbouring DSWs.
References
- Ahmadi M, Seifi A, Tootooni B. 2015. A humanitarian logistics model for disaster relief operation considering network failure and standard relief time: a case study on San Francisco district. Transp Res E Logist Transp Rev. 75(1):145–163.
- Alem D, Clark A, Moreno A. 2016. Stochastic network models for logistics planning in disaster relief. Eur J Oper Res. 255(1):187–206.
- Balcik B, Beamon BM. 2008. Facility location in humanitarian relief. Int J Logist 11(2):101–121.
- Bozorgi-Amiri A, Jabalameli MS, Alinaghian M, Heydari M. 2012. A modified particle swarm optimization for disaster relief logistics under uncertain environment. Int J Adv Manuf Technol. 60(1):357–371.
- Bozorgi-Amiri A, Jabalameli MS, Al-e-Hashem SM. 2013. A multi-objective robust stochastic programming model for disaster relief logistics under uncertainty. OR Spectr. 35(4):905–933.
- Caunhye AM, Zhang Y, Li M, Nie X. 2016. A location-routing model for prepositioning and distributing emergency supplies. Transp Res E Logist Transp Rev. 90(43):161–176.
- Chang MS, Tseng YL, Chen JW. 2007. A scenario planning approach for the flood emergency logistics preparation problem under uncertainty. Transp Res E Logist Transp Rev. 43(6):737–754.
- Davis LB, Samanlioglu F, Qu X, Root S. 2013. Inventory planning and coordination in disaster relief efforts. Int J Prod Econ. 141(2):561–573.
- Doerner KF, Gutjahr WJ, Nolz PC. 2009. Multi-criteria location planning for public facilities in tsunami-prone coastal areas. OR Spectr. 31(3):651–678.
- Duran S, Gutierrez MA, Keskinocak P. 2011. Pre-positioning of emergency items for CARE international. Interfaces. 41(3):223–237.
- Fan H, Tong Z, Zhao X, Mingbao J, Dong G. 2009. Research on emergency relief goods distribution after regional natural disaster occurring. Paper presented at the International Conference on Information Management, Innovation Management and Industrial Engineering.
- Holguín-Veras J, Jaller M, Van Wassenhove LN, Pérez N, Wachtendorf T. 2012. On the unique features of post-disaster humanitarian logistics. J Oper Manag. 30(7-8):494–506.
- Huang R, Kim S, Menezes MB. 2010. Facility location for large-scale emergencies. Ann Oper Res. 181(1):271–286.
- Jia H, Ordóñez F, Dessouky M. 2007. A modeling framework for facility location of medical services for large-scale emergencies. IIE Trans. 39(1):41–55.
- Lu X, Hou Y, Lin W, Shen Q. 2011. Allocation of small-town emergency material depository based on location theory: a case study of Fangshan District in Beijing. Geogr Res. 30(6):1000–1008. Chinese.
- Mete HO, Zabinsky ZB. 2010. Stochastic optimization of medical supply location and distribution in disaster management. Int J Prod Econ. 126(1):76–84.
- National Bureau of Statistics. 2015. China statistical yearbook for regional economy 2014. Beijing: China Statistics Press.
- Noyan N. 2012. Risk-averse two-stage stochastic programming with an application to disaster management. Comput Oper Res. 39(3):541–559.
- Noyan N, Balcik B, Atakan S. 2015. A stochastic optimization model for designing last mile relief networks. Transp Sci. 50(3):1092–1113.
- Özdamar L, Demir O. 2012. A hierarchical clustering and routing procedure for large scale disaster relief logistics planning. Transp Res E Logist Transp Rev. 48(3):591–602.
- Rawls CG, Turnquist MA. 2010. Pre-positioning of emergency supplies for disaster response. Transp Res. B Methodol. 44(4):521–534.
- Rawls CG, Turnquist MA. 2011. Pre-positioning planning for emergency response with service quality constraints. OR Spectr. 33(3):481–498.
- Rawls CG, Turnquist MA. 2012. Pre-positioning and dynamic delivery planning for short-term response following a natural disaster. Socio-Econ Plan Sci. 46(1):46–54.
- Rennemo SJ, Rø KF, Hvattum LM, Tirado G. 2014. A three-stage stochastic facility routing model for disaster response planning. Transp Res E Logist Transp Rev. 62(2):116–135.
- Salmerón J, Apte A. 2010. Stochastic optimization for natural disaster asset prepositioning. Prod Oper Manag. 19(5):561–574.
- Shi P, Shaw R, Ardalan A, Chan EYY, Choudhury JR, Cui P, Fu B, Han G, Han Q, Izumi T, et al. 2018. Fourteen actions and six proposals for science and technology-based disaster risk reduction in Asia. Int J Disaster Risk Sci. 9(2):275–279.
- Swiss Re Institute. 2018. Sigma explorer [online]. Available from: http://www.sigma-explorer.com [Accessed 1 July 2018].
- Tzeng G, Cheng H, Huang TD. 2007. Multi-objective optimal planning for designing relief delivery systems. Transp Res E Logist Transp Rev. 43(6):673–686.
- Venema HD, Calamai PH. 2003. Bioenergy systems planning using location–allocation and landscape ecology design principles. Ann Oper Res. 123(1–4):241–264.
- Xiao J, Hou Y. 2013. Empirical study on the layout optimization of regional emergency material depository: a case study of Changping district, Beijing. Econ Geogr. 33(2):135–140. Chinese.
- Xu W, Ma Y, Zhao X, Li Y, Qin L, Du J. 2018. A comparison of scenario-based hybrid bilevel and multi-objective location-allocation models for earthquake emergency shelters: a case study in the central area of Beijing, China. Int J Geogr Inf Sci. 32(2):236–256.
- Yang F, Yuan Q, Du S, Liang L. 2016. Reserving relief supplies for earthquake: a multi-attribute decision making of China Red Cross. Ann Oper Res. 247(2):759–785.
- Yushimito WF, Jaller M, Ukkusuri S. 2012. A Voronoi-based heuristic algorithm for locating distribution centers in disasters. Netw Spat Econ. 12(1):21–39.
- Zhao X, Xu W, Ma Y, Qin L, Zhang J, Wang Y. 2017. Relationships between evacuation population size, earthquake emergency shelter capacity, and evacuation time. Int J Disaster Risk Sci. 8(4):457–470.
- Zhao X, Xu W, Ma Y, Hu F. 2015. Scenario-based multi-objective optimum allocation model for earthquake emergency shelters using a modified particle swarm optimization algorithm: a case study in Chaoyang district, Beijing, China. PLoS One. 10(12):e144455.