
 ?Mathematical formulae have been encoded as MathML and are displayed in this HTML version using MathJax in order to improve their display. Uncheck the box to turn MathJax off. This feature requires Javascript. Click on a formula to zoom.
Abstract
Meta-heuristic algorithms become common approaches in finding sufficiently good solutions for optimization problems. This study proposed and compared three novel hybrid methods, namely Biogeography-based Optimization (BBO), Gravitational Search Algorithm (GSA) and Grey Wolf Optimization (GWO) in combination with the popular Neural Network classifier for forest fire modeling. Dak Nong province was selected as a case study as it had undergone a critical drought season. One thousand three hundred and thirty-eight historic fired locations during the first several months of 2017 were chosen as dependent variables. On the other hand, topological, climatic and socio-economic data were used as independent predictor variables. For accuracy assessment, root mean square error derivable from the neural network was used as an objective function to be optimized by three proposed algorithms. The results showed that the area under Receiver Operating Characteristic curves (AUC) were in BBO (0.9515), GWO (0.9509), (0.9398) outperformed the Regular neural with backpropagation algorithm (AUC = 0.9271). Even though the differences between prediction results were small, but they were significant by using a paired t-test. It could be concluded that three hybrid models are suitable to map forest fire susceptibility in the selected study area and could be considered as alternative methods for studying forest fire in other locations.
Keywords:
1. Introduction
The meta-heuristic optimization algorithm is the most widely used methods in searching for optimal values in global optimization applications, not only in computer sciences but also in different fields. It is mainly inspired by behaviors of natural phenomena that can be grouped into typical processes, namely physical based, evolutionary based and population-based. Those nature processes are mimicked to generalize artificial procedure for specific applications. The growing popularity of Meta-heuristic has been proven through examining its simplicity, flexibility, deprivation-free mechanisms and capability to avoid local optimum (Mirjalili et al. Citation2014) and to solve complex non-linear problems. It outperforms classical optimization algorithms when study size and dimensions increase (Rashedi et al. Citation2009).
Recently, meta-heuristic algorithms have been used for optimizing parameters of common single classifiers. Among all classifiers, the neural network is considered as one of the most popular algorithms in binary classification. It had been used in hybrid forms with swarm intelligence optimization techniques such as artificial bee colony optimization (Karaboga and Ozturk Citation2009), Firefly Algorithm (Mandal et al. Citation2015), Cuckoo Search Algorithm (Mohd Nawi et al. Citation2013) or Particle Swarm Optimization (Rakitianskaia and Engelbrecht Citation2012). These optimization algorithms improved the back-propagation procedure in the training process, particularly the weakness of the conventional gradient-based techniques in adjusting weights since it often gets trapped in local optima (Mavrovouniotis and Yang Citation2015). The combination had been examined and applied in several disciplines, but few were used for spatial modeling or specifically for forest fire mapping.
Optimization is under rapid development, with the aggressive investigation of new algorithms to solve broad ranges of real problems. Recent research focusing on machine learning frameworks for forest fire mapping could be found in Chen et al. (Citation2012), Pourghasemi (Citation2016), Satir et al. (Citation2016) or in hybrid forms as in Tien Bui et al. (Citation2016b), Tien Bui et al. (Citation2016a). Since forest fire is significantly subject to geographic location and if variations of triggerable physical and socio factors change, the predictive capability of models might change. In fact, no specific model is suitable for all problems, due to the nature of the problem. For the best of knowledge, to partly fill up research literature, this article proposed novel methods employed recently developed optimization techniques namely Biogeography-based optimization (BBO), Gravitational Search Algorithm (GSA) and Grey Wolf Optimizer (GWO) in combination with a neural network to map forest fire susceptibility. Although three proposed algorithms have been tested in several case studies and by using benchmark cost functions (Rashedi et al. Citation2009; Mirjalili et al. Citation2014), none were found in forest fire research.
Dak Nong tropical province, a highland area of Vietnam, was selected as a case study as it had recently undergone severe drought and the broader region is subject to the threat of forest fire. Thus, three proposed models might support in finding out the most susceptible areas to fire, in referencing to influential factors of the study area. With this aim, the rest of the article is divided into sections as follows: the next section aims at describing study area, input database and methodology; the third provides an overview of prototype models; results of the models are presented and discussed in the fourth part. Conclusion and remarks are in the final section.
2. Data and method
2.1. Study area
In Vietnam, 42.1% of the natural land is forested, including 10.4 million ha of natural forests and 3.5 million ha of plantation forests (Ha Citation2013). A large area of total forest cover is susceptible to fire, in which drivers of fire are dependent on types of forests and region variation (Thuy et al. Citation2012). Deforestation and forest degradation continue to be critical threats in the province forest cover. Causes of forest loss can be sourced from fire, illegal logging, land conversion and inefficient management. In fact, there is a significant pressure of population growth on forest resources because of increased demand for residential land and land for crops production. The study area is located in the Central Highlands region of Vietnam (), and it is characterized by complex topography and variation of physical, climatic and socio conditions. Forest cover significantly contributes to the province through tourism, logging, and other forest-based activities and good forest fire governance will maintain the sustainability of the provincial economy.
Figure 1. Study area (in Dak Nong province, Vietnam).
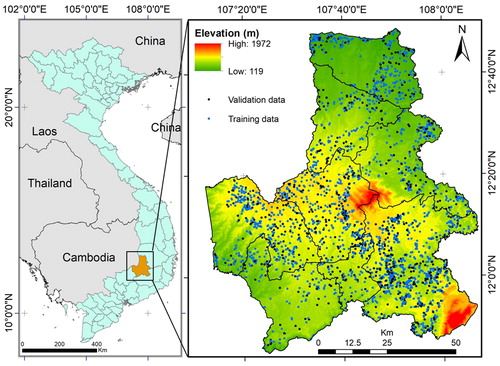
For the first several months of 2017, the province had undergone a drought season that is mainly due to loss of forest and vegetation cover. The additional impact could be seen in increasing temperature due to the reflectance of heat radiation from bare lands. During this period, more than 1300 fire locations had been identified by NASA satellite systems. Detail description of the extraction procedure of fire locations and possible driving forces are investigated in the next section.
2.2. Predictor variables
Commonly in forest fires, factors derived from topography, climate, physical environment and socio-economic groups are selected to build up predictor variables. To examine the models, almost similar influential input factors as documented in the literature (Suryabhagavan et al. Citation2016; Tien Bui et al. Citation2016a) were used for this study. Elevation, aspect, and slope; were processed from Aster DEM that is downloadable from https://geoexplorer.usgs.gov. Air temperature, humidity, wind also known as climatic factors were gathered from local meteorological stations. Also, physical-environment variables such as Normalized Difference Vegetation Index (NDVI), Normalized Difference Moisture Index (NDMI) and Land Surface Temperature (LST) were generated by using land surface reflectance products from Landsat 8 OLI. The satellite land surface reflectance products on March, 11th, 2017 was downloaded from https://geoexplorer.usgs.gov.
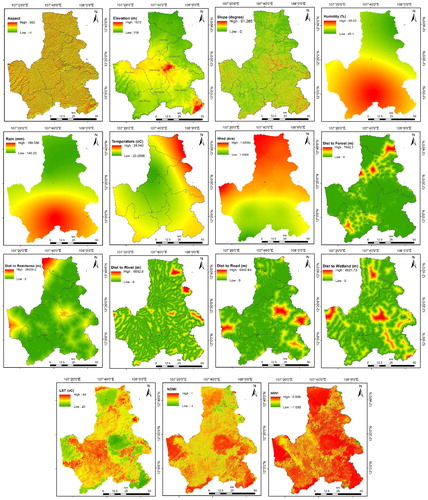
The last social-economic group consists of landuse-derived data including Euclidean distances from certain types of land use namely: residential area, forest cover, wetland, road, and river network. All layers in the dataset were converted into 30 m × 30 m spatial resolution raster in WGS1984, UTM zone 48 projection. Detail description and symbolization of variables are shown in . The similar color ramp was used to simply symbolize each predictor variable as the lowest value was assigned ‘green’, and the highest value got ‘red’. In fact, the representing color does not reflect any correlation between each variable and the likelihood to catch fire.
Figure 2. Predictor variables – aspect, elevation, slope, humidity, rain, temperature, wind, distance to forest, distance to residence, distance to river, distance to road, distance to wetland, LST, NDMI and NDVI.
The further preliminary analysis also was carried out to filter out non-predictive variables, since variable redundancy might increase the complexity of classification models and might even reduce model accuracy. For this purpose, correlations between every two variables were measured by using Pearson correlation technique. The results showed that none of the absolute value of coefficients is higher than 0.7 that is the critical threshold to decide whether variables should be kept or removed. The values in reaffirmed that all 15 variables are significantly eligible and could be used to run the models.
Table 1. Correlation cross-validations.
2.3. Historical forest fires
All fifteen variables were taken into consideration when studying forest fire since the locations of fire are presumably subject to variation of geographical and environmental conditions. At present, global historical forest fire locations are being generated by several specific algorithms from current satellite systems from NASA’s Earth Observing System and Information System and other non-NASA Space missions. For this study, the locations of fire were collected from Nasa at (https://earthdata.nasa.gov/earth-observation-data/near-real-time/firms/active-fire-data) from November 2016 to April 2017, since this period was characterized as dry season in the study area and fire was most likely triggered during this period. Fire data was further processed to filter out points with confidence level smaller than 50% in MODIS instrument and normal confidence level in VIIRS instrument. In total, 1338 forest fire locations were gathered.
Since this article aims at investigating binary classification models, the same non-fired points were needed and were randomly selected outside of conditional fire-prone areas. Non-forest cover areas were chosen as the boundary for non-fire identification as fire fuel was not available in the areas. In total, 1338 fired points and 1338 non-fired points were used to construct input databases as shown in .
2.4. Back-propagation neural network
Introduced by Rumelhart et al. (Citation1986), the neural network is one of the most powerful and common binary classification technique. The network is intensively trained through adjusting weights by the back-propagation algorithm, usually by gradient-search. The popular topology of neural network consists of input layers, output layers and hidden layers where weights are trained. As supervised learning, outputs from the network are compared to desired (observed values) and how much weights are adjusted depending on the magnitude of the differences.
In classification research, the neural network can be trained by manipulating weights with fixed network architecture or can be optimized to select optimal numbers of neurons and how they connect to input and output layers. The first approach was found in some publications (Karaboga and Ozturk Citation2009; Rakitianskaia and Engelbrecht Citation2012; Mohd Nawi et al. Citation2013; Mandal et al. Citation2015) where root mean square error (RMSE) was used as objective function and weights were tuned to minimize RMSE value (EquationEquation 1(1)
(1) ). Meta-heuristic algorithms were used to avoid the local optimum trap. The second was described in Islam et al. (Citation2014) where the Generic algorithm was used to optimize the structure of the neural network and back-propagation was still used to train the network. Depending on classification problem and type of dataset, either the first or the second approach will be used. In this study, three algorithms were deployed to optimize RMSE by tuning neural network weights. Detail of proposed algorithms is described in the following section.
2.5. Meta-heuristic optimization algorithms
Population-based optimization family has been used to solve engineering application, but few were found in spatial variation studies or forest fire research specifically. Three newly developed algorithms were examined with forest fire data of Dak Nong province, namely Biogeography-Based Optimization (BBO), Gravitational Search Algorithms (GSA) and Grey Wolf Optimization (GWO). The author coded the optimizations by using Matlab software, and the description of those is in next section.
2.5.1. Biogeography-based optimization (BBO)
BBO is a member of evolutionary algorithms that are suitable for not well-behaved functions. It was first introduced by Simon (Citation2008). Its underlying mathematic principals mimic living nature of species through migration, mutation processes. Triggers of each activity are depended on specific conditions such as Habitat Suitability Index (HIS) that is characterized by climatic condition, vegetation cover, and topography. Islands with high HIS attracts species from Islands with lower HIS, that is low HIS islands have high emigration rate and low immigration rate and by versus. Those solutions that are good are considered to be habitats with a high HSI, and those that are poor are supposed to be habitats with a low HIS. Also, HIS is determined by Suitability Index Variables (SIV) that are influential factors in this study. HIS is considered as fitness functions as in different evolution algorithms.
2.5.2. Gravitational search algorithm (GSA)
Inspired by Newton’s law of gravity and interaction of mass, this recently developed physical-based algorithm has been widely used to solve non-linear problems (Rashedi et al. Citation2009). The popularity of this algorithm derives from its simplicity of having only two parameters and its capability to find near global optimum solutions (Kumar and Sahoo Citation2014). Specification of each particle in GSA is defined by its position, initial mass, active gravitational mass and passive gravitational mass. Interactions between particles and by gravity result in changes in positions of particles and their velocities, therefore fitness values of all particles are updated, and the best value is replaced with new one. The iteration continues until meeting stopping criteria or desired fitness value.
2.5.3. Grey Wolf Optimizer (GWO)
Lately developed and presented by Mirjalili et al. (Citation2014), the social structure and hunting behaviors of Grey Wolf was investigated to derive GWO. The hierarchical structure of the wolf pack is structured on four levels. The first is the leader (α) which controls all activities of the pack. The second is the next level wolfs (β) that support the leader in making a decision and coordinate activities. The rest third and fourth level wolfs contribute to all activities of the pack, and they receive orders from the leaders. The movement of wolfs is tracked in the hunting process including tracking, encircling and attacking preys. This movement is simulated, and the final optimum solution is the position of the leader wolf (α).
3. Proposed hybrid models for forest fire mapping
3.1. Input data initialization
As new algorithms are usually tested with benchmark datasets (Mirjalili et al. Citation2014), for this new application, the performance quality of classification models are subject to proper selection of input variables. On the other hand, data types also influence the accuracy of specific models due to model structure and types of algorithms. Commonly, each data layer is prepared in one of the four conventional measurements, namely nominal, ordinal, ratio and interval types. For this study, aiming at employing neural network, original values of all layers were kept remained, but the input database was standardized into similar measurement ranges, even though standardization is not strictly required in the neural network model. By which min-max normalization was used through the following equation:
2676 point samples were randomly split into two packs of which the first 70% pack was used for training, and the other 30% pack was used for validation as shown in . Each sample had 15 variables or 15 dimensions in optimization terminology.
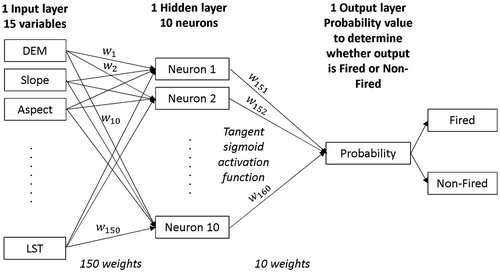
Figure 3. Neural network topology.
3.2. Initialization of model parameters
For neural network application, the network topology is determined by input datasets. Several network topologies had been proposed by using specific benchmark datasets as mentioned in Mavrovouniotis and Yang (Citation2015). The initialization of models parameters was twofold, including initializing neural network parameters and parameters of three proposed optimization algorithms. As previously described, the neural network structure consists of multiple layers. Of which the first input layer was defined by 15 variables as shown in . The output is a two-class layer, holding an output value of fired or non-fired. The most complicated issue was to properly define how many layers in the hidden box as well as a number of hidden neurons. In fact, there is no controversial standard to design structure of hidden layers, but some argued that the only one hidden layer cloud solve all classification problems and the optimal number of neurons should be between a number of input variables and output classes (Heaton Citation2008). From the trial-error process, this study came up with optimal network topology for forest fire study as shown in , in which Tangent sigmoid was chosen as activation function in both Hidden layer and Output layer.
For this topology, initial parameters of neural network included 160 weight values. Three proposed optimization algorithms aimed to optimize 160 weight values to minimize RMSE as described in (EquationEquation 1(1)
(1) ). For each model, 160 were defined by the structure of algorithms such as Suitability Index Variables in BBO or Dimensional positions of particles in GSA or Position of the wolf in GWO. Other initial parameters should also be appropriately determined. Descriptions of other main settings are shown in . Apart from similar values, each algorithm consists of its controlling values.
Table 2. Initial parameters of three algorithms.
4. Results and discussions
The overall workflow of this study is described in , in which three optimization algorithms were alternatively used. All three models were set to iterate for 1000 times, even though RMSEs kept slightly decreasing at this point. From , GSA seems to run horizontally after 400 iterations, while BBO and GWO rapidly fell from the first 200 iterations and gradually decreased until they reached 1000 iteration. BBO and GWO ended up with relative smaller RMSE at 13.4 and 14.1 respectively than GSA and regular neural network at around 14.6 and 15.1 respectively. Also, the performances of three proposed models were compared to the regular neural network running backpropagation algorithms by using Receiver Operating Characteristic curves (ROC), area under ROC curves (AUC) and error rate curves. By comparing AUCs, which could be observed from , the AUC of BBO (0.9515) and AUC of GWO (0.9509) were slightly higher than AUC of GSA (0.9398) and AUC of MLP (0.9271). It could be concluded that with this input dataset, BBO outperformed the rest.
Figure 4. Workflows of proposed models.
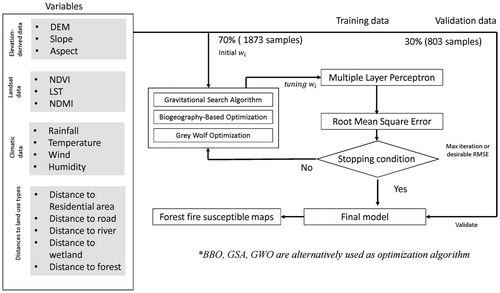
Figure 5. RMSE after 1000 iterations.
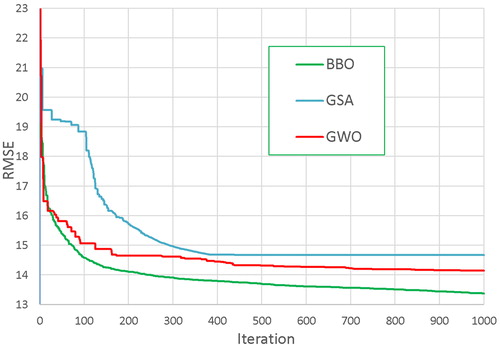
Figure 6. ROCs (a) and Error rate curves (b) of four models.
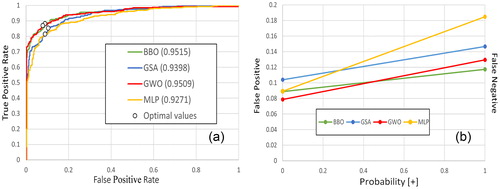
Along each ROC curves, an optimal point had been identified and displayed as small circles in . Mathematically, the distances from these points to the top-left corner of the graph in are smaller than all distances connecting points along ROCs to the top-left corner. Practically, these points represent thresholds, at which the overall accuracies achieve highest values. For each optimal points, a pair of False Positive value and the False Negative value was identified.
In addition to ROCs, Error rate lines are a different kind of display to represent an error rate of a classifier. The lines are constructed by connecting the False Positive value to False Negative value for each optimal points. Assuming the cost of misclassification of positives and negatives is equal, the points where two lines intersected, represent a balanced performance of the lines. From that plot, if p[+] is larger than about 0.47 (the crossing point between BBO and GWO), then BBO outperformed GWO at p[+], and if p[+] is smaller than 0.47, then GWO is better than BBO.
4.1. Spatial and temporal dependency and data mining
Normally, the spatial dependency issue is raised when studying the variations of the geographic phenomenon that is near things tend to be more similar than distant things both in space and in time. If the issue exists, the classification/regression models result in low accuracy; for example, low coefficient determination in ordinary least squares regression. Geographically Weighted Regression, spatial-auto-logistic regression had been proposed as alternatives to address this issue.
On the other hand, data mining techniques are considered as another approach to handling spatial distribution (Cheng et al. Citation2014) and are exemplified by three hybrid models in this study. Through accuracy assessment, the prediction results of the models provided good examples of how data mining technique can be applied in forest fire study that is spatial and temporal-dependent issues. In fact, both spatiality and temporality should be taken into consideration in forest fire research as dataset was collected in the sequence of time and throughout the study area. It could be seen that all fifteen variables tend to be more similar if the distances between locations are small, that is their spatial and temporal relationships exist in both metric (Distances to land use types, NDVI, Elevation…) and Non metric (Aspect, Elevation.) and temporal scale (collection of forest fire during specific duration). In many cases, when the period for data collection is extended, the volume and dimensions of datasets get enlarged, and the data mining techniques might be helpful for this application.
4.2. Generation of maps and visual comparison
From the training above and validation processes, the neural network structure was defined with three sets of parameters, each of them consisted of 160 weight values. This neural network was further used to generate forest fire susceptibility maps in the study area. In sequential order, the study area was prepared in 30 m × 30 m raster format, and then raster was converted into points by using QGIS software. The point layer was assigned values from 15 variable rasters as mentioned in , basing on spatial references. The point data with fifteen attributes were considered as ‘unseen’ and was used to generate the probability of being caught in fire by using Matlab. The prediction output with probability values was converted back to raster using QGIS. The range of probability value is between 0 and 1, in which 0 mean the lowest probability to be caught in fired and 1 means highest probability. This numerical range was broken into five classes by using conventional natural break method and assigned five verbal representations as also mentioned in Tien Bui et al. (Citation2016b), namely Very Low (0–0.11), Low (0.12–0.34), Moderate (0.35–0.58), High (0.59–0.82), Very High (0.83–1). Small portions of entire study areas (as illustrated by a red square in the bottom right map) were selected to display as shown in .
Figure 7. Forest fire susceptibility mapping in a small subset of the study area – by clockwise order BBO, GWO, GSA and MLP.
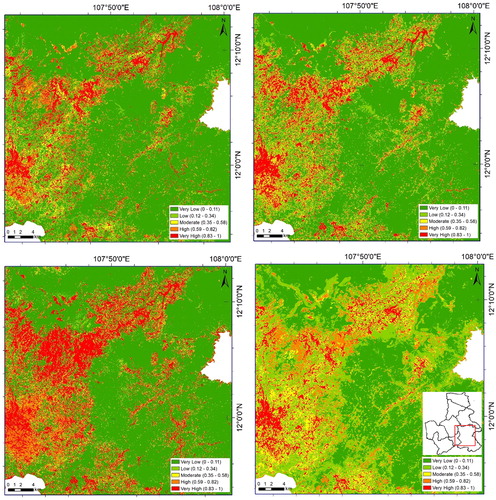
From , it could be seen that the ROCs of BBO and GWO followed a similar route in almost all positions in the graph and visually the spatial distribution of susceptibility maps by using three hybrid models were relatively similar. Particularly, BBO and GWO are identical in almost all probability value ranges. Since the difference between the area under ROCs of the three proposed models is small at around 1%, an additional measure was used to test if the difference was significant. For those set of numeric data, paired t-test was used and the results were shown in . p values of all cases are smaller than 0.05 that means the differences are significant.
Table 3. Cross paired t-test of four algorithms.
5. Conclusion and future remarks
This work enriched the literature with an example to deploy three newly developed algorithms to optimize neural network parameters and their application in forest fire study. The good performance of those models indicated their capabilities in modeling complex non-linear problem. Experimental results show that the number of neural network parameters are much dependent on predictor variables and determine the initialization of optimization algorithms and their running processes. In this study, BBO, GSA, and GWO improved the predictive ability of the neural network as their performance indicators are better than a regular neural network - backpropagation algorithm. These algorithms overcome the weakness of being trapped in the local optimum of the traditional method through comparing RMSE, ROCs and Area under ROCs, and visual comparison of forest fire susceptibility maps. Thus, three hybrid models can be used as alternative methods for forest fire study.
In fact, controlling factors of forest fire are subject to climatic, physical and social conditions. Proper selection and preprocessing of input data are needed to secure data adequateness and to avoid data redundancy, but still, represent all aspect problem nature. In this case study, the predictors variable conforms to the first law of geography that near things tend to be similar than things that are far apart. So that, the spatial and temporal dependency exists, and these nature have been successfully addressed.
Dak Nong was selected as a case study since the province had undergone a severe drought season that influence fire occurrence and characteristics. The forest is crucial to local human activities, but the socio-economic development has replaced a large area of forest with built-up features. However, the remaining forest cover is subject to fire, particularly in the context of climate change and good forest fire governance could benefit local communities and retain a sustainable forest growth. Therefore, the results of this study can be used either in scientific references for future works or reference maps for forest fire management activities.
Disclosure statement
No potential conflict of interest was reported by the author.
Additional information
Funding
Related Research Data
References
- Chen X, Karpatne A, Chamber Y, Mithal V, Lau M, Steinhaeuser K, Boriah S, Steinbach M, Kumar V, Potter CS, et al. 2012. A new data mining framework for forest fire mapping. Paper presented at the 2012 Conference on Intelligent Data Understanding (CIDU), Boulder, CO, USA.
- Cheng T, Haworth J, Anbaroglu B, Tanaksaranond G, Wang J. 2014. Spatiotemporal data mining. In Fischer MM, Nijkamp P, editors. Handbook of regional science. Berlin: Springer; p. 1173–1193.
- Ha CT. 2013. Vietnam National Forest Status of 2012. Ha Noi: Ministry of Agriculture and Rural Development.
- Heaton J. 2008. Introduction to neural networks for Java. 2nd ed. Chesterfield: Heaton Research.
- Islam D-B, Baharudin Z, Raza MQ, Nallagownden P. 2014. Optimization of neural network architecture using genetic algorithm for load forecasting. Paper presented at the 2014 5th International Conference on Intelligent and Advanced Systems (ICIAS), Kuala Lumpur, Malaysia.
- Suryabhagavan KV, Alemu M, Balakrishnan M. 2016. GIS-based multi-criteria decision analysis for forest fire susceptibility mapping: a case study in Harenna forest, southwestern Ethiopia. Trop Ecol. 57(1):33–43.
- Karaboga D, Ozturk C. 2009. Neural networks training by artificial bee colony algorithm on pattern classification. Neural Netw World. 19:279–292.
- Kumar Y, Sahoo G. 2014. A review on gravitational search algorithm and its applications to data clustering & classification. I.J. Intell Syst Appl. 6:79–93. doi:10.5815/ijisa.2014.06.09
- Mandal S, Saha G, Pal R. 2015. Neural network training using firefly algorithm. Glob J Adv Eng Sci 1(1):7–11.
- Mavrovouniotis M, Yang S. 2015. Training neural networks with ant colony optimization algorithms for pattern classification. Soft Comput. 19(6):1511–1522. doi:10.1007/s00500-014-1334-5
- Mirjalili S, Mirjalili SM, Lewis A. 2014. Grey Wolf Optimizer. Adv Eng Softw. 69:46–61. doi:10.1016/j.advengsoft.2013.12.007
- Mohd Nawi N, Khan A, Rehman Gillani SM. 2013. A new back-propagation neural network optimized with cuckoo search algorithm. Paper presented at the Computational Science and Its Applications – ICCSA 2013. Lecture Notes in Computer Science, vol. 7971.
- Pourghasemi HR. 2016. GIS-based forest fire susceptibility mapping in Iran: a comparison between evidential belief function and binary logistic regression models. J Scand J For Res 31(1):80–98. doi:10.1080/02827581.2015.1052750
- Rakitianskaia AS, Engelbrecht AP. 2012. Training feedforward neural networks with dynamic particle swarm optimisation. Swarm Intell. 6(3):233–270. doi:10.1007/s11721-012-0071-6
- Rashedi E, Nezamabadi-pour H, Saryazdi S. 2009. GSA: a Gravitational Search Algorithm. Inf Sci. 179(13):2232–2248. doi:10.1016/j.ins.2009.03.004
- Rumelhart DE, Hinton GE, Williams RJ. 1986. Learning internal representations by error propagation. In David ER, James LM, Group CPR, editors. Parallel distributed processing: explorations in the microstructure of cognition. Cambridge, MA: MIT Press; vol. 1, p. 318–362.
- Satir O, Berberoglu S, Donmez C. 2016. Mapping regional forest fire probability using artificial neural network model in a Mediterranean forest ecosystem. Geomat Nat Hazards Risk. 7(5):1645–1658. doi:10.1080/19475705.2015.1084541
- Simon D. 2008. Biogeography-based optimization. IEEE Trans Evolut Comput. 12(6):702–713. doi:10.1109/TEVC.2008.919004
- Thuy PT, Moeliono M, Hien NT, Tho NH, Hien VT. 2012. The context of REDD+ in Vietnam: drivers, agents and institutions. CIFOR Occasional Paper (75).
- Tien Bui D, Bui Q-T, Phi Q, Pradhan B, Nampak H, Trinh P. 2016a. A hybrid artificial intelligence approach using gis-based neural-fuzzy inference system and particle swarm optimization for forest fire susceptibility modeling at a tropical area. Agric For Meteorol. 233:32–44. doi:10.1016/j.agrformet.2016.11.002
- Tien Bui D, Le TK-T, Nguyen CV, Le DH, Revhaug I. 2016b. Tropical forest fire susceptibility mapping at the Cat Ba National Park Area, Hai Phong City, Vietnam, using GIS-based kernel logistic regression. Remote Sens, 8(4):347. doi:10.3390/rs8040347