
 ?Mathematical formulae have been encoded as MathML and are displayed in this HTML version using MathJax in order to improve their display. Uncheck the box to turn MathJax off. This feature requires Javascript. Click on a formula to zoom.
Abstract
Detecting landslides using remote sensing images involves converting gray level images into binary images. Given the complex background and non-uniform illumination in the regional remote sensing image, the commonly-used global thresholding methods are limited to interpret some landslides those hidden in the shadow. In this paper, we report on an enhanced image thresholding method for the noncontact detection of earthquake-induced landslides. The proposed method incorporates Monte-Carlo simulation into the local thresholding method, and essential issues, regarding complex illumination condition and uncertainties of determining block size in local thresholding method, are addressed. To better separate landslide candidate objects from the background, we incorporate Digital Surface Model (DSM) into the binary image, such that the interferences by built-up areas, terraces, and rivers can be significantly reduced considering the indicator of slope gradient. The described method has been tested using two benchmark tests, showing that the proposed method performs well dealing with the complex background and illumination condition. As a case study, we use the proposed method to detect landslides in a remote sensing image near Beichuan area after the 2008 Ms8.0 Wenchuan earthquake. Results demonstrate that the presented method interprets landslides resembling those of manually visual delineation.
1. Introduction
Landslides are often triggered by strong earthquakes (Zhang et al. Citation2015). These earthquake-induced landslides are a kind of dynamic process reshaping landscape, endangering human lives and infrastructure facilities in mountainous regions. The 1999 Ms7.6 Chi-Chi earthquake and the 2008 Ms8.0 Wenchuan earthquake for instance, respectively 9,272 and 60,104 landslides were reportedly induced (Chang et al. Citation2005; Yin et al. Citation2009; Gorum et al. Citation2011). These landslides could be remobilized by the heavy precipitations and transit into debris flows, posing a great threat to the local society in the following decades (Han et al. Citation2015a; Han et al. Citation2018). In this context, detecting and delineating these earthquake-induced landslides is therefore of great relevance for disaster prevention and mitigation (Rosin and Hervás Citation2005). Several lines of evidence have also supported the importance of landslides detection (Parker et al. Citation2011; Han et al. Citation2015b; Roback et al. Citation2018).
With the boom of high spatial resolution optical imagery from multi-platforms (e.g., orbital satellites, aerial crafts), remote sensing technique is increasingly applied not only in land management but also to assist in delineating landslide surface boundaries. Synthetic Aperture Radar (SAR) is one optional solution for this purpose. Differential SAR interferometry (DInSAR) has proved able to detect centimetric displacements for earthquake-induced landslides (Vietmeier et al. Citation1999; Refice et al. Citation2000). However, the application of DInSAR technique in landslide detection is often constrained because of the limitation with respect to inadequate spatial resolution, atmospheric effects, and especially signal phase decorrelation due to vegetation and soil moisture changes (Rosin and Hervás Citation2005).
As an indispensable component of remote sensing technique, digital aerophotogrammetry has proved feasible to detect the change of earth surface because of their high resolution and low cost. Usually, panchromatic (PAN) images are available for a catastrophic earthquake event. Landslides could be distinguished by their gray levels, which are used as an evidence for delineating these landslides. Traditional visual interpretation of these remote sensing photographs is the major solution for delineating landslides. However, artificially interpretation is rather experience-based, and the interpretation process is tedious and time-consumed (Li et al. Citation2014). In this context, it will be beneficial to pre-process these remote sensing images by highlighting the landslides before interpretation.
Binary image representation in textual image techniques is one of the preferred formats for image analysis (Stathis et al. Citation2008). It aims at distinguishing foreground from background. Kefali et al. (Citation2010) illustrated that the binarization process decreases the presence of unwanted data and preserves only the desired data in the image. This technique could be applied in landslides detection in remote sensing images, by converting all pixels into two categories, i.e. landslides, and background, with separated colors (e.g. black and white). Pre-processing of remote sensing images removes the unnecessary information to increase the visibility of the useful information (Bataineh et al. Citation2011; Lech et al. Citation2015) and therefore accelerates the extraction and recognition process of the landslides.
A robust, automatic, and efficient binarization algorithm is required to attain a satisfactory binary result. Following Sezgin and Sankur (Citation2004) and Chou et al. (Citation2010), Wen et al. (Citation2013) classified the up-to-date binarization methods into three major categories, clustering-based methods, threshold-based methods, and hybrid methods. In general, the threshold-based methods permit to rapidly binarize the images with one or many thresholds. Common wisdom holds that the threshold-based methods include two sub-categories: global thresholding methods and local thresholding methods (Stathis et al. Citation2008; Kefali et al. Citation2010; Bataineh et al. Citation2011; Wen et al. Citation2013). The global thresholding methods derive an overall threshold for the entire image. Each pixel of the image is binarized according to this threshold. Remarkable work is Otsu’s algorithm. As introduced in Pai et al. (Citation2010), Otsu’s algorithm decides a global threshold based on the maximum of the between-class variances. The global thresholding method is advanced in its simple implementation and high computation efficiency (Poletti et al. Citation2012).
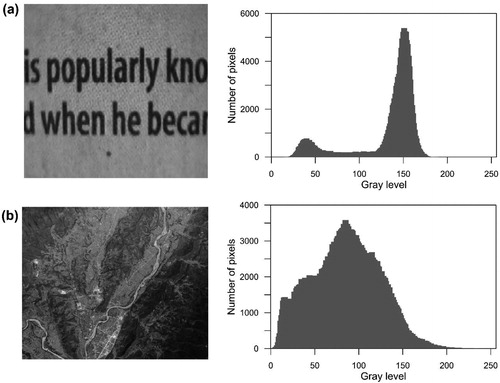
Logically, the simple thresholding methods will be better when using pre-processing and post-processing (Bataineh et al. Citation2011). In fact, in our previous studies (Li et al. Citation2014), we classified the histogram of the images into three categories and claimed that the global thresholding methods perform well when the histogram approximates a balanced bimodal type (document image for instance in ). However, regional remote sensing image commonly covers a wide range of landscape, containing various background patterns, multiple noises and illumination levels, shadow areas also increases the interference. As shown in , the histogram of the remote sensing image approximates a mixed unimodal type. In this case, the global thresholding methods are often limited to interpret objects from the image (Gatos et al. Citation2006).
Figure 1. Histogram of different image sources. (a) document image with homogeneous background and uniform illumination (Image from Wen et al. Citation2013). (b) remote sensing image with inhomogeneous background and complex illumination (Image was taken after Ms 7.0 Lushan earthquake in April 20, 2013).
To solve the existing limitations of the global thresholding method, the local thresholding methods become a means of solution. The local thresholding methods compute many local thresholds based on the information contained in the neighborhood of each pixel, or a small region of the image independently. Hence, they are also referred as the local adaptive thresholding methods (Pai et al. Citation2010). Some remarkable works have been done by previous studies (e.g., Bernsen Citation1986; Niblack Citation1986; Sauvola and Pietikainen Citation2000; Yanowitz and Bruckstein Citation1989; Taxt et al. Citation1989; Eikvil et al. Citation1991; Gatos et al. Citation2011; Wen et al. Citation2013). Following studies also proposed some compound algorithms to improve the performance of the local threshold method (e.g., Chou et al. Citation2010; Tong et al. Citation2009; Zhang and Yang Citation2010). By adding some preparatory steps to an existing simple thresholding method, effect of varying levels of noise and complex illumination on the binarization can be minimized.
However, these sophisticated compound methods are often costly and complex to design. Moreover, the value of some required factors should be determined manually. Some studies (e.g., Trier and Jain Citation1995; Khurshid et al. Citation2010; Pai et al. Citation2010) have evaluated well-established local thresholding methods, indicating that Niblack’s method, Sauvola’s method, and NICK’s method may perform better. Unfortunately, as illustrated by Bataineh et al. (Citation2011), the above-mentioned methods are based on adaptive thresholding algorithm in fixed square blocks, which means they are scale-dependent and require empirical tuning of the block size. Nevertheless, block size has long been substantiated having a significant influence on the binarization results (Wu and Amin Citation2003). Uncertainties of block size, therefore, challenges the application of the local threshold method. Firstly, the best-fitting block size varies case by case, lacking a widely accepted criterion. Secondly, local binarization in the fixed block is likely to generate interference left between two neighbored blocks (Wen et al. Citation2013), because the binarization result in the neighbored block may be opposite. We call this kind of interference ‘the boundary effect’ and find that it is difficult to eliminate in post-processing. As such, although the concept of the intelligent block has been proposed by Pai et al. (Citation2010), challenges still remain in the field of image binarization, especially in the application of landslides detection using regional remote sensing image.
The object of this study is to present an enhanced local binarization method for landslides detection using remote sensing image. The proposed method incorporates Monte-Carlo simulation into the local thresholding method, and two essential issues, regarding complex illumination condition and uncertainties of determining block size in local thresholding method, are addressed. To better separate landslide candidate objects from the background, we incorporate Digital Surface Model (DSM) into the binary image, such that the interferences by built-up areas and rivers can be significantly reduced considering the indicator of slope gradient. Two benchmark tests are introduced to evaluate the performance of the presented method, and the application of landslides detection in Beichuan area after Ms 8.0 Wenchuan earthquake is conducted. Results show that it will be an alternative solution for dealing with the images of complex background and will be suitable for detecting landslides using remote sensing image.
2. Methodology
The presented method is based on Otsu’s thresholding algorithm; consequently, we begin our study with a review of Otsu’s algorithm.
2.1. Review of Otsu’s thresholding algorithm
Otsu’s thresholding algorithm (Otsu Citation1979) is a clustering-based automatic thresholding method. It has been regarded as one of the best global techniques and measures region homogeneity by variance.
Generally, pixels of a given image can be represented in gray levels
. The purpose of Otsu’s method is to derive a threshold
to separate the gray levels into two classes,
representing objects, and
representing background. The number of pixels at gray level
is denoted by
. The total number of the pixels of the image can be expressed as
(1)
(1)
The gray-level histogram is normalized and regarded as a probability distribution
(2)
(2)
As demonstrated above, pixels are separated into two classes and
. The probabilities of each class occurrence can be expressed as
(3)
(3)
and the class mean levels of each class can be written as
(5)
(5)
(6)
(6)
(7)
(7)
where and
denote the probabilities of object class and background classes, respectively.
,
, and
refer to the average gray levels of the object, the background, and the global image. Given these variables, the class variances are
(8)
(8)
where and
are the variances of the object class and the background respectively. EquationEquation (8–9) and EquationEquation (3–4) reduce to the within-class variance
, the between-class variance
, and the total variance of levels
, which equate
(10)
(10)
In the discrimination analysis, the separable degree of the class is
(13)
(13)
Finally, a threshold , resulting in maximal
, is selected as the optimal threshold in the Otsu’s global thresholding method.
Comparing to Niblack’s and Sauvola’s local thresholding method as introduced in Section 1, although Otsu’s method is much easier in selecting a simple threshold for the entire image, avoiding uncertainties of block size, it is limited to yield acceptable binary result when images contain complex background and illumination.
2.2. The proposed thresholding method
The aim of the presented method is to address the binarization challenge due to complex background and illumination when dealing with regional remote sensing image. In line with the inspirations of previous local thresholding methods, we propose an enhanced local thresholding method integrating with Monte-Carlo simulation. Notably, the proposed method is beneficial to avoid the uncertainties of local block size and minimize the interference due to the so-called boundary effect. The proposed method is composed of four major steps as described below.
2.2.1. Configuration of Monte-Carlo simulation
The first step of the proposed method is to configure Monte-Carlo simulation. The Monte-Carlo method uses repeated random sampling to simulate data for a given mathematical model and evaluate the outcome. In this sense, the core of the Monte-Carlo simulation is to create a large, random data set such that uncertainties of inputs can be covered by this data set (Han et al. Citation2015). The total number of this data set is named of the Monte-Carlo steps . For instance,
refers to that the procedure will repeat 100 times. Ideally, the greater
generates better data set for the following analysis. However, it linearly increases the amount of computation.
2.2.2. Image partitioning with random block size
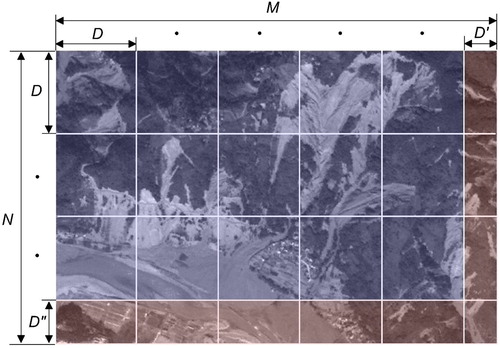
In each step of Monte-Carlo simulation, the original gray-level image is imported. refers to the gray-level image with size
, where
represents the coordinate of each pixel in the image. We use square blocks with uniform size to partition the entire image. As mentioned in Section 1, block size has a significant influence on the binarization results (Wu and Amin Citation2003), but it is scale-dependent and requires empirical tuning. In our study, the block size notated as
is regarded as the only random variable in the Monte-Carlo simulation. It obeys the uniform distribution ranging between
and
.
As shown in , for most of images, the rows does not strictly equate the columns
, which means the square blocks could not completely cover the entire image. In this case, we use rectangular blocks of different sizes to fill the remaining fragmented part. The sizes of the remaining blocks are calculated by
(14)
(14)
where and
are the remainders of the term
and
, respectively. In this sense, four types of blocks, with sizes of
,
, and
, are used to partition the entire image in a Monte-Carlo step.
Figure 2. Schematic illustration for image partitioning using blocks in a Monte-Carlo step. Blue region represents the area that partitioned by square blocks, while red region denotes the remaining fragmented area that partitioned by the rectangular blocks.
2.2.3. Image binarization
In each Monte-Carlo step , the sub-images of the blocks are independently binarized using Otsu’s algorithm. The whole binary image is subsequently obtained by integrating the amount of the binary images of blocks. In order to reduce the computational complexity, the gray level histograms of the sub-images are preliminarily checked. We use the criterion by Pai et al. (Citation2010) to determine whether the block is required to evaluate a local threshold. If the standard deviation
and the mean
of the sub-image satisfy the following condition
(16)
(16)
where and
denote the standard deviation and the mean of the whole image, respectively, the block is assumed as background-dominated, such that the sub-image of the block contains only background pixels. In this case, the pixels in the block are substituted by background. In contrast, we used Otsu’s thresholding method as described in Section 2.1 to calculate optimal local thresholds for each block. In each block, the pixel that with a higher gray level than the local threshold is labeled as object, otherwise it is labeled as background. Assume that
refers to the binary image at the step
, we assign the object pixel a value of
, while the background pixel
.
Notice that the representation of the object and background differs by purposes. For character recognition, the object (i.e., characters) is often highlighted in black, while for landslide detection black color often represents the background.
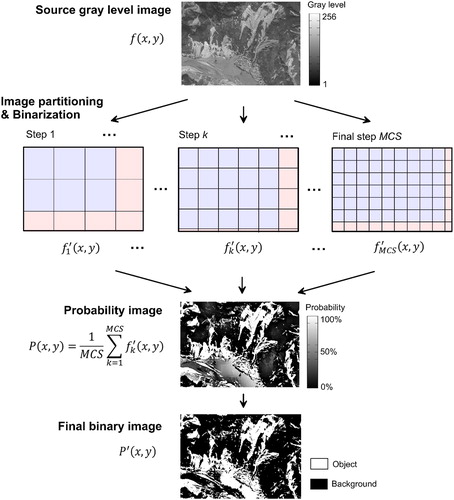
2.2.4. Monte-Carlo iteration
In each Monte-Carlo step , the original image
is transited to the binary image
using square blocks with size
. However, as illustrated by the previous studies, binary result is quite sensitive to the block size, as well as the line-approximating interferences left between blocks that observed by Wen et al. (Citation2013). As such, owing to that the block size is randomly changed during Monte-Carlo iteration, a better solution is to comprehensively consider the binary images of all Monte-Carlo steps. An indicator
is introduced, which is represented by
(17)
(17)
where denotes the probability of the pixel
detecting as object. The value of
theoretically ranges from 0.0 to 1.0. The higher value demonstrates that the pixel is more likely to be a component of object. The probability image is comprehensively evaluated by the following criterion
(18)
(18)
where refers to the final binary image after the Monte-Carlo iteration;
denotes probability threshold to evaluate the result in Monte-Carlo iteration. In order to find an appropriate probability threshold, trial-and-error adjusting can be considered, because it does not increase computational complexity. In this paper, a better fitting probability threshold
is suggested. In order to better illustrate the improved local thresholding method, the procedure described above is represented in the flowchart ().
Figure 3. Procedure of the proposed Monte-Carlo iteration algorithm.
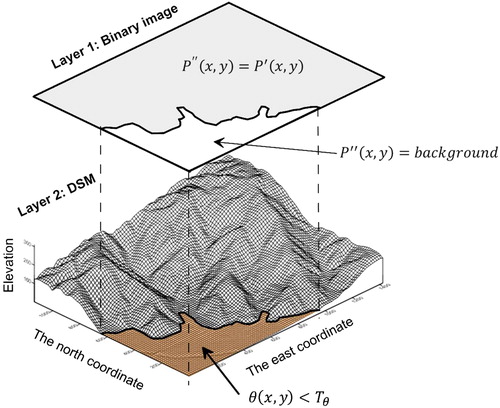
2.2.5. Post-processing
The above procedure aims to binarize images with complex illumination condition. However, for the purpose of interpreting landslides using remote sensing images, background is much more complex. Owing to the high gray level of build-up areas, farmlands, and rivers in the remote sensing image, these regions are often falsely recognized as landslide candidate objects in the binary image. Currently, the interferences due to this region is difficult to deal with. Except of the changing detecting requiring images before and after the earthquake, intelligent classification based on machine learning technique, e.g., Li et al. (Citation2017), may be a mean of solution. However, it is an ongoing work that requires a lot calibration.
In this paper, we incorporate the DSM with the binary image to minimize the interferences by build-up areas, farmlands, and rivers. Commonly, these areas are low slope gradient, low relief regions on plain. As such, we use the indicator of slope gradient to exclude these areas, which is
(19)
(19)
In EquationEquation (19)(19)
(19) ,
refers to the slope gradient that analyzed using DSM data.
denotes the final output binary image after post-processing.
represents the gradient threshold to classify the plains and slopes. As indicated by previous studies (e.g., Wysocki and Zanner Citation2006; Jahn et al. Citation2006; Chabala et al. Citation2013; Mokarram and Hojati Citation2016), a threshold
is used in this paper, which means the areas with the slope gradient less than 5.0% are classified as flat, gently sloping plains. These areas are then excluded in the binary image as background (as shown in ). Notably, the value 5.0% in EquationEquation (19)
(19)
(19) is a rather conservative criterion because common wisdom holds that landslides usually have slope gradients greater than 20° (Dai and Lee Citation2002; Shiels and Walker Citation2013; Lee Citation2014).
Figure 4. In the post-processing, Digital Surface Model (DSM) is incorporated to exclude the plain and rivers.
3. Results
The quality of the binary results must be of priority concern. In this study, two types of application are conducted. The first application is benchmark test using some typical images in previous studies. It provides a clear illustration of the advantages of the proposed method to deal with the complex background and illumination. The second application is a case study, where we use the proposed method to binarize the remote sensing image of Beichuan area, China, after the 2008 Ms8.0 Wenchuan earthquake. The triggered landslides are interpreted by the proposed method, and results are compared to those of manual delineation.
3.1. Benchmark tests
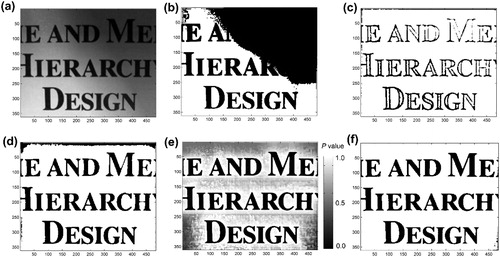
displays an original document image from Pai et al. (Citation2010). The image was taken from a paper that involves gradations of shadows. shows the binary image using Otsu’s thresholding method. Owing to the shadows in the upper part, the characters in that part could not be well separated, and then merged with the background. Although Niblack’s method performs better as shown in , the binary image is rather sensitive to the block size. We test a smaller block size, and the binary result in shows that the characters are still broken. We configure a 50-steps Monte-Carlo simulation in our proposed method. represents the probability image. Using a probability threshold generates the final binary image (). It is obvious that the proposed method yields a better outcome resembling those of Niblack’s, without any broken characters.
Figure 5. Benchmark test 1. (a) The imported image; (b) Otsu’s method; (c) Niblack’s method with block size of 15; (d) Niblack’s method with block size of 50; (e) Probability image by the proposed method; (f) Final binary image by the proposed method.
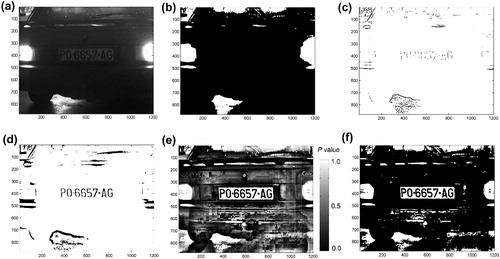
shows a captured photo of car license plate at night (Martín-Rodríguez Citation2013). High brightness of the two car bulbs significantly increases the overall gray level of the image, such that the license plate in the middle of the car could not be well separated by Otsu’s method (). show the binary results by Niblack’s method. Although the segmentation quality is improved, the results depend upon the block size, that a large block generates a better result in spite of increasing the computational complexity. In the proposed method, a 50-steps Monte-Carlo simulation is used to produce the probability image (), and a probability threshold is selected to obtain the final binary image (). It is obvious that the license plate can be well recognized.
Figure 6. Benchmark test 2. (a) The source image; (b) Otsu’s method; (c) Niblack’s method with block size of 15; (d) Niblack’s method with block size of 50; (e) Probability image by the proposed method; (f) Final binary image by the proposed method.
The above benchmark tests demonstrate that Otsu’ global thresholding method is limited to deal with complex illumination condition in the image. Niblack’s local thresholding method performs better, however, the binary result is rather sensitive to the block size, which is currently empirically determined. In this sense, the proposed method yields the best results among of the methods.
3.2. Case study
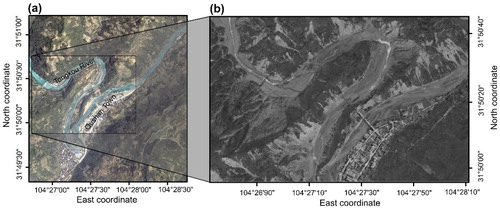
The proposed method is applied to interpret the landslides triggered by the 2008 Ms 8.0 Wenchuan earthquake in Beichuan region. The study area is located at Qushan Town, 138 km northeast of Wenchuan earthquake epicenter. Tongkou River flows across the area as shown in . The study area is close to the main active fault rupture zone and experienced high seismic shaking levels during the Wenchuan earthquake on May 12, 2008. A large number of landslides were induced in the region (Tan et al. Citation2011).
Figure 7. (a) Location of the study area. Image from Google Earth, taken at May 2001; (b) PAN SPOT5 image used for landslides detection. Image was taken at September 2008.
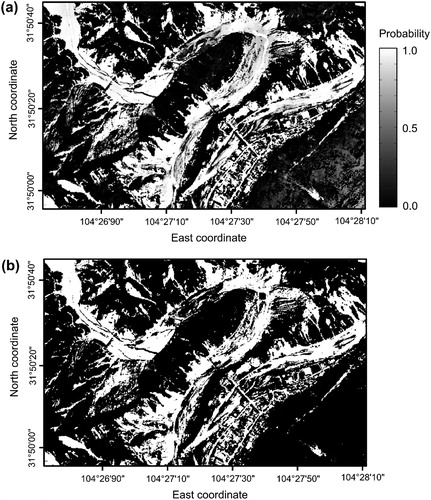
A PAN SPOT 5 image was available on September 24, 2008 (as shown in ). The image has a 2.5 m resolution, covering 4.75 km2 landscape region. The image had been pre-processed, including georeferencing, orthorectification, and atmospheric correction. The proposed method is applied to interpret landslides mixed in the image. A 50-steps Monte-Carlo simulation is configured to reduce the influence of complex illumination condition owing to the shadow areas. presents the generated probability map after Monte-Carlo simulation. It is shown that most of the discrepancies in the binary image of each step are concentrated in Tongkou River and the slopes at the right bottom of the image. To reduce the discrepancies, a probability threshold is used to obtain the output binary image.
denotes that a pixel can be classified as a component of the landslide if it is in more than 80% steps during the Monte-Carlo simulation. shows the final output binary image after Monte-Carlo simulation.
Figure 8. Binarizing results using the proposed method. (a) Probability map generated by 50-steps Monte Carlo iteration; (b) binary image using a probability threshold .
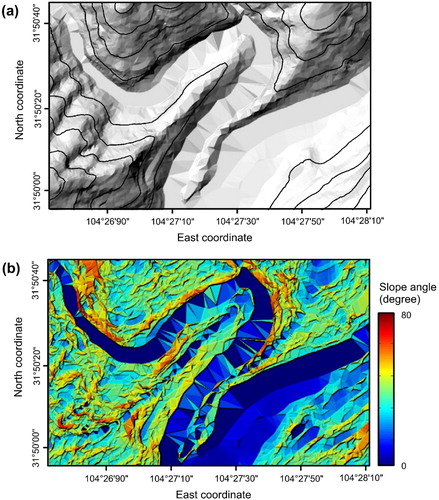
Nevertheless, the binary image in still contains some interferences. These interferences are commonly produced due to the high gray level of the rivers, roads, and built-up regions on plains. The interferences have similar gray-level features that close to the landslides, and they are difficult to exclude only by a PAN image. We use DSM data to identify these regions. The DSM data was converted from 1:50,000 contour lines in the topographic vector map provided by Chinese Geological Survey (). Based on the DSM data, slope gradient map is calculated using the TopoToolbox in MATLAB environment (Schwanghart and Scherler Citation2014), as shown in . However, as limited by the low resolution of the DSM data, water surface at river bend is illogically inclined. It has been manually modified in the following analysis. Notably, because the slope gradient map in and the binary image in have different resolution, both two images have to be processed by resampling to the same resolution. In order to reduce the interferences in , gentle slopes, plains, and rivers are excluded using the criterion in EquationEquation (19)(19)
(19) .
Figure 9. Ten meter resolution DSM data of the study area for excluding plains and rivers. Data was provided by Chinese Geological Survey in 2001. (a) hillshade and contour map; (b) slope gradient map generated from DSM data, using TopoToolbox (Schwanghart and Scherler Citation2014).
presents the final binary image after 50-steps of Monte-Carlo simulation and post-processing by DSM data. White components highlight the landslides induced by the earthquake, and black parts refer to the background. The binary image in interprets totally 33 landslides in the study area. To illustrate the performance of the proposed method, we compare the binary result with that of manually visual delineation. Indicators proposed is adopted for the empirically-dependent visual delineation for landslides, including shape, size, color, texture, and tone. Totally 28 landslides are interpreted, as delineated by the red polygons in .
Figure 10. Final detection of landslides based on the binary image and the DSM data.
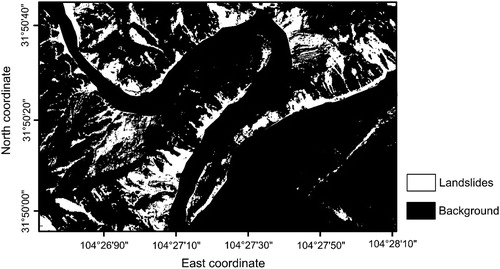
Figure 11. Comparison of the detection result between the proposed method and manually visual delineation.
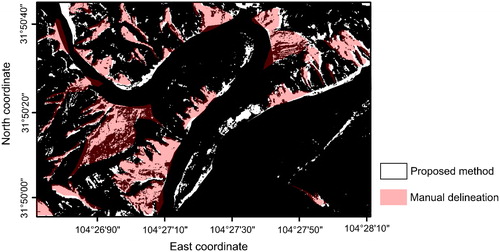
As revealed in , all the 28 landslides by manual delineation could be identified in the final binary image. However, there remain 5 slopes that falsely classified as landslides. The false delineations are majorly the alluvial flats of the bend of Tongkou River, where the gray levels of those parts are close to the neighboring landslides. As well as the newly built road at the right part of the image. It can be explained in part that the 10 m resolution DSM data is limited to distinguish the terrain relief at the junction area between slopes and alluvial flats. The delineation results in could be improved if DSM data with higher resolution is available. In this context, LiDAR-based high-resolution DSMs, and DSMs derived by Airborne laser scanning (ALS), terrestrial laser scanning (TLS), and photogrammetric topography reproduction may provide a powerful supplement to the proposed method.
4. Discussions
4.1. Computational complexity analysis
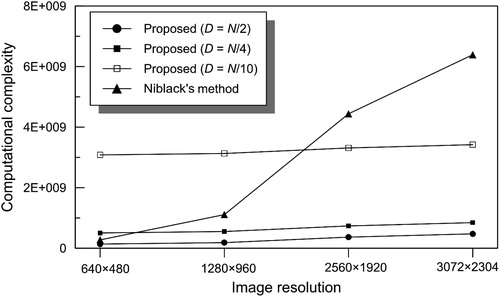
However, the proposed method in this paper requires repeatedly binarization during Monte-Carlo simulation, which significantly increases the computational cost comparing to Otsu’s method. Following Pai et al. (Citation2010), we compare the arithmetic computational complexity of the proposed method with previous methods. Here, the commonly used global and local thresholding methods, i.e., Otsu’s method and Niblack’s method, are considered owing to their lower computation.
For an image of size , and gray level
, the computational complexity of Otsu’s method and Niblack’s method have been deduced by Pai et al. (Citation2010) as shown in . In Otsu’s method, total computational complexity includes the term
for calculating the image histogram, and
for estimating the probability, mean and variance in order to dichotomize the histogram into two classes. While in Niblack’s method, the threshold is computed by calculating the local mean and standard deviation inside a fixed block with size
for each pixel, hence the complexity is reduced to
. In the proposed method, the total amount of the segmented block is
. Each individual block is binarized using Otsu’s procedure, such that the complexity of each Monte-Carlo is
. This procedure is repeatedly executed in n steps of Monte-Carlo iteration; hence the total complexity of the proposed method is
.
Table 1. Computational complexity of the proposed and the previous thresholding method.
compares the results of the above three methods with respect to arithmetical computation. We used images with four different resolutions. For general images, the gray level is 256. In Niblack’s method, a typical block size
is used, while in the proposed method, we assume that the block size is
, which means the image is partitioned into four square blocks and fragmented regions. Results in demonstrates that general complexity of the proposed method is between that of Otsu’s and Niblack’s method.
Table 2. Comparison of computational complexity of the methods.
However, as shown in , for the proposed method, the transition of the computational complexity from “large block size” to “small block size” is drastic. For a general case, where and
, the complexity significantly increases in a 50-steps Monte-Carlo iteration. also reveals that the proposed method performs better in a high-resolution image, because the computational complexity is not quite sensitive to the image resolution. For the worst case, when
, the computational cost of the proposed method is still only 53.5% that of Niblack’s method. It implies that the proposed method is a better solution for binarizing large-scale, high-resolution images, such as regional remote sensing images.
Figure 12. The tendency of computation complexity upon various image resolutions among the proposed method and Niblack’s method ().
4.2. Limitations of the current method
4.2.1. Dealing with the clumping of individual landslides
In this paper, we present an alternative approach for rapid delineation of landslide perimeter. However, as indicated by Marc and Hovius (Citation2015), amalgamation, i.e., the mapping of several adjacent landslides as a single object, often exists and leads to potentially severe distortion of the statistics of landslides inventories. It is one major concern of the automatic landslides mapping, because the overestimated area of the landslide perimeter results an illogical volume of the landslide according to the power-law scaling relationship between area and volume of a landslide (Larsen et al., Citation2010). In this context, the presented approach in this paper is limited, because it only identifies the pixels affected by landslides, rather than delineating individual landslide objects.
4.2.2. Empirical adjusting on the probability threshold 
Except of the computational complexity, the proposed method also has some limitations regarding some parameters in the algorithm. Although the proposed method addresses the essential issues with respect to the block size and the so-called boundary effect, it still involves some parameters that need a further discussion.
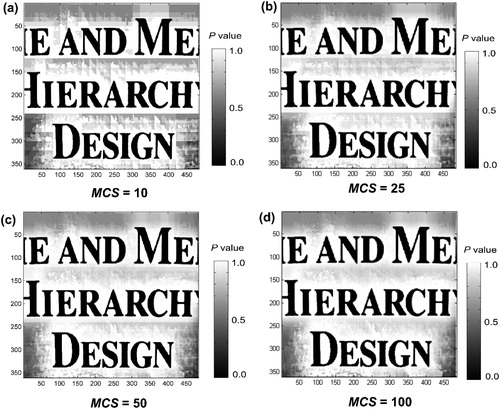
The first parameter that needs a further discussion is the total steps of Monte-Carlo runs . Ideally, the greater
generates better data set for the probability analysis. We have performed sensitivity analysis on the generated probability map
against different
(as shown in , benchmark test 1 for example). It demonstrated that
has no obvious influence on the overall distribution of the generated probability map
. However, as implied in , insufficiency of the total steps of Monte-Carlo runs commonly results in a rough distribution of
, limiting to overcome the boundary effect. Considering the fact that greater
linearly increases the amount of computation, generally we suggest a total number of Monte-Carlo steps
for practical work.
Figure 13. The variation of binarization against different values of
.
Empirical adjusting also exists while determining the thresholds. EquationEquations (18)(18)
(18) and Equation(19)
(19)
(19) involve two thresholds, the probability threshold
and the gradient threshold
. As illustrated in Section 2.2, the value
is derived according to the previous geomorphological studies. With regard to the probability threshold
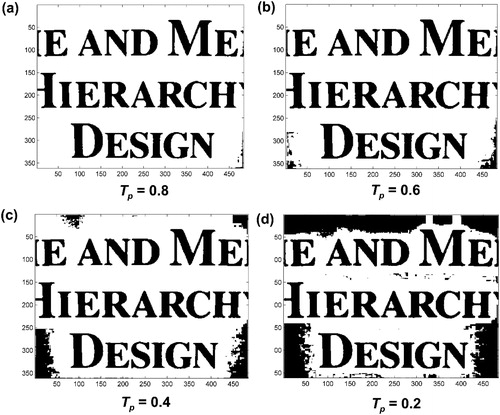
, it has a significant influence of the binarization results as shown in . It is currently empirically manipulated and needs trial-and-error adjusting when generating the output binary image.
only influences the binary image, having no relevance to compute the probability map during the Monte-Carlo simulation. A greater probability threshold
is beneficial to decrease the presence of unwanted data, but on the contrary, lost some fine details. Unfortunately, the probability threshold
currently needs empirically manipulation and adjusting for a better output binary image. We use a scrollbar in the MATLAB-based program to check in time the output binary image as a function of
, because adjusting on
does not increase computational complexity. However, the uncertainty of
somewhat limits the proposed method to a robust automatic one. As such, our ongoing work focuses on improving the here presented method by addressing this issue.
Figure 14. The variation of the probability map results against different values of .
5. Conclusion
In this paper, we present an improved image binarization method for noncontact detection of earthquake-induced landslides. In general, the presented method first partitions the image into a number of square blocks with uniform size that reflects local characteristics in the entire image. Following image partitioning, the binary image of each block can be obtained by using Otsu’s thresholding method. To reduce the influence of the block size and interferences due to the so-called boundary effect, we incorporate the Monte-Carlo simulation into the binarization algorithm. Varying block sizes during the Monte-Carlo iteration generate a probability map. A final output binary image can be obtained with a pre-defined probability threshold. The presented method integrates the advantages of global and local methods. Benchmark tests show the effectiveness of the presented method in performing well to binarize the image with complex illumination condition.
To improve the binarization result for separating landslides from the background, we furthermore incorporate the digital surface model into the binary image, such that the interferences by build-up areas, farmlands, and rivers can be significantly reduced using the indicator of slope gradient. As a case study, we use the proposed method to detect landslides in the remote sensing image near Beichuan area, China, after the Ms8.0 Wenchuan earthquake. Results demonstrate that the presented method interprets landslides resembling those of manually visual delineation.
However, the proposed method is somewhat limited by introducing two extract thresholds during post-processing. Although criterions for determining the two thresholds are available, it still needs empirical adjusting. Efforts addressing such limitation will be the next step toward making the presented method a robust and automatic solution for rapid landslide detection.
Disclosure statement
No potential conflict of interest was reported by the authors.
Additional information
Funding
Related Research Data
References
- Bataineh B, Abdullah SNHS, Omar K. 2011. An adaptive local binarization method for document images based on a novel thresholding method and dynamic windows. Pattern Recog Lett. 32(14):1805–1813.
- Bernsen J. 1986. Dynamic thresholding of gray-level images. Proceedings of the Eighth International Conference on Pattern Recognition; Paris, France: IEEE Computer Society Press, p. 1251–1255.
- Chabala LM, Mulolwa A, Lungu O. 2013. Landform classification for digital soil mapping in the Chongwe-Rufunsa area, Zambia. AFF. 2(4):156–160.
- Chang KJ, Taboada A, Lin ML, Chen RF. 2005. Analysis of landsliding by earthquake shaking using a block-on-slope thermo-mechanical model: example of Jiufengershan landslide, central Taiwan. Eng. Geol. 80(1–2):151–163.
- Chou C, Lin AW, Chang AF. 2010. A Binarization method with learning-built rules for document images produced by cameras. Pattern Recognition. 43(4):1518–1530.
- Dai FC, Lee CF. 2002. Landslide characteristics and slope instability modeling using GIS, Lantau Island, Hong Kong. Geomorphology. 42(3–4):213–228.
- Eikvil L, Taxt T, Moen K. 1991. A fast adaptive method for binarization of document images. In Proceedings of the ICDAR, 1991, Saint-Malo, France, September 1991, pp. 435–443.
- Gatos B, Ntirogiannis K, Pratikakis I. 2011. DIBCO 2009: Document image binarization contest. IJDAR. 14(1):35–44.
- Gatos B, Pratikakis I, Perantonis SJ. 2006. Adaptive degraded document image binarization. Pattern Recognition. 39(3):317–327.
- Gorum T, Fan X, van Westen CJ, Huang RQ, Xu Q, Tang C, Wang G. 2011. Distribution pattern of earthquake-induced landslides triggered by the 12 May 2008 Wenchuan earthquake. Geomorphology. 133(3–4):152–167.
- Han Z, Chen G, Li Y, He Y. 2015. Assessing entrainment of bed material in a debris-flow event: A theoretical approach incorporating Monte Carlo method. Earth Surf Process Landforms. 40(14):1877–1890.
- Han Z, Chen G, Li Y, Tang C, Xu L, He Y, Huang X, Wang W. 2015. Numerical simulation of Debris-flow behavior incorporating a dynamic method for estimating the entrainment. Engineering Geology. 190:52–64.
- Han Z, Wang W, Li Y, Huang J, Su B, Tang C, Chen G, Qu X. 2018. An integrated method for rapid estimation of the valley incision by debris flows. Engineering Geology. 232:34–45.
- Jahn R, Blume HP, Asio VB, Spaargaren O, Schad P. 2006. Guidelines for soil description. 4th ed. Rome, Italy: Food and Agriculture Organization of the United Nations.
- Kefali A, Sari T, Sellami M. 2010. Evaluation of several binarization techniques for old Arabic documents images. The First International Symposium on Modeling and Implementing Complex Systems (MISC 2010); Algeria, pp. 88–99.
- Khurshid K, Siddiqi I, Faure C, Vincent N. 2010. Comparison of Niblack inspired binarization methods for ancient documents. Proceedings of 16th International Conference on Document Recognition and Retrieval, USA.
- Larsen I, Montgomery D, Korup O. 2010. Landslide erosion controlled by hillslope material. Nature Geosci. 3(4):247–251.
- Lech O, Okarma K, Wojnar D. 2015. Binarization of document images using the modified local-global Otsu and Kapur algorithm. Electrotechnical Review. 1(2):73–74.
- Lee CT. 2014. Slope factor and shallow landslide occurrence. EGU General Assembly 2014, held 27 April–2 May, 2014 in Vienna, Austria, id.10420.
- Li HF, Tao C, Wu ZX, Chen J, Gong JY, Deng M. 2017. RSI-CB: A Large Scale Remote Sensing Image Classification Benchmark via Crowdsource Data. arXiv:1705.10450.
- Li Y, Chen G, Han Z, Zheng L, Zhang F. 2014. A hybrid automatic thresholding approach using panchromatic image for rapid mapping of landslides. GIScience and Remote Sensing. 51(6):710–730.
- Marc O, Hovius N. 2015. Amalgamation in landslide maps: effects and automatic detection. Nat Hazards Earth Syst Sci. 15(4):723–733.
- Martín-Rodríguez F. 2013. New tools for gray level histogram analysis, applications in segmentation. In: Kamel M, Campilho A, editors. Image Analysis and Recognition. ICIAR 2013. Lecture Notes in Computer Science, 7950. Berlin, Heidelberg: Springer; p. 326–335.
- Mokarram M, Hojati M. 2016. Comparison of landform classifications of elevation, slope, relief and curvature with topographic position index in the south of Bojnoord. Ecopersia. 4(2):1343–1357.
- Niblack W. 1986. An introduction to digital image processing. Upper Saddle River, NJ: Prentice-Hall, pp. 115–116.
- Otsu N. 1979. A threshold selection method from gray-level histograms. IEEE Trans Syst Man Cybern. 9(1):62–66.
- Pai YT, Chang YF, Ruan SJ. 2010. Adaptive thresholding algorithm: Efficient computation technique based on intelligent block detection for degraded document images. Pattern Recognition. 43(9):3177–3187.
- Parker RN, Densmore AL, Rosser NJ, de Michele M, Li Y, Huang R, Whadcoat S, Petley DN. 2011. Mass wasting triggered by the 2008 Wenchuan earthquake is greater than orogenic growth. Nature Geosci. 4(7):449–452.
- Poletti E, Zappelli F, Ruggeri A, Grisan E. 2012. A Review of Thresholding Strategies Applied to Human Chromosome Segmentation. Comput Methods Programs Biomed. 108(2):679–688.
- Refice A, Bovenga F, Wasowski J, Guerriero L. 2000. Use of InSAR data for landslide monitoring: a case study from southern Italy. Proceedings IGARRS 2000, 24–28 July 2000; Honolulu, Hawaii, IEEE Press, pp. 2504–2506.
- Roback K, Clark MK, West AJ, Zekkos D, Li G, Gallen SF, Chamlagain D, Godt JW. 2018. The size, distribution, and mobility of landslides caused by the 2015 Mw7.8 Gorkha earthquake, Nepal. Geomorphology. 301:121–138.
- Rosin PL, Hervás J. 2005. Remote sensing image thresholding methods for determining landslide activity. Int J Remote Sens. 26(6):1075–1092.
- Sauvola J, Pietikainen M. 2000. Adaptive document image binarization. Pattern Recognition. 33(2):225–236.
- Schwanghart W, Scherler D. 2014. TopoToolbox 2 - MATLAB-based software for topographic analysis and modeling in Earth surface sciences. Earth Surf Dynam. 2(1):1–7.
- Sezgin M, Sankur B. 2004. Survey over image thresholding techniques and quantitative performance evaluation. J Electron Imaging. 13(1):146–168.
- Shiels AB, Walker LR. 2013. Landslides cause spatial and temporal gradients at multiple scales in the Luquillo Mountains of Puerto Rico. Ecological Bulletins. 54:211–221.
- Stathis P, Kavallieratou E, Papamarkos N. 2008. An evaluation technique for binarization algorithms. J Univ Comput Sci. 14(8):3011–3030.
- Tan C, Zhu J, Qi X, Ding J. 2011. Landslides induced by the Wenchuan earthquake and the subsequent strong rainfall event: A case study in the Beichuan area of China. Engineering Geology. 122(1–2):22–33.
- Taxt T, Flynn PJ, Jain AK. 1989. Segmentation of document images. IEEE Trans Pattern Anal Mach Intell. 11(12):1322–1329.
- Tong L, Chen K, Zhang Y, Fu X, Duan J. 2009. Document image binarization based on NFCM. In Proceedings of 2nd International Congress in Image and Signal Processing, 2009. CISP09, Tianjin, China, pp. 1–5.
- Trier OD, Jain AK. 1995. Goal-directed evaluation of binarization methods. IEEE Trans Pattern Anal Machine Intell. 17(12):1191–1201.
- Vietmeier J, Wagner W, Dikau R. 1999. Monitoring moderate slope movements (landslides) in the southern French Alps using differential SAR interferometry. In 2nd International Workshop on ERS SAR Interferometry ‘FRINGE’ 99, Liege, Belgium, 10–12 November.
- Wen JT, Li SM, Sun JD. 2013. A new binarization method for non-uniform illuminated document images. Pattern Recognition. 46(6):1670–1690.
- Wu S, Amin A. 2003. Automatic thresholding of gray-level using multistage approach. In Seventh International Conference on Document Analysis and Recognition, pp. 493–497.
- Wysocki D, Zanner CW. 2006. Landscape elements. In: Rattan Lai, editor. Encyclopedia of Soil Science. Boca Raton, FL: CRC Press.
- Yanowitz SD, Bruckstein AM. 1989. A new method for image segmentation. Computer Vision Graph Image Process. 46(1): 82–95.
- Yin Y, Wang F, Sun P. 2009. Landslide hazards triggered by the 2008 Wenchuan earthquake, Sichuan, China. Landslides. 6(2):139–152.
- Zhang C, Yang J. 2010. Binarization of document images with complex background. In Proceedings of 6th International Conference in Wireless Communications Networking and Mobile Computing (WiCOM), Chengdu, China, September 2010, pp. 1–4.
- Zhang Y, Wang J, Xu Q, Chen GX, Zhao J, Zheng L, Han Z, Yu P. 2015. DDA validation of the mobility of earthquake-induced landslides. Engineering Geology. 194:38–51.