
 ?Mathematical formulae have been encoded as MathML and are displayed in this HTML version using MathJax in order to improve their display. Uncheck the box to turn MathJax off. This feature requires Javascript. Click on a formula to zoom.
Abstract
The spatial and temporal distributions of landslides can be used to assess the potential future impacts of landslides over large scales. However, quantitatively characterizing the spatial and temporal distributions of landslides and their causes remains a critical challenge. In this work, a typical landslide-prone region (the Qinba Mountains) is selected to identify this spatial and temporal trend. Information on 295 landslides spanning ten years from 2005 to 2014 was collected. The results revealed that landslide occurrences were clustered in time and space. Approximately 81% of the total landslides occurred from July to October. Moreover, a power law relationship between the cumulative frequency and number of landslides per day was discovered. Notably, the probability density of the time interval decreased as the time interval between landslide events increased, and this relationship was well described by a negative power-law correlation. Furthermore, the spatial and temporal distribution pattern of most landslides were influenced by rainfall events and earthquakes. There were several clustered centers in the study area, and the mean centers of the landslide distribution varied among years.
1. Introduction
Landslides are catastrophic natural hazards that are triggered by various processes, such as meteorological changes, rapid tectonic forcing, and human disturbances (Malamud et al. Citation2004; Guzzetti et al. Citation2005, Citation2009; Froude and Petley Citation2018). In China, hilly and mountainous regions constitute approximately 69% of the total land area (Huang and Li Citation2011; Li et al. Citation2016). Due to the complex geological environment, special topography, and variable climate features, China is at a very high risk of landslides (Wen et al. Citation2004; Huang Citation2009; Petley Citation2012; Kirschbaum et al. Citation2015; Cui et al. Citation2017). In particular, the economic development and construction in landslide-prone areas have aggravated the terrain conditions over the past 20 years, resulting in more landslides (Huang and Li Citation2011; Zhang and Huang Citation2018).
The Qinba Mountains in China are strongly affected by landslides (Weidinger et al. Citation2002; Wei et al. Citation2008; Li et al. Citation2016). This area is prone to landslides due to its complex morphology, geologic structures, strong fault activity and extreme climatic characteristics (Qiu et al. Citation2017; Zhao et al. Citation2017). Rainfall is the most frequent landslide-triggering factor and has led to many serious landslide events. For example, thirty-one landslides occurred from September 27, 2005, to October 6, 2005, due to long-lasting rainfall. Fifty-two and twelve landslides occurred on July 18, 2010, and August 7, 2007, respectively, due to intensive intraday rainfall. Eight landslides occurred in the southeast of the Qinba Mountains from July 11 to July 15, 2009, following an intense period of rainfall. These landslides caused many casualties and damage to infrastructure, settlements, agriculture and urban areas throughout the area (Qiu et al. Citation2017). The risks associated with landslides have been considered by policymakers in construction and land management.
Understanding the spatial and temporal distributions of landslides provides an opportunity to recognize the areas that may be susceptible to landslides in the future (Dai et al. Citation2011; Collins et al. Citation2012; Petley Citation2012; Kirschbaum et al. Citation2015) because landslides tend to occur in areas where they have occurred in the past (Malamud et al. Citation2004; Guzzetti et al. Citation1999). Many researchers have studied the spatiotemporal distribution of landslides on a global scale based on publicly available global landslide datasets (Nadim et al. Citation2006; Cascini et al. Citation2011; Petley Citation2012; Kirschbaum et al. Citation2015; Stanley and Kirschbaum Citation2017). Despite a good understanding of the spatial relationships between landslides and their causative factors, few studies have analyzed the spatial and temporal distributions of landslides due to the sparse and episodic characteristics of landslides on a continuing basis (Lang et al. Citation1999; Martin et al. Citation2002; Paudel et al. Citation2007; Piacentini et al., Citation2018). In particular, some approaches to modeling landslide activity at regional scales do not consider the temporal evolution of landslides due to the little historical information available (Van Asch and Van Steijn Citation1991; Paudel et al. Citation2007; Parker Citation2013; Kirschbaum et al. Citation2015). Thus, it is necessary to research the regional trends of landslides to determine the potential impacts of landslides over large spatial and temporal scales (Hovius et al. Citation2000; Zhou et al. Citation2002; Tanyaş et al. Citation2017; Valenzuela et al. Citation2017).
Landslides occur in clusters throughout the world (Malamud et al. Citation2004; Jarman Citation2006; Zuo et al. Citation2009; Tonini et al. Citation2014) because areas that are highly sensitive to landslides exhibit a strongly clustered distribution pattern (Dai and Lee Citation2002). Characterization of the spatial patterns of landslides has implication for understanding landslide processes, landslide events and predisposing factors (Carrara et al. Citation1991; Guzzetti et al. Citation1999; Zuo et al. Citation2009; Tonini and Abellan Citation2014). Landslides can be described as point processes (Telesca Citation2007; Zuo et al. Citation2009; Tonini et al. Citation2014). Some authors have suggested that there exists a clustering phenomenon in landslide spatial distribution based on nearest neighbour, Ripley’s K-function, fractal dimension, Morisita index, and other analyses (Luo et al. Citation1996; Rouai and Jaaidi Citation2003; Guthrie and Evans Citation2004; Zuo et al. Citation2009; Tonini et al. Citation2014; Tonini and Abellan Citation2014). Zhou et al. (Citation2002) found that the occurrence of landslides was strongly coincident with storm centers. Huang and Fan (Citation2013) showed that landslides were clustered along faults, where the ground motion is generally stronger. Larsen and Montgomery (Citation2012) found that landslides are close to each other and that the spatial clustering of landslides is associated with higher rates of uplift. Although spatial point process analysis has been widely used to study forest fires and some geological events, few researches have focused on landslide point processes and patterns (Zuo et al. Citation2009; Tonini et al. Citation2009, Citation2017; Parente et al. Citation2016; Orozco et al. Citation2012). Thus, it is necessary to quantify landslide spatial patterns and identify the causes.
The present article aims to determine the spatial and temporal distributions of landslides. A typical landslide-prone region, i.e. the Qinba Mountains, Shaanxi Province, China, is selected as an example to identify the spatial and temporal trends. Information on 295 landslides that occurred from 2005 to 2014 was collected to determine the annual and monthly variations, analyze the relationship between landslides and intraday rainfall, identify the distribution pattern of landslides, and reveal the causes of the spatial and temporal distributions. We hope the results of this article will inform guidelines for landslide risk management in this area.
2. Materials and methods
2.1. Study area
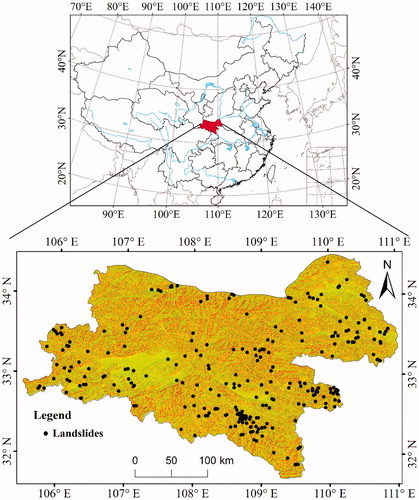
The Qinba Mountains are located in southern Shaanxi Province, China, covering an area of 74,000 km2 (). The Qinba Mountains are a typical collisional orogenic belt and were formed by a collision of the South Chinese Yangtze Platform and North China Block during the early Mesozoic orogeny (Weidinger et al. Citation2002). The elevation in the area ranges from 150 to 3767 m above sea level (asl), with an average value of 1175 m and a standard deviation of 486 m. The topography is deeply dissected with valley floors and characterized by high and steep mountains. The region is drained by the Han River and its many tributaries. This area is influenced by subtropical continental humid monsoon and warm temperate continental monsoon climates. Approximately 57% of the total precipitation occurred between July and September for the period between 2005 and 2014. These precipitation events often result in severe landslides and flooding. The natural slopes are potentially prone to failure during intensive rainfall and earthquake events. The population is concentrated on river terraces and areas with gentle slopes. This area includes three large urban concentration centers: Ankang, Shangluo and Hanzhong Cities.
Figure 1. Location of the study area. The dots show the all landslides from 2005 to 2014.
2.2. Data collection
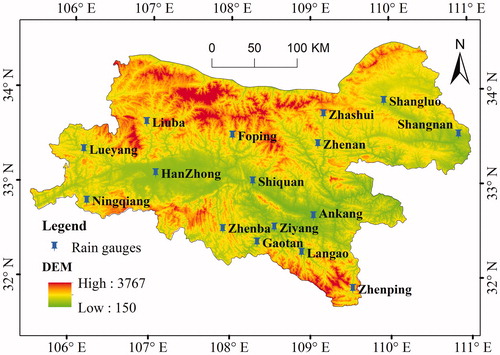
Landslide data play essential roles in recording and identifying the landslide distribution (Li et al. Citation2016). We compiled a dataset of historical landslides from 2005 to 2014 through a systematic analysis of existing catalogs of historical landslide records and archives in the Qinba Mountains (). Most of the landslide data were from the Yearbook of Disaster Prevention in Shaanxi Province. The dataset includes data on 295 landslides that occurred from 2005 to 2014, including 44 falls, 171 slides and 80 debris flows. The collected data include the place names where landslides occurred, locations (geographic coordinates), losses and dates of occurrences. The landslide locations were recorded as the centroids of the landslides. The precision of this location information was sufficient for our analyses because our main focus was on the temporal distribution and spatial pattern of landslides. For the analysis of temporal distribution, landslide location information is not of interest. For the analysis of spatial pattern, we analyzed the landslides as point processes. The use of point processes as proxies for landslide did not influence the results of our analysis. The collected data were imported into ArcGIS 9.3 software by the authors. The dataset included only those landslides that resulted in damage or were located near villages and towns. Thus, landslides that occurred in the study area but were not observed by a local population or were not reported because they did not cause losses were not included in the dataset. The source catalogs used to compile this landslide dataset were appropriate and informative for our study for several reasons. First, complete catalogs for large areas in this region are not available. Second, the landslides included in our dataset are closely associated with human populations. Such landslides are of the greatest concern to both scientists and policy makers. Therefore, the results obtained are informative for landslide disaster prevention and mitigation. Last, the source catalogs provided a minimum number of landslides in the study area. Therefore, our results offer some threshold values. For example, the time interval between landslide events in nature should be smaller than that calculated in this work. Thus, the catalogs were appropriate data sources to investigate the temporal and spatial distributions of landslides. Moreover, the regional rainfall data used in this study were recorded by gauges in the region that were established by the administration in the Qinba Mountains. The meteorological data were from the China Meteorological Data Service Center (CMDC) and Shaanxi Meteorological Service. shows the spatial distribution of rain gauges in the Qinba Mountains. We collected data from 16 rain gauges to analyze the daily rainfall in the study area. We defined a high-intensity rainfall event or storm as a rainfall event in which the total rainfall exceeded 50 mm within 24 h. Because landslides always cluster within a certain area for a given high-intensity rainfall event, we selected the central one or two rain gauges to analyze an individual landslide. We used all the daily rainfall data from the 16 rain gauges to interpolate and generate the spatial distribution of daily rainfall. The earthquake data were from the China Earthquake Data Center.
Figure 2. Landslide distributions in different years from 2005 to 2014.
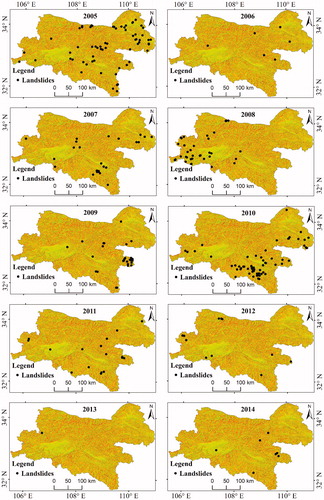
Figure 3. Spatial distribution of rain gauges in the Qinba Mountains, with elevation shown for context.
2.3. Methods
2.3.1. Power law relationship
The cumulative frequency (Fc) of the number of landslides per day (NL) is defined as the sum of all frequencies that lie above the current number of landslides per day. Here, the cumulative frequency is able to show the frequency of more than a given number of landslides per day. In this work, we used a power law relationship to fit the cumulative frequency of the number of landslides per day. This relationship can be expressed as follows:
(1)
(1)
where C and α are constants depending on the local conditions.
To facilitate discussion of landslide time series, all landslides that occurred on the same day were defined as a single landslide event because the landslide database only records the date of landslide occurrence. The time interval (T) was defined as the days between landslide events. The probability density (P) of the time interval describes the relative frequency of occurrence of the time interval when sampled from a population of time intervals. We also used the power law correlation to describe the relationship between probability density and the time interval between landslide events:
(2)
(2)
where D and β are constants depending on the local conditions. We analyzed the probability density of the time interval between landslide events by using the kernel density estimation tool of MATLAB 10.0 software.
2.3.2. Spatial analysis of landslides
Spatial analysis can be used to reveal the patterns and processes of landslide spatial distribution. In this work, we used the kernel density, mean center, average nearest neighbor analysis and spatial interpolation tools of ArcGIS software to conduct the spatial analysis of landslides.
2.3.2.1. Kernel density estimation
The kernel density tool calculates the density of features in a neighborhood around those features (Guthrie and Evans Citation2004). In this work, we defined the landslide intensity as the kernel density of landslides, i.e. the landslide magnitude per unit area. Kernel density estimation can be used to calculate a landslide magnitude per unit area from landslide point features using a kernel function to fit a smoothly tapered surface to each landslide point. Here, we used kernel density estimation to generate landslide intensity. The kernel density estimation in 2-D space is given by the following (Silverman Citation1986; Xie and Yan Citation2008; Chu et al. Citation2012; Cai et al. Citation2013)
(3)
(3)
where is the density at location s; r is the search radius (bandwidth) of the kernel density estimation; n is the number of sampling points; and k is the weight of a point i at distance dis to location s and is usually modeled as a kernel function of the ratio between dis and r. In this work, the kernel function was based on the Gaussian kernel function (Xie and Yan Citation2008; Chu et al. Citation2012):
(4)
(4)
2.3.2.2. Mean center
The mean center is the average x- and y-coordinates of all the landslides in each year. This variable is useful for tracking changes in the landslide spatial distribution and comparing the landslide distributions in different years. The mean center is given as follows (Scott and Janikas Citation2010):
(5)
(5)
where and
are the coordinates of the mean center, xi and yi are the coordinates for landslide i, and n is equal to the total number of landslides each year. Here, we calculated the mean center of landslides for each year.
2.3.2.3. Average nearest neighbor analysis
The average nearest neighbor (ANN) can reveal the spatial distribution pattern of spatial data (Guthrie and Evans Citation2004; Scott and Janikas Citation2010). The ANN is calculated as follows:
(6)
(6)
where di is the distance between landslide i and its nearest landslide, n is the total number of landslides, and A is the total study area. If ANN is less than 1, the spatial distribution pattern of landslides is clustered. If ANN exceeds 1, the pattern is dispersed.
Furthermore, we applied a global cluster indicator, i.e., the z-score, to measure the spatial distribution of landslides. The z-score is calculated as follows:
(7)
(7)
The significance level of landslide spatial distribution pattern based on different z-scores is shown in . Generally, smaller z-scores indicate that the landslide spatial distribution is more clustered, whereas larger z-scores indicate the landslide spatial distribution is more dispersed.
Table 1. Significance level of the landslide spatial distribution pattern based on different z-scores.
2.3.2.4. Spatial interpolation of rainfall
Ordinary kriging, which enables predictions of the value of a variable at unknown locations, is one of the most widely used and well-developed geostatistical interpolators (Teng et al. Citation2014). Here, we interpolated the spatial rain gauge data by using ordinary kriging to generate the spatial distribution of rainfall.
3. Results
3.1. The temporal distribution of landslides in the Qinba Mountains
3.1.1. Landslide occurrences in different years
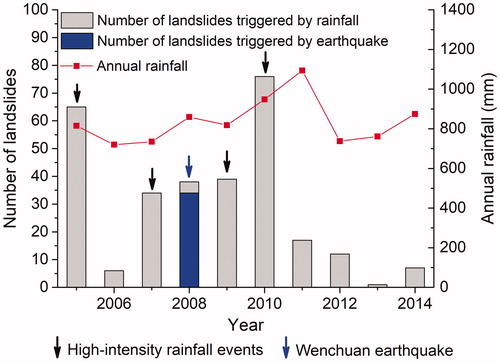
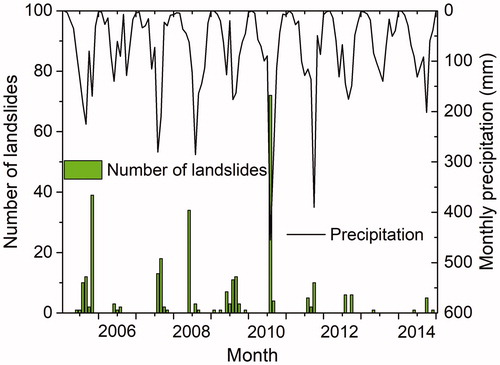
shows the distributions of annual rainfall and landslide events from 2005 to 2014 in the Qinba Mountains. There is no obvious rainfall trend from 2005 to 2014 in the Qinba Mountains. However, the landslides from 2005 to 2010 were more severe than those from 2011 to 2014. The results showed that there is no obvious correlation between landslide occurrence and annual rainfall. However, the years with many landslides were influenced by high-intensity rainfall events (such as those in 2005, 2007, 2009 and 2010) and earthquake events (in 2008).
Figure 4. Temporal distributions of annual rainfall and landslide events from 2005 to 2014 in the Qinba Mountains.
3.1.2. Landslide occurrences within different months
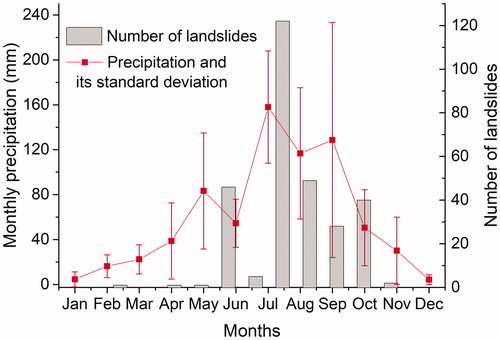
We analyzed the statistics of rainfall and number of landslides in different months. The distributions of monthly rainfall and landslides are not normal and several peaks can be discovered (). The maximum monthly rainfall and the most landslide events occurred in July in this study area. Precipitation was most abundant from July to September, and the precipitation during this period accounted for approximately 57% of the annual precipitation. Landslides were most common from July to October, when 81% of the total landslides occurred. Although 46 landslides occurred in May, most occurred on May 12, 2008, due to the Wenchuan earthquake in Sichuan Province. Overall, the number of landslides increased with increasing monthly rainfall.
Figure 5. Mean monthly precipitation and number of landslide events from January 2005 to December 2014 in the Qinba Mountains.
shows the monthly precipitation and number of landslides from January 2005 to December 2014 in the study area. We found that most of the landslides were concentrated in certain months of each year, and the months in which most of the landslide events occurred differed among years (). In 2005, 60% of the landslides occurred in October. In 2007, 50% of the landslides occurred in August. In 2008, 89% of the landslides occurred in May. In 2010, 95% of the landslides occurred in July. In 2011, 59% of the landslides occurred in September. As stated above, we found that most of the rainfall-triggered landslides occurred in the summer and fall (). Most importantly, the monthly number of landslides was generally correlated with the mean monthly rainfall. In most cases, the monthly number of landslides increased with the increase in the mean monthly rainfall, and peaks of landslide events occurred in the summer and autumn months ().
Figure 6. Monthly precipitation and the number of landslides from Jan 2005 to Dec 2014 in the Qinba Mountains.
3.1.3. Landslide occurrences within different days
We used the number of reported landslides (DL) in a day as a measure of landslides over time. In the Qinba Mountains from 2005 to 2014, there were 113 days with 1≤DL≤52 landslides per day. Most of the days in this time series had zero values, i.e. no landslides. The days with the occurrence of only one landslide accounted for approximately 65% of total days with landslide events.
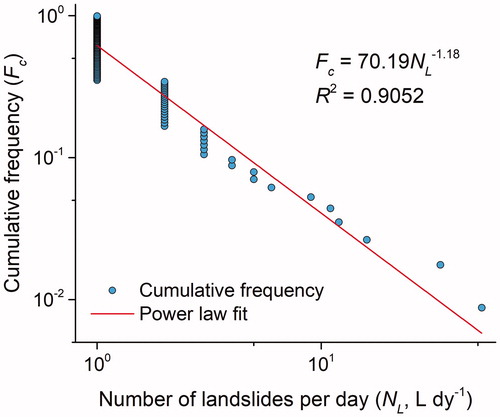
In addition, the cumulative frequency of the number of landslides per day, i.e. the occurrence frequency of more than a certain number of landslides, was a variable of interest. Therefore, we calculated the cumulative frequency distribution of the number of landslides per day on log–log axes. As illustrated in , the cumulative distribution decreased rapidly with the increasing number of landslides per day. According to EquationEq. (1)(1)
(1) , the cumulative distribution was best described by an inverse power law (self-similar) function with a negative scaling exponent of −1.18 ().
Figure 7. Cumulative frequency distribution of the number of landslides per day.
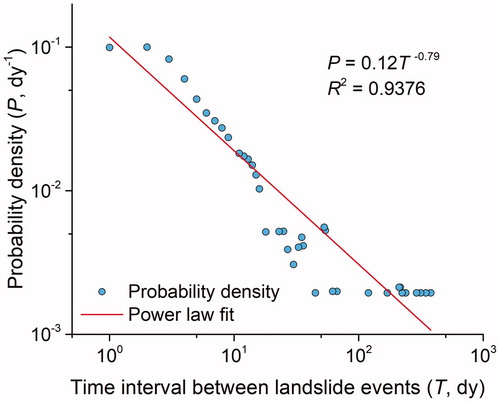
Furthermore, time interval analysis can reveal the reoccurrence of landslides. Therefore, we analyzed the time interval between landslide events. We found the time interval between landslide events ranged between 1 and 380 days, with an average of 30.97 days. This finding indicated that the landslide events were frequent, and the mean time of reoccurrence was approximately 1 month in the study area. A time interval equal to 1 day accounted for 34% of the total number of time intervals between landslide events. This finding indicates that landslides are not randomly distributed in time.
The probability density of the time interval can be used to estimate and predict the future occurrence of landslides. Therefore, we fitted the relationship between probability density (P) and the time interval between landslide events (T) by using EquationEq. (2)(2)
(2) . The results showed that there was an obvious power law relationship between probability density (P) and the time interval between landslide events (T) that could be represented by the following function: P = 0.12 T−0.79 (R2 = 0.9376, p < 0.01) ().
Figure 8. Probability density of the time interval between landslide events.
3.1.4. Case studies
As illustrated in , there were many rainfall triggered landslides in 2005, 2007, 2009 and 2010. Further analysis of the data revealed that the landslides in 2005, 2007, 2009 and 2010 were mainly concentrated into one or 2 months in each of those years. Moreover, we found that the landslides that occurred in those four years were significantly influenced by high-intensity intraday rainfall and long-term antecedent rainfall. Here, we defined antecedent rainfall as the daily rainfall in a period preceding a landslide event. To investigate the relationship between landslide occurrences and rainfall, we chose four case studies in 2005, 2007, 2009 and 2010 as follows:
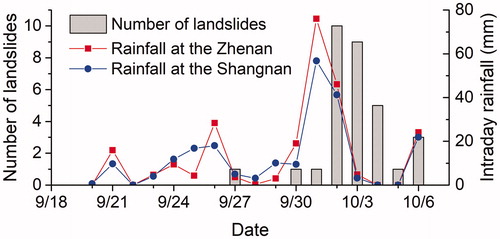
First, we used prolonged rainfall-induced landslide and rainfall data from September 20, 2005, to October 6, 2005, as a case study to determine the general relationship between landslide occurrence and intraday rainfall (). Thirty-one landslides were triggered by continuous and high-intensity rainfall during this period. For these dates, the antecedent rainfall was relatively low before October 1, 2005, and only two landslides were triggered by continuous rainfall. However, long-term antecedent rainfall saturated the soil. As a result, many landslides after October 1 were triggered by long-term antecedent rainfall and high intraday rainfall. After October 1, the number of landslides decreased with decreasing intraday rainfall. However, the peak rainfall amount occurred on October 1, but the most of the landslides (10 landslides) occurred on October 2. This result indicates that there is a lag effect between the landslide occurrence and intraday rainfall.
Figure 9. Intraday rainfall and number of landslides from September 20 to October 6, 2005.
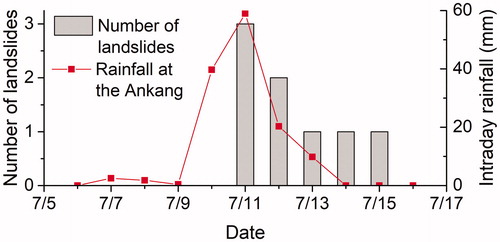
Second, we observed landslide occurrence and intraday rainfall from July 6 to July 16, 2009 (). Three landslides occurred on July 11, 2009. Subsequently, the number of landslide events decreased with decreasing precipitation. There was no precipitation on July 15 and 16, 2009, but two landslides occurred on these dates because of antecedent precipitation. No landslides occurred on July 10, 2009, although precipitation fell on this date. This finding indicated that a lag effect between the occurrence of landslides and intraday rainfall also existed for this period.
Figure 10. Intraday rainfall and number of landslides from July 6 to July 16, 2009.
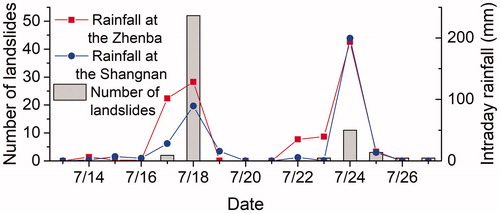
Third, we used the rainfall-induced landslide occurrence from July 13 to July 27, 2010, as another case study (). Seventy-one landslides were triggered by high-intensity rainfall during this time. In this case, most of the landslides occurred on July 18, 2010, and July 24, 2010, when the rainfall was heaviest. Fifty-two landslides occurred on July 18, 2010, which accounted for approximately 68% of the total landslides in 2010. In this case, the peak of the number of landslides was consistent with the peak intraday rainfall.
Figure 11. Intraday rainfall and number of landslides from July 13 to July 27, 2010.
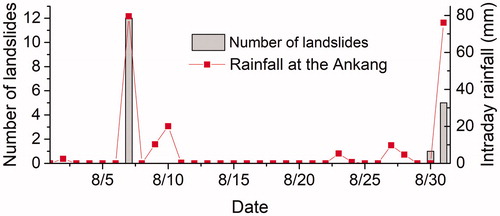
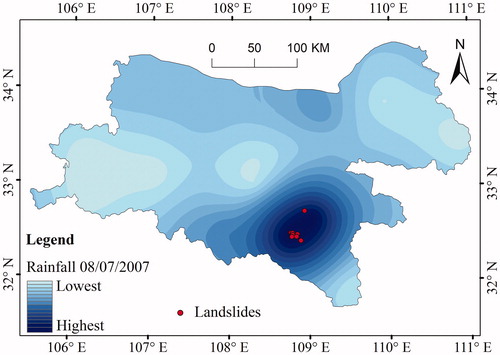
Last, a landslide event was observed in August 2007 (). Most of the landslides with the heaviest rainfall occurred on August 7, 2007, and August 31, 2007. Twelve landslides occurred on August 7, 2007, which accounted for approximately 35% of the total landslides in 2007. Again, the peak number of landslides was consistent with the peak intraday rainfall ().
Figure 12. Intraday rainfall and number of landslides in August 2007.
3.2. The spatial distribution of landslides in the Qinba Mountains
3.2.1. The density and mean distribution center of landslides in the Qinba Mountains
Landslide intensity or spatial density describes how many landslides are found in a given area. Based on EquationEq. (3)(3)
(3) and Equation(4)
(4)
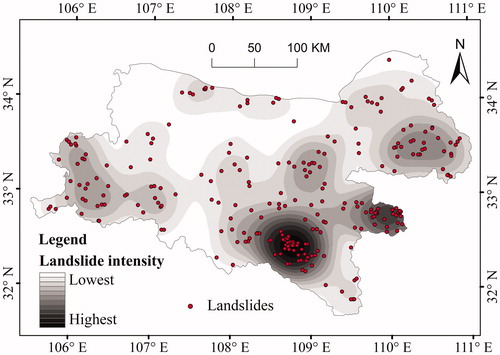
(4) , we generated landslide intensity using kernel density estimation (). The results showed that the landslide distribution exhibited a strongly heterogeneous pattern and was clustered. There were obvious clustered centers where many landslides occurred. Conversely, few landslides occurred in certain areas that are not sensitive to landslides. Most of the landslides were concentrated southeast of the Qinba Mountains, and few landslides occurred in the northwestern Qinba Mountains. The landslide events gradually decreased from southeast to northwest of the Qinba Mountains.
Figure 13. Landslide intensity map generated using kernel density estimation.
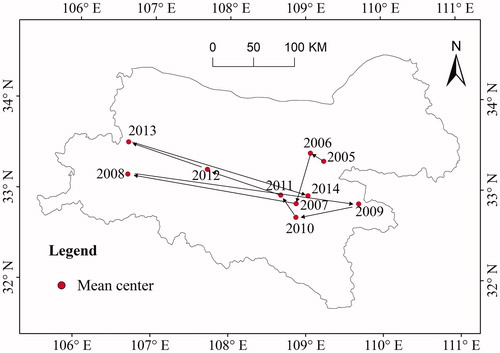
The mean center can be used to identify the geographic center (or the center of concentration) for a set of features. The mean center of landslides can reveal the feature of spatial distribution and the center of concentration for a set of landslides. Based on EquationEq. (5)(5)
(5) , we calculated the mean centers of landslides each year. The results showed that the mean center moved every year (). The mean centers in most of the years were concentrated in the eastern Qinba Mountains. Only three mean centers—in 2008, 2012 and 2013—were concentrated in the western Qinba Mountains. Thus, the landslides were concentrated in the eastern Qinba Mountains in most years.
Figure 14. The mean center of the landslide distribution each year.
3.2.2. The spatial distribution pattern of landslides in the Qinba Mountains
Spatial distribution patterns are one of the most fundamental concepts in earth science. Point spatial distribution patterns of landslides can be categorized as random, dispersed and clustered. To quantitatively reveal the spatial distribution pattern of landslides, we conducted an ANN analysis using EquationEqs. (6)(6)
(6) and Equation(7)
(7)
(7) to analyze the spatial distribution of landslide points in the Qinba Mountains. The results showed that the ANN ratio is 0.54, which is less than 1. This finding indicated that the landslide points are clustered in the study area. Moreover, the z-score is −15.26, which is less than −2.58. This result further indicated that the spatial distribution of all landslides in the Qinba Mountains was clustered at the 0.01 significance level. In addition, we calculated the ANN and z-score each year and found that the landslide distribution was clustered at the 0.01 significance level in most years except 2006, 2011, 2013 and 2014.
3.2.3. The cause of spatial landslide clustering in the Qinba Mountains
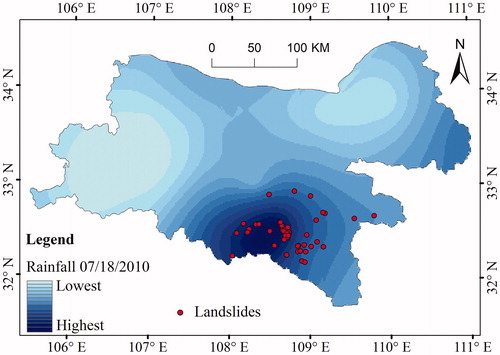
The spatial distribution of landslide events is related to intensive rainfall and earthquakes. The obvious conclusion regarding landslides triggered by rainfall is that they respond to high-intensity rainfall events. We interpolated the spatial rain gauge data via ordinary kriging to generate the spatial distribution of rainfall. shows the spatial distribution of intraday rainfall and landslide events that occurred on July 18, 2010. Many landslides occurred on this date in the southern Qinba Mountains due to high-intensity rainfall. As illustrated in , there was an obvious intraday rainfall center. The spatial distribution of landslides was strongly coincident with the center of high-intensity intraday rainfall. All landslides on this date occurred in the center or near the center of high-intensity intraday rainfall. This result implies that the center of high-intensity intraday rainfall greatly influenced the landslide events.
Figure 15. Spatial distribution of daily rainfall on July 18, 2010, coinciding with a landslide.
Similarly, shows the spatial distribution of intraday rainfall and landslide events that occurred on July 24, 2010. High-intensity rainfall occurred in the southeastern Qinba Mountains, and 11 landslides occurred in this area on this date. shows the spatial distribution of intraday rainfall and landslide events that occurred on August 7, 2007. Twelve landslides concentrated on the high-intensity rainfall center. The high-intensity rainfall event coincided with landslide events.
Figure 16. Spatial distribution of daily rainfall on July 24, 2010, coinciding with a landslide event.
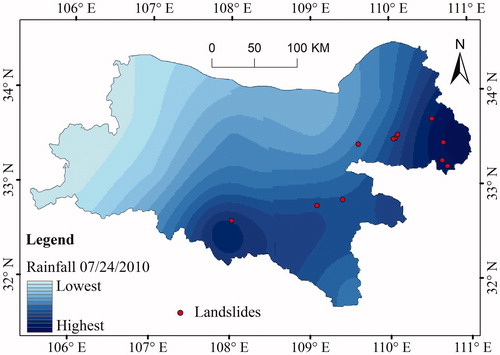
Figure 17. Spatial distribution of daily rainfall on August 7, 2007, coinciding with a landslide event.
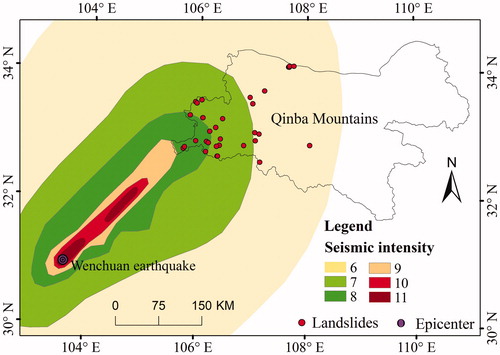
Earthquakes can lead to many landslides throughout the world. In the present study area, some of the landslides were triggered by earthquakes. For example, 34 landslides were triggered by the Wenchuan earthquake on May 12, 2008, in the study area (). As shown in , many landslides occurred in the southeastern Qinba Mountains, near the epicenter of the earthquake. The landslide density decreased with increasing distance from the epicenter.
Figure 18. Spatial distribution of landslides triggered by the Wenchuan earthquake on May 12, 2008.
4. Discussion
Landslides are complex natural phenomena that represent serious hazards and are generally associated with various triggers, including earthquakes, prolonged rainfall, volcanic eruptions and large storms (Malamud et al. Citation2004; Guzzetti et al. Citation2009). To predict when and where landslides will occur in the future, the causes of landslides must be clarified. Although several factors can trigger landslides, rainfall and earthquakes are considered the two major mechanisms (Keefer Citation1984; Dai et al. Citation2002; Crosta Citation2004; Khattak et al. Citation2010).
4.1. The relationship between landslides and annual rainfall
Annual rainfall has always appeared as a factor of landslide susceptibility in assessments in previous publications (Guo et al. Citation2015). However, the results of the present study show that there was no correlation between landslide events and annual rainfall because the high-intensity rainfall events were not revealed by annual rainfall. This result suggests that it is not appropriate to consider annual rainfall as a factor in landslide susceptibility assessments.
4.2. Monthly variations of landslide distribution
Macciotta et al. (Citation2017) found that the monthly number of landslides exhibits a von Mises distribution, and the temporal distribution of landslides has been found to be associated with weather seasonality. The von Mises distribution can be used to predict the probabilities of landslide records in different months (Macciotta et al. Citation2017). In this study, we found that the number of landslides in different months exhibited a multimodal distribution, and the landslide events were related to monthly precipitation with R2 = 0.7192 at the 0.05 significance level.
4.3. Time series of historical landslide events
Many researchers have shown that the landslide frequency-size distribution in log–log coordinates typically obeys a power law correlation for larger landslides, and there is a point on this curve at which the data on smaller landslides fall below the power law; we called this phenomenon the rollover effect (Van Den Eeckhaut et al. Citation2007; Frattini and Crosta Citation2013; Qiu et al. Citation2018). However, little attention has been devoted to the analysis of the time series of landslide events (Rossi et al. Citation2010; Witt et al. Citation2010). Some authors found that the non-cumulative frequency or probability density of number of landslides per day follows a power law, Zif and Zeta distribution (Rossi et al. Citation2010). In the previous section, we found that the cumulative frequency of number of landslides per day followed a power law distribution with a scaling exponent of −1.18 ().
The probability distribution of the time interval can be used to estimate the temporal occurrence of landslides in an area (Witt et al. Citation2010). Recently, many authors have proposed that the probability distribution of a time interval in many environmental time series follows exponential, Weibull, Poisson and binomial distributions (Guzzetti et al. Citation2005; Blender et al. Citation2008; Witt et al. Citation2010). In this work, we found that the probability density of the time interval between landslide events was well approximated by a simple negative power law function, which was appropriate for the landslide catalog in the research area.
4.4. The relationship between landslides and extreme precipitation
Precipitation is one of the most active factors in the models that forecast landslides (Guo et al. Citation2013; Chen and Cui Citation2017; Cui et al. Citation2017). Among these models, the rainfall intensity–duration (I–D) relationship is the most discussed approach (Caine Citation1980; Corominas and Moya Citation1999; Brooks et al. Citation2004; Cannon et al. Citation2008). In this article, we discuss the relationship between landslides and extreme precipitation. Climate extremes and intensive rainfall events are presumed to intensify in frequency and magnitude. We found that the high-intensity intraday rainfall strongly influenced the distribution of landslide events within the region. Many landslides were triggered by a single high-intensity precipitation event. For example, seventy-one landslides were triggered on July 18, 2010, due to a storm in the Qinba Mountains. In addition, it is possible to classify the landslides triggered by rainfall into two types: landslide events lagging behind the intraday rainfall and landslide events coinciding with the intraday rainfall. Furthermore, antecedent rainfall is an important factor in triggering landslides because it can reduce soil suction and increase the pore-water pressure in soils (Guo et al. Citation2013; Ma et al. Citation2014). Future research should also consider the contributions of antecedent precipitation (Cheng et al. Citation2018) before the landslide events together with the landslide initiation mechanism, especially the migration of fine particles as proposed by Cui et al. (Citation2017).
4.5. The relationship between landslides and geohazard migration
The previous results indicate that the average numbers of landslides from 2005 to 2010 and 2011 to 2014 were 43 and 9, respectively. The landslide events from 2005 to 2010 were more severe than those from 2011 to 2014. One of the most important reasons is that the government in Shaanxi Province has implemented an extensive migration plan to mitigate geohazards. The migration plans conducted in each year from 2011 to 2014 involved 24, 29.5, 22.8 and 11.7 million migrants, respectively. The pressure on the environment has been decreasing due to geohazard migration in recent years in the Qinba Mountains. This result implies that proper geohazard migration plans can significantly decrease the number of landslides and casualties and the amount of property damage.
4.6. Landslide distribution pattern
In the present work, the results showed that the spatial distribution of landslides was clustered, and the clustering was statistically valid. The results in the current study are similar to findings from Guthrie and Evans (Citation2004), who found that the spatial distribution of landslides exhibited a clustered distribution pattern by using nearest neighbor analysis and density contour methods.
We further found that intraday rainfall and earthquakes can provide better explanations for the clustering of landslides within the study area. The clustered centers of landslides are coincident with the centers of high-intensity rainfall and earthquake events (). This result is similar to those reported in previous studies (Cui et al. Citation2011; Pánek et al. Citation2011; Posner and Georgakakos Citation2015).
5. Conclusion
The analysis of the spatial and temporal distributions of landslides demonstrated that landslides were clustered in both time and space. The interannual landslide distribution exhibited variations, and there was no clear correlation between landslide events and annual rainfall. The statistical analysis of landslides and monthly rainfall suggested that landslides were particularly abundant in certain months, which differed among years. The cumulative frequency decreased as the number of landslides per day increased, and this relationship could be approximately revealed by a negative power law function. In addition, the probability density of the time interval between landslide events could also be described by a power law regression. Moreover, our results underline the fact that intraday rainfall significantly influences landslide events. Furthermore, our results suggest that there are several clustered centers on the landslide spatial distribution map. The mean centers of landslide distribution moved from one place to another between years primarily because of the distributions of rainfall and earthquakes. Although this work may be limited by data collection, we expect that the trends can be applied to landslide prediction and risk management in the Qinba Mountains.
Acknowledgments
This work was funded by the National Natural Science Foundation of China (Grant no. 41771539), Strategic Priority Research Program of Chinese Academy of Sciences (Grant no. XDA20030301) and International Partnership Program of Chinese Academy of Sciences (Grant no. 131551KYSB20160002). We warmly thank the anonymous reviewer and the Editor, whose constructive and helpful comments substantially improved this manuscript.
Disclosure statement
No potential conflict of interest was reported by the authors.
Additional information
Funding
Related Research Data
References
- Blender R, Fraedrich K, Sienz F. 2008. Extreme event return times in long-term memory processes near 1/f. Nonlin Process Geophys. 15(4):557–565.
- Brooks SM, Crozier MJ, Glade TW, Anderson MG. 2004. Towards establishing climatic thresholds for slope instability: use of a physically based combined soil hydrology-slope stability model. Pure and Applied Geophys. 161(4):881–905.
- Cai X, Wu Z, Cheng J. 2013. Using kernel density estimation to assess the spatial pattern of road density and its impact on landscape fragmentation. Int J Geogr Information Sci. 27(2):222–230.
- Caine N. 1980. The rainfall intensity–duration control of shallow landslides and debris flows. Geogr Ann. Ser A: Phys Geogr. 62(1–2):23–27.
- Cannon SH, Gartner JE, Wilson RC, Bowers JC, Laber JL. 2008. Storm rainfall conditions for floods and debris flows from recently burned areas in southwestern Colorado and southern California. Geomorphology. 96(3–4):250–269.
- Carrara A, Cardinali M, Detti R, Guzzetti F, Pasqui V, Reichenbach P. 1991. GIS techniques and statistical models in evaluating landslide hazard. Earth Surf Process Landforms. 16(5):427–445.
- Cascini L, Cuomo S, Della Sala M. 2011. Spatial and temporal occurrence of rainfall-induced shallow landslides of flow type: a case of Sarno-Quindici, Italy. Geomorphology. 126(1–2):148–158.
- Chen XZ, Cui YF. 2017. The formation of the Wulipo landslide and the resulting debris flow in Dujiangyan City, China. J Mt Sci. 14(6):1100–1112.
- Cheng D, Cui Y, Su F, Jia Y. 2018. The characteristics of the Mocoa compound disaster event, Colombia. Landslides 15:1223–1232.
- Chu HJ, Liau CJ, Lin CH, Su BS. 2012. Integration of fuzzy cluster analysis and kernel density estimation for tracking typhoon trajectories in the Taiwan region. Expert Syst Appl. 39(10):9451–9457.
- Collins BD, Kayen R, Tanaka Y. 2012. Spatial distribution of landslides triggered from the 2007 Niigata Chuetsu–Oki Japan Earthquake. Eng Geol. 12714–26.
- Crosta GB. 2004. Introduction to the special issue on rainfall triggered landslides and debris flows. Eng Geol. 73(3–4):191–192.
- Corominas J, Moya J. 1999. Reconstructing recent landslide activity in relation to rainfall in the lLobregat River basin, Eastern Pyrenees, Spain. Geomorphology. 30(1-2):79–93.
- Cui P, Chen X-Q, Zhu Y-Y, Su F-H, Wei F-Q, Han Y-S, Liu H-J, Zhuang J-Q. 2011. The Wenchuan earthquake (May 12, 2008), Sichuan province, China, and resulting geohazards. Nat Hazards. 56(1):19–36.
- Cui Y, Zhou X, Guo C. 2017. Experimental study on the moving characteristics of fine grains in wide grading unconsolidated soil under heavy rainfall. J Mt Sci. 14(3):417–431.
- Dai FC, Xu C, Yao X, Xu L, Tu XB, Gong QM. 2011. Spatial distribution of landslides triggered by the 2008 Ms 8.0 Wenchuan earthquake, China. J Asian Earth Sci. 40(4):883–895.
- Dai FC, Lee CF, Ngai YY. 2002. Landslide risk assessment and management: an overview. Eng Geol. 64(1):65–87.
- Dai FC, Lee CF. 2002. Landslide characteristics and slope instability modeling using GIS, Lantau Island, Hong Kong. Geomorphology. 42(3–4):213–228.
- Frattini P, Crosta GB. 2013. The role of material properties and landscape morphology on landslide size distributions. Earth Planet. Sci. Lett. 361:310–319.
- Froude MJ, Petley DN. 2018. Global fatal landslide occurrence from 2004 to 2016. Nat Hazards Earth Syst Sci. 18(8):2161–2181.
- Guo XJ, Cui P, Li Y. 2013. Debris flow warning threshold based on antecedent rainfall: a case study in Jiangjia Ravine, Yunnan, China. J Mt Sci. 10(2):305–314.
- Guo C, Montgomery DR, Zhang Y, Wang K, Yang Z. 2015. Quantitative assessment of landslide susceptibility along the Xianshuihe fault zone, Tibetan Plateau, China. Geomorphology. 248:93–110.
- Guthrie RH, Evans SG. 2004. Analysis of landslide frequencies and characteristics in a natural system, coastal British Columbia. Earth Surf Process Landforms. 29(11):1321–1339.
- Guzzetti F, Carrara A, Cardinali M, Reichenbach P. 1999. Landslide hazard `evaluation: an aid to a sustainable development. Geomorphology. 31(1–4):181–216.
- Guzzetti F, Reichenbach P, Cardinali M, Galli M, Ardizzone F. 2005. Probabilistic landslide hazard assessment at the basin scale. Geomorphology. 72(1-4):272–299.
- Guzzetti F, Ardizzone F, Cardinali M, Rossi M, Valigi D. 2009. Landslide volumes and landslide mobilization rates in Umbria, central Italy. Earth Planet Sci Lett. 279(3–4):222–229.
- Huang R, Li W. 2011. Formation, distribution and risk control of landslides in China. J Rock Mech Geotech Eng. 3(2):97–116.
- Huang R. 2009. Some catastrophic landslides since the twentieth century in the southwest of China. Landslides. 6(1):69–81.
- Huang R, Fan X. 2013. The landslide story. Nat Geosci. 6(5):325–326.
- Hovius N, Stark CP, Hao-Tsu C, Jiun-Chuan L. 2000. Supply and removal of sediment in a landslide-dominated mountain belt: Central Range, Taiwan. J Geol. 108(1):73–89.
- Jarman D. 2006. Large rock slope failures in the Highlands of Scotland: characterisation, causes and spatial distribution. Eng Geol. 83(1–3):161–182.
- Keefer DK. 1984. Landslides caused by earthquakes. Geol. Soc. Am. Bull. 95:406–421
- Khattak GA, Owen LA, Kamp U, Harp EL. 2010. Evolution of earthquake-triggered landslides in the Kashmir Himalaya, northern Pakistan. Geomorphology. 115(1–2):102–108.
- Kirschbaum D, Stanley T, Zhou Y. 2015. Spatial and temporal analysis of a global landslide catalog. Geomorphology. 249:4–15.
- Lang A, Moya J, Corominas J, Schrott L, Dikau R. 1999. Classic and new dating methods for assessing the temporal occurrence of mass movements. Geomorphology. 30(1–2):33–52.
- Larsen IJ, Montgomery DR. 2012. Landslide erosion coupled to tectonics and river incision. Nat Geosci. 5(7):468–473.
- Li W-y, Liu C, Hong Y, Zhang X-H, Wan Z-M, Saharia M, Sun W-W, Yao D-J, Chen W, Chen S, et al. 2016. A public Cloud-based China’s Landslide Inventory Database (CsLID): development, zone, and spatiotemporal analysis for significant historical events, 1949–2011. J Mt Sci. 13(7):1275–1285.
- Luo W, Yan T, Gong J. 1996. Application of Morishita spread index to the study of the time and spatial distribution characteristics of landslides. Geol Sci Technol Information. 15(2):95–98. (in Chinese).
- Ma T, Li C, Lu Z, Wang B. 2014. An effective antecedent precipitation model derived from the power-law relationship between landslide occurrence and rainfall level. Geomorphology. 216:187–192.
- Macciotta R, Hendry M, Cruden DM, Blais-Stevens A, Edwards T. 2017. Quantifying rock fall probabilities and their temporal distribution associated with weather seasonality. Landslides. 14(6):2025–2039.
- Malamud BD, Turcotte DL, Guzzetti F, Reichenbach P. 2004. Landslide inventories and their statistical properties. Earth Surf Process Landforms. 29(6):687–711.
- Martin Y, Rood K, Schwab JW, Church M. 2002. Sediment transfer by shallow landsliding in the Queen Charlotte Islands, British Columbia. Can J Earth Sci. 39(2):189–205.
- Nadim F, Kjekstad O, Peduzzi P, Herold C, Jaedicke C. 2006. Global landslide and avalanche hotspots. Landslides. 3(2):159–173.
- Orozco CV, Tonini M, Conedera M, Kanveski M. 2012. Cluster recognition in spatial-temporal sequences: the case of forest fires. Geoinformatica. 16(4):653–673.
- Pánek T, Brázdil R, Klimeš J, Smolková V, Hradecký J, Zahradníček P. 2011. Rainfall-induced landslide event of May 2010 in the eastern part of the Czech Republic. Landslides. 8(4):507–516.
- Parente J, Pereira MG, Tonini M. 2016. Space-time clustering analysis of wildfires: the influence of dataset characteristics, fire prevention policy decisions, weather and climate. Sci Total Environ. 559:151–165.
- Parker R. 2013. Hillslope memory and spatial and temporal distributions of earthquake-induced landslides (Doctoral dissertation, Durham University).
- Paudel PP, Omura H, Kubota T, Inoue T. 2007. Spatio-temporal patterns of historical shallow landslides in a volcanic area, Mt. Aso, Japan. Geomorphology. 88(1–2):21–33.
- Petley D. 2012. Global patterns of loss of life from landslides. Geology. 40(10):927–930.
- Piacentini D, Troiani F, Daniele G, Pizziolo M. 2018. Historical geospatial database for landslide analysis: the catalogue of landslide occurrences in the Emilia–Romagna Region (CLOCkER). Landslides. 15(4):811–822.
- Posner AJ, Georgakakos KP. 2015. Soil moisture and precipitation thresholds for real-time landslide prediction in El Salvador. Landslides. 12(6):1179–1196.
- Qiu H, Cui P, Regmi AD, Hu S, Zhang Y, He Y. 2017. Landslide distribution and size versus relative relief (Shaanxi Province, China). Bull Eng Geol Environ. doi: 10.1007/s10064-017-1121-5
- Qiu H, Cui P, Regmi AD, Hu S, Wang X, Zhang Y. 2018. The effects of slope length and slope gradient on the size distributions of loess slides: field observations and simulations. Geomorphology. 300:69–76.
- Rouai M, Jaaidi EB. 2003. Scaling properties of landslides in the Rif mountains of Morocco. Eng Geol. 68(3–4):353–359.
- Rossi M, Witt A, Guzzetti F, Malamud BD, Peruccacci S. 2010. Analysis of historical landslide time series in the Emilia‐Romagna region, northern Italy. Earth Surf Process Landforms. 35(10):1123–1137.
- Scott LM, Janikas MV. 2010. Spatial statistics in ArcGIS. In: Fischer M., Getis A. (eds) Handbook of applied spatial analysis. Berlin, Heidelberg: Springer
- Silverman BW. 1986. Density estimation for statistics and data analysis. New York: Chapman and Hall
- Stanley T, Kirschbaum DB. 2017. A heuristic approach to global landslide susceptibility mapping. Nat Hazards. 87(1):145–164.
- Tanyaş H, van Westen CJ, Allstadt KE, Anna Nowicki Jessee M, Görüm T, Jibson RW, Godt JW, Sato HP, Schmitt RG, Marc O, Hovius N. 2017. Presentation and analysis of a worldwide database of earthquake‐induced landslide inventories. J Geophys Res Earth Surf. 122(10):1991–2015.
- Telesca L. 2007. Time-clustering of natural hazards. Nat Hazards. 40(3):593–601.
- Teng H, Shi Z, Ma Z, Li Y. 2014. Estimating spatially downscaled rainfall by regression kriging using TRMM precipitation and elevation in Zhejiang Province, southeast China. Int J Remote Sens. 35(22):7775–7794.
- Tonini M, Tuia D, Ratle F. 2009. Detection of clusters using space–time scan statistics. Int J Wildland Fire. 18(7):830–836.
- Tonini M, Pedrazzini A, Penna I, Jaboyedoff M. 2014. Spatial pattern of landslides in Swiss Rhone Valley. Nat Hazards. 73(1):97–110.
- Tonini M, Abellan A. 2014. Rockfall detection from terrestrial LiDAR point clouds: a clustering approach using R. J Spatial Information Sci. 8:95–110.
- Tonini M, Pereira MG, Parente J, Orozco CV. 2017. Evolution of forest fires in Portugal: from spatio-temporal point events to smoothed density maps. Nat Hazards. 85(3):1489–1510.
- Valenzuela P, Domínguez-Cuesta MJ, García MAM, Jiménez-Sánchez M. 2017. A spatio-temporal landslide inventory for the NW of Spain: BAPA database. Geomorphology. 293:11–23.
- Van Asch TW, Van Steijn H. 1991. Temporal patterns of mass movements in the French Alps. Catena. 18(5):515–527.
- Van Den Eeckhaut M, Poesen J, Govers G, Verstraeten G, Demoulin A. 2007. Characteristics of the size distribution of recent and historical landslides in a populated hilly region. Earth Planet Sci Lett. 256(3–4):588–603.
- Wei F, Gao K, Hu K, Li Y, Gardner JS. 2008. Relationships between debris flows and earth surface factors in Southwest China. Environ Geol. 55(3):619–627.
- Weidinger JT, Wang J, Ma N. 2002. The earthquake-triggered rock avalanche of Cui Hua, Qin Ling Mountains, PR of China—the benefits of a lake-damming prehistoric natural disaster. Quaternary Int. 93–94:207–214.
- Wen B, Wang S, Wang E, Zhang J. 2004. Characteristics of rapid giant landslides in China. Landslides. 1(4):247–261.
- Witt A, Malamud BD, Rossi M, Guzzetti F, Peruccacci S. 2010. Temporal correlations and clustering of landslides. Earth Surf Process Landforms. 35(10):1138–1156.
- Xie Z, Yan J. 2008. Kernel density estimation of traffic accidents in a network space. Comput Environ and Urban Syst. 32(5):396–406.
- Zhang F, Huang X. 2018. Trend and spatiotemporal distribution of fatal landslides triggered by non-seismic effects in China. Landslides. 15(8):1663–1674.
- Zhao H, Yao L, Mei G, Liu T, Ning Y. 2017. A fuzzy comprehensive evaluation method based on AHP and entropy for a landslide susceptibility map. Entropy. 19(8):396.
- Zhou CH, Lee CF, Li J, Xu ZW. 2002. On the spatial relationship between landslides and causative factors on Lantau Island, Hong Kong. Geomorphology. 43(3–4):197–207.
- Zuo R, Agterberg FP, Cheng Q, Yao L. 2009. Fractal characterization of the spatial distribution of geological point processes. Int J Appl Earth Observ Geoinf. 11(6):394–402.