
 ?Mathematical formulae have been encoded as MathML and are displayed in this HTML version using MathJax in order to improve their display. Uncheck the box to turn MathJax off. This feature requires Javascript. Click on a formula to zoom.
Abstract
Nearly, a quarter of the world’s population does not have enough food for normal living and nearly 1 billion people become hungry every year. One of the reasons for undernourishment and hunger is drought, which reduces agricultural production leading to food insecurity situation. In half of the years of the twenty-first century, drought was the main cause of shortage in world grain production compared to its consumption, creating problem with food security. In November 2017, a new generation of NOAA operational satellite, JPSS-1, with VIIRS instrument on board was launched. Regarding land cover monitoring, the system was designed to advance drought detection, and improve prediction of grain loss using the highest resolution vegetation health (VH) method. The VIIRS-based VH will detect drought early, monitor accurately at 0.5 km2 resolution, provide drought intensity, duration and predict agricultural loss 2 months ahead of crop harvest. Such early estimates will predict food security situation. Examples in this article prove high accuracy of vegetation health assessment, drought-triggered crop stress and the resulting grain production loss. These applications provide 2–4 months of advanced predictions of global food insecurity and early assessments of food assistance for the countries in need.
1. Introduction
We are living in the twenty-first century. We have reached a considerable progress in industry, economy and finance. We have achieved great innovations in medicine; improving human health and extending the lifespan. In spite of this progress, today, more than 1 billion people, nearly a sixth of the world’s population, suffer from chronic hunger and malnutrition due to a lack of food (FAO Citation2017). In addition, nearly 800 million people were under-nourished (CIA Citation2017; USDA Citation2017). A serious concern is that world hunger has been increasing in recent years (FAO Citation2017; WEF Citation2017). The vast majority of the world’s hungry lives in developing countries (Gottlieb and Joshi Citation2010; USDA Citation2017). Southern Asia also faces the greatest hunger burden with about 280 million undernourished people. In sub-Saharan Africa, the rate of undernourishment is around 23% (Ephraim et al. Citation2007; WEF Citation2017). Poor nutrition causes nearly half the deaths in children under five, and one in four children suffer stunted growth (CIA Citation2017; FAO Citation2017). Unfortunately, malnutrition, including under-nutrition and micro-nutrition (nearly 2 billion people) are top contributors to global disease. In addition to malnutrition, nearly 700 million people in 76 countries are food insecure (USDA Citation2017).
One of the important reasons for undernourishment, malnutrition and hunger is global and regional drought, which reduces agricultural production. In addition to annual drought-related agricultural losses, long-term technology-increased global grain production, the principal indicator of food security, are currently growing slower than the population increase, especially in Africa (FAO Citation2017; USDA Citation2017). Future prospects are not encouraging since it will require an increase in food production of nearly 70% to feed 2 billion people more by the mid-twenty-first century (Gottlieb and Joshi Citation2010; Drought 2016; Euronews Citation2017; FAO Citation2017). This situation is further complicated by climate warming, which is assumed to intensify droughts, increasing their area, strength, duration and leading to a further reduction of agricultural production. In years, when moderate-to-intensive drought covers more than 20% of the world’s main agricultural areas, there is less food production than what the world needs for consumption. The situation has already deteriorated in the twenty-first century, when in the first 17 years, world grain production, was below consumption in almost half of the years (CIA Citation2017; USDA Citation2017; WEF Citation2017). In 2003, 2004, 2006, 2011, 2012, 2013 and even 2017 (preliminary estimates, USDA Citation2017) grain production was 3–6% below consumption (WB Citation2017). Moreover, in all of these years, drought was the major cause affecting food security and world sustainability. Although drought cannot be prevented, instead, it can be detected early and damages to agriculture could be predicted well in advance of harvest in order to providing on time food assistance to avoid hunger. Therefore, one of the most important tasks for prediction of food insecurity is to detect drought early and estimate agricultural production losses several months ahead of harvest. This is currently possible with services from a new generation of operational polar-orbiting satellites (JPSS Citation2017).
In November 2017, a new generation of NOAA operational polar-orbiting satellites, JPSS-1 (Joint Polar Satellite System), was successfully launched (November 17) and reached the polar orbit i in the early 2018. On board the satellite, there is the new Visible Infrared Imaging Radiometer Suite (VIIRS), the most advanced of its class satellite sensor (JPSS Citation2017). This new NOAA system will improve advanced high-resolution global drought detection, assessment of drought intensity, duration and will provide advanced prediction of crop and pasture losses. These assessments will provide a 2–3 months advanced notice of the world’s food security situation, which provides several months lead time for providing food assistance. The JPSS-1 system, named currently NOAA-20 (JPSS Citation2017), will continue 37-year (since 1981) operational services of NOAA afternoon polar-orbiting satellites for the next 5 years with considerably improved drought prediction and impacts assessments on agriculture and food security. The launched system will be followed by JPSS-2, -3, and -4 (NOAA-21, -22, and -23), serving the globe for the next 2–3 decades (JPSS Citation2017).
The new JPSS generation of satellites with VIIRS instruments will be extremely useful for more precise detection of drought start/end and duration, high-resolution estimation of drought area and intensity, more accurate VH-based modeling agricultural production and, what is the most important, prediction of agricultural losses up to 4 months in advance of harvest completion. Such predictions would help to identify those developing countries suffering from food insecurity and needed food assistance to avoid malnutrition and even hunger. Such lead-time of advanced agricultural assessments, especially drought-related agricultural losses, would principally be sufficient for an early prediction of food security and improving economic and social sustainability. We used the Vegetation health tool, which estimates real-time vegetation condition or health on a scale from very healthy (green, vigorous, etc.) to extremely stressed (less green or even yellow, wilting or dead, etc.). The VH tool has been applied successfully since it is based on three biophysical laws, providing universal monitoring approach to different ecosystems, estimates a combination of moisture and thermal condition of vegetation surface and verified against in situ data in nearly 30 countries.
This article describes the improved JPSS features (based on NOAA-20/VIIRS for advanced drought detection, assessment of high-resolution drought intensity, duration and, most importantly, before harvest drought-induced reduction of crop and pasture production, advancing prediction of global food insecurity. Moreover, since weekly VH data are currently available for the past 38 years (1981–2018, VH Citation2018) and the new JPSS system will provide VH data until the mid of the current century, the VH data will be extremely important for analysis of climate warming impacts on vegetation and the entire land surface change. Even now, having nearly four decades of VH data, it is possible to investigate vegetation performance and assess if drought is intensifying and expanding the area and duration, if drought-related agricultural losses are increasing and deteriorating food security and other environmental events.
2. Drought
Drought is a typical phenomenon of the Earth’s climate (Kogan et al. Citation2015; Drought 2016). Drought occurs every year without warning, does not recognize borders, political and economic differences. It has wide-ranging impacts, first not only on agriculture but also on water resources, ecosystem health, energy, forestry, transportation, recreation, food supply–demand and other resources and activities. Losses from drought, especially in agriculture, are staggering. For example, in the U.S.A., a country with quite advanced agricultural technology, the average annual drought impact on crop and pasture productivity is estimated at around $6 billion (Drought 2016; Kogan et al. Citation2016; CIA Citation2017). In extreme drought years, such as 1988, the cost jumped up to $60 billion (Kogan Citation1995; Wilhite Citation2000). World agriculture is suffering from drought in many countries, leading to food security problems, especially in the developing world. Since 2001, drought-induced losses in the 42 highest-ranking agricultural countries are estimated at around $932 billion (EM-DAT Citation2011). Between 1980 and 2008, drought affected 1.5 billion people globally (0.3 billion in India only) and killed 0.5 billion (0.3 billion in Ethiopia (NCDC Citation2011)). Economic damages from droughts in recent years were assessed at $13.7 billion in China and $6.0 billion in Australia (Drought 2016). In developing countries, drought impact is much greater, contributing severely to food shortages, famine, population displacement and even mortality. In Africa, between 1981 and 2010, drought affected millions of people leading to 0.5 million deaths (Masih et al. Citation2014). In 2010, FAO estimated that 925 million African people suffered from hunger; in 2012, 239 million people in sub-Sahara Africa suffered from hunger and starvation and future projections of change to the situation are not promising (Sasson Citation2012). The other consequence of a severe drought is the spike in food prices, riots and migration of people in neighboring countries, which occurred when thousands of Somalis had to flee to seek refuge in neighboring Ethiopia and Kenya (Sasson Citation2012). In the United States, from nearly 200 weather and climate disasters between 1980 and 2016, drought was the principal contributor to the costs and was named as a ‘14 billion-dollar’ annual event in terms of incurred losses (Drought 2016; NOAA Citation2017). More specifically, billion-dollar drought costs and damages, by states, between 2011 and 2016, are shown in (NOAA Citation2017).
Table 1. U.S. Billion-dollar Droughts and Fires Disasters in 2011–2016 (NOAACitation2017).
Drought is the most damaging environmental event, effecting global agriculture and leading to considerable losses of production, creating food insecurity. Between 2001 and 2016, nearly 20% of the world’s land was stricken by drought almost every 2 to 3 years and in some cases, that percentage was much higher (Kogan et al. Citation2015). Drought affects the largest number of people on Earth and is a very costly disaster, especially in developing countries of Africa and Asia (Drought 2016). Considerable relief from drought to food security can be achieved if drought is detected in advance of its start and if its area, duration and intensity are estimated more accurately and ahead of time. What is the most important is to predict agricultural losses 1 to 2 months in advance of harvest. Drought detection and prediction of agricultural losses based on weather station network is currently a challenging task since this network is limited and sparsely distributed, especially in Africa, the continent with the most frequent and strong droughts and food insecurity situation. Those droughts lead to malnourishment, hunger, population migration and death due to food security problem. One to two months advanced notice of drought and assessments of agricultural losses from weather observations (mostly precipitation, temperatures and indices) is also a challenging task. Therefore, during the last three-and-a-half decades, satellite data were used to develop drought monitoring and impact assessment techniques. Considerable progress was achieved when NOAA afternoon operational polar-orbiting satellites were launched and used for global drought detection (start/end), estimation of area, intensity, duration and agricultural losses prediction using the vegetation health method (Kogan Citation1995; Kogan Citation2006, Citation2001; Kogan et al. Citation2013; Kogan et al. Citation2015; Kogan et al. Citation2016; NOAA/NESDIS Citation2017).
3. Vegetation health
Drought and its impacts on vegetation is normally derived indirectly based on shortages of moisture in the soil or from a lack of rainfall or following an excessive temperatures, their indices or other environmental weather-based drought characteristics. However, it has been shown that drought can be also estimated directly from satellites measuring indirectly the amount of chlorophyll and water content converted to vegetation health. In general, if vegetation is well-developed, green, vigorous and uniformly covers an area, then vegetation has enough chlorophyll and water and is considered healthy. Oppositely, if vegetation is not well-developed, not uniform, less vigorous, wilting and less green (or yellow), then vegetation is lacking water, chlorophyll, biomass, etc. and is considered unhealthy. The last three-and-a-half decades of NOAA operational satellites in space, their sensors measured these physiological characteristics through land surface radiances, converting them to vegetation health. Between 1981 and 2011, the NOAA operational afternoon polar-orbiting satellites with the Advanced Very High Resolution Radiometer (AVHRR) sensor on board were estimating vegetation health for each 16 and 4 km2 (mid-resolution) land surface (Kogan Citation1995; Kogan Citation2006, Citation2001, Citation1997; Kogan et al. Citation2013; Kogan et al. Citation2016). From 2012, the new Visible Infrared Imaging Radiometer Suite (VIIRS) on Suomi National Polar Orbiting Partnership (S-NPP) afternoon operational polar-orbiting satellite continued the 4 km2 vegetation health assessments and also high-resolution (1 km2) vegetation health monitoring, drought detection and its impact assessment on agriculture (Kogan Citation2001, Citation2006; Kogan et al. Citation2015, Citation2016). From 2018, the new J-1/VIIRS (currently, NOAA-20) generation of operational satellites (JPSS Citation2017) is producing the highest 0.5 km2 resolution, data, considerably improving vegetation health monitoring, strongly advancing drought detection, area and intensity assessment and prediction of agricultural losses. These measurements will considerably improve food security assessment, contributing to preventing population malnutrition and even hunger.
3.1. Vegetation health method
The Vegetation Health (VH) method (Kogan Citation1987, Citation1989) includes seven steps: (1) Data collection in visible (VIS) and near infrared (NIR) reflectance and in infrared (IR) emission from land surface (including vegetation); (2) Pre- and post-launch radiance calibration, calculation of land surface reflectance and radiative temperature; (3) Derivation of NDVI from VIS/NIR and brightness temperature (BT) from IR; (4) Complete elimination of high- and low-frequency noise from NDVI & BT weekly time series; (5) Approximation of no-noise NDVI and BT annual cycle; (6) Derivation of NDVI and BT climatology (NDVImax, NDVImin, BTmax and BTmin) based on the three biophysical laws; and (7) Derivation of Vegetation Health indices.
The principles of vegetation health estimation directly from satellite measurements were based on the properties of green vegetation to reflect sunlight and emit absorbed solar radiation following vegetation productivity. Since drought reduces chlorophyll and water content in vegetation, NOAA satellite sensors measure the corresponding reflected and emitted radiation, producing unhealthy vegetation indicator. In no-drought years, satellite-based indicators estimate vegetation as healthy. From satellite-measured reflected radiation (VIS and NIR) the Normalized Difference Vegetation Index (NDVI) is derived. Emitted radiation in the IR part of solar spectrum is used to derive Brightness temperature (BT). Following physiological properties of vegetation, NDVI quantifies an intensity of photosynthetic activity, water content and absorbed energy, characterizing vegetation greenness, vigor, cover, height, phenology, ecosystem type, which are strongly related to vegetation health (Monteith Citation1972, Kogan Citation1995, Citation1997). The BT quantifies thermal conditions of vegetation, since extreme temperature could decimate vegetation (sometimes in the presence of water in the soil) in a matter of days deteriorating vegetation health (Kogan Citation2001, Citation2006; Vincent Citation2017).
Since NDVI and BT quantify both weather and climate components of the environment in vegetation health signal, in order to estimate weather-induced drought, the climate component was removed from these indices following the principles of three environmental laws: Leibig’s Law-of-minimum, Shefield’s Law-of-tolerance and the Principle of Carrying Capacity. In general, these laws require a derivation and set up for each land pixel and unit of time the multi-year environmental limits that environmental resources or habitat can support and inside which weather impact on vegetation health is estimated (Shelford Citation1931; Ehrlich and Holdren Citation1971; Kogan Citation1995; Hui Citation2006; LOM Citation2017). These limits for NDVI and BT were set up to characterize multi-year minimum (MIN) and maximum (MAX) of environmental resources or climatology. A very simple principle was established: the NDVImax from multi-year data indicates extremely healthy vegetation, estimated numerically as 100; the NDVImin in multi-year data indicate very unhealthy vegetation, estimated at zero. The BT scale is opposite since lower temperatures specify healthy vegetation (with values 100) and high temperatures specify unhealthy vegetation (with value 0). Vegetation health is an indicator to assess the health of vegetation on a scale from very healthy to completely unhealthy and with a number of intermediate conditions such as normal, slightly above or below normal and stressed.
As a result, NDVI-based Vegetation Condition Index (VCI), BT-based Temperature Condition Index (TCI) and VCI-TCI combined Vegetation Health Index (VHI) were approximated as:
(1)
(1)
where NDVI, NDVImax and NDVImin (BT, BTmax and BTtmin) are no noise weekly NDVI & BT and their 1981–2016 absolute maximum and minimum (climatology), respectively; a is a coefficient quantifying a share of VCI and TCI contribution in the VHI. Since this share is generally not known for specific crop and location, it was assumed that VCI and TCI contributions are equal (a = 0.5).
These three indices were set to assess moisture-based vegetation health from VCI, thermal-based vegetation health from TCI and their combine (moisture-thermal) contribution from VHI. All three index values change from zero, extreme stress, to 100 – very healthy (Kogan Citation1995, Citation1997, Citation2001). A simple principle was established: if vegetation is very green and vigorous, its satellite-derived numerical conditions in the form of indices (moisture, thermal and combined) are set up as very healthy (100). If vegetation is much less green, not vigorous or even wilting, vegetation state is set up as very unhealthy or extremely stressed (0). Between these two extreme conditions (very healthy and extremely stresses), vegetation health is estimated continuously providing different levels of vegetation health, such as, for stressed level: light, moderate, severe, extreme, exceptional and for healthy levels: normal, moderate, healthy, etc. Such assessment principles are applied to any stage of vegetation development and to any ecosystem and climate. A vegetation health approach was introduced in mid-1980 and was applied globally beginning in 1981 through the present using the NOAA operational afternoon polar-orbiting satellite observations. Satellite-based numerical vegetation health became quite popular and in the past 20 years, was applied to a number of scientific satellites’ records, such as MODIS, LANDSAT, SPOT and others (Saleous Citation2005; FAO Citation2017; NIDIS Citation2017).
4. Global/regional drought impacts on food security
During the operation period of NOAA afternoon polar-orbiting satellites, an extreme global drought-related vegetation stress was monitored by 4 km2 resolution VHI (moisture-thermal conditions) data. This stress area is shown in for 2012 and 2017 (NOAA/NESDIS Citation2017). In 2012, total drought-triggered vegetation stressed area (VHI <40) occupied 28% of the world’s vegetated land, including 9% areas with extreme vegetation stress, caused by exceptional drought. Compared to 2012, in 2017 total drought-induced vegetation stress (mostly lights) area occupied 17% of land with less than 1% area under strong vegetation stress. Following the results of 2012 drought impacts, global grain production was 4% below the consumption (USDA Citation2017; WB Citation2017). Among grain-producing countries, the most drought affected (red color) were the U.S.A. (contribute 15.8% to global grain production), Kazakhstan (0.8%) and eastern Brazil, mid-level drought-based vegetation stress (light red–dark yellow) was in most of Ukraine (2.2%), in southern Russia and southern Europe. Most African countries, except for northern sub-Sahara, experienced moderate-to-strong drought-triggered vegetation stress, which affected food security (WB Citation2017). Grain production was reduced, especially in Tanzania, Kenya, Ethiopia, Somalia, Zaire Angola, Zimbabwe, Morocco and Algeria, requiring food assistance (Donley Citation2016; USDA/FAS Citation2017). In Asia, mid-level vegetation stress (yellow) in 2012 was on most of India (10.5%), in southern China, and southeastern Australia. India has had problems with moderate food security in 2012 ().
Figure 1. Vegetation Health Index in summer (week 28, end of July) 2012 and 2017 (NOAA/NESDISCitation2017).
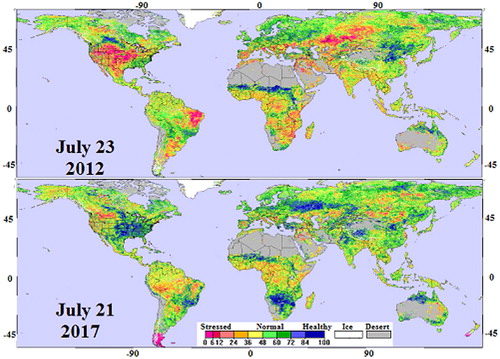
Although the summer of 2017 was less affected by drought-related vegetation stress (), some periods in 2017 were characterized by extreme vegetation stress due to a devastating drought, which affected the food security situation in Europe. An exceptional drought (in VH nomenclature) is generally rare, especially if they affect the economy of an entire country. However, such drought occurs from time-to-time and if damages are extreme and may affect the entire country, drought attract exceeding attention and are required an advanced estimation of the impact. Such unusual droughts affected western European countries, especially Portugal and Spain in fall of 2017. In these two countries, the 2017 drought left rivers nearly dry, sparked deadly wildfires and devastated crops and pastures (Vincent Citation2017). According to meteorologists (IPMA Citation2017), 2017 was classified as a very unusual drought year, since 94% of Portugal has endured ‘extreme’ (mostly thermal) drought and less than 50% of rainfall plus unusually excessive temperatures in Spain created severe drought conditions. Very devastating drought consequences were cited in the world news (Euronews Citation2017; The Guardian Citation2017). A few the most unusual drought-related environmental damages were the following: Douro River, which is one of the symbols of the Iberian Peninsula, was 60% dry by November 2017; in Portugal, 28 of the country’s water reservoirs in October were at less than 40% of their storage capacity; shortage of water was so severe that one hundred fire trucks began transporting water from one dam in northern Portugal to another that was running dry; trucks delivered water to Viseu, a city of around 100,000 residents (Vincent Citation2017). Severe water deficiency in the second half of 2017 was aggravated by excessive fall temperatures in many places of Iberian Peninsula, Italy and France. Air temperatures hit and exceeded 40 °C, which are the most sustained heatwave in Portugal since 2003 (IPMA Citation2017; The Guardian Citation2017).
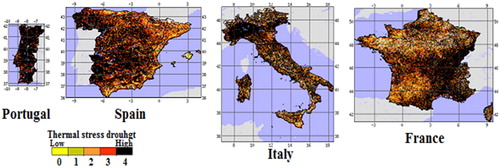
VIIRS-assessed VH-based thermal stress supports these results. demonstrates mid-day TCI-derived exceptional thermal stress in four countries. European news were focused on these areas, especially on Portugal and Spain. Such critically extreme temperature and water conditions, in addition to problems for population living, created unusual economic situation to grow enough food (Euronews Citation2017). Grains, olives and grapes were suffered from thermal and water stress (USDA/FAS Citation2017). About 1.38 million hectares of grains, sunflowers, grapes and olive trees have been affected by drought in Spain at the end of October and especially, in early November 2017 (IPMA Citation2017). The 2017 water and thermal stressed situation worsened the drought impacts on economy since the current year drought consequences were intensified through continuation of the 2016 dry conditions, which started in the second half of the year (USDA/FAS Citation2017). Following TCI estimates, the 2017 grain production was predicted to be much below historical average levels in Portugal and Spain. Their predictions indicate that, compared to the last year, grain harvest is expected to plunge up to 70% and olives harvest is expected to drop in half, compared to regular production (Euronews Citation2017; Vincent Citation2017). In addition to crops and trees devastation, grass on the pastures was very scarce and farmers had to buy much fodder for their cattle to survive. The strong food demands by the domestic livestock industry, along with limited pasture’s grass availability will contribute to an increase in the countries’ grain import needs (Vincent Citation2017; The Guardian Citation2017). Following a reduction in 2017 production of grape, Spain was going to produce much less wine. This situation would be worsened since drought affected not only in Spain but also reduced grape production in Italy and France. These two countries produce nearly 50% of world wine and due to 2017 thermal stress () the entire world would be facing a shortage of wine. Disastrous grapes harvest would lead to much higher wine prices (Euronews Citation2017). Besides production losses, severe thermals stress triggered a few fires, which killed 109 people in Portugal (Euronews Citation2017; Vincent Citation2017). We are bringing so much details of media coverage and some weather information on drought intensity and impacts in order to show that satellite-based VH assessments are well in line with in situ measurement and economic assessments.
Figure 2. Exceptional VIIRS/TCI-based thermal stress in western Europe at the end of October and early November 2017 (NOAA/NESDISCitation2017).
As has been mentioned, Africa was less affected by drought-induced vegetation stress in 2017 compared to 2012 (). However, more careful analysis of the new generation of satellite-based vegetation health, especially VH-based drought area, intensity and duration opens more interesting features of drought contribution to food security in 2017. First, it is important to mention that grain, specifically wheat, is the most important commodity for food in Africa (Donley Citation2016). In general, annual grain (including wheat) produced in Africa is not sufficient for consumption due to tremendous population growth. Unfortunately, no growth in long-term African grain production and fast widening the gap between grain production and consumption (Donley Citation2016). Therefore, African countries need to import grain. Africa accounts for 27% of the global wheat imports and in the twenty-first century the imports grew fast, at a compound annual growth rate of 3.8% (Donley Citation2016). Countries, which cannot afford the imports economically, require food assistance, especially in the years of drought-related grain losses. Following these considerations, it is important to produce more detailed analysis of drought start/end, area, intensity duration and finally predict the impacts of these characteristics on grain losses during even slightly unhealthy vegetation season.
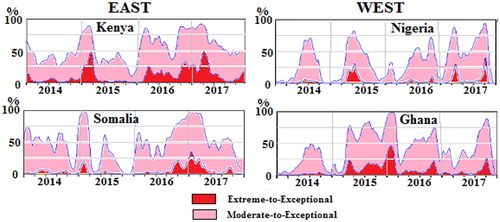
Such information is presented in , showing 2014–2017 drought characteristics in the main grain areas of eastern and western Africa. These countries are the main contributors to the regional wheat production (Donley Citation2016). Although 2017 in east and west Africa showed mostly light-to-moderate drought-related vegetation stress with only small areas of drought stronger than moderate (), VHI (moisture-thermal condition) in all four countries showed that between 50 and 90% of wheat producing regions were affected by moderate-to-exceptional vegetation stress and 25–50% by extreme-to-exceptional stress (). Moreover, drought was very long: a lighter intensity drought continued for 6–8 months and a stronger intensity drought continued for 2–4 months. Following , the largest area and the strongest drought-related vegetation stress in 2017 was in the eastern Africa, especially in Kenya. More interesting is that the 2017 drought in both Kenya and Somalia was a continuation of 2016 vegetation stress, although slightly a lighter intensity and on a smaller area. These two-year droughts produced double shortfalls of grain production (Donley Citation2016). The year 2015 was less affected by droughts in east African countries and the losses of grain production in some regions were minimal. The 2017 drought in the western Africa’s Nigeria and Ghana was less intensive, has smaller area than in east Africa and affected mostly the second half of the year. However, the 2017 drought in Nigeria and Ghana continued the droughts of 2016 and also 2015, especially in Ghana. The shortfall of grain production in the shown western African countries was estimated in all 3 years and were the largest in 2015 and the smallest in 2017.
Figure 3. Vegetation health-based drought dynamics (start/end, area intensity and duration) during 2014–2017 in countries of east and western Africa (NOAA/NESDISCitation2017).
The new generation of NOAA operational satellite system, launched at the end of 2017 will improve considerably VH-based drought monitoring. The most important improvement would be production of 0.5 km2 data, which will provide the highest resolution regularly derived drought impact on agricultural losses and food security prediction for the next two decades. The example below shows how important to have such high-resolution assessments in California. Among U.S.A.’s western states, California was the most severely drought affected, in 2012–2017, especially during 2013–2015, when an area of the strongest vegetation stress reached 70% (Howitt et al. Citation2015). This long drought had strong impacts on California’s environment, economy and society. The total drought impact on California economy was estimated at $2.74 billion (Howitt et al. Citation2015). The strongest drought impact was on agriculture and water resources. California’s agriculture provides nearly 90% of U.S.A.’s berries, nuts, some fruits and vegetables. Since California’s agriculture is widely irrigated, using 52% total water supply in dry year (Howitt et al. Citation2015), several-year drought greatly affected agriculture, leading to nearly 3% losses in crop revenue and increasing the cost of extra water pumping by 75% (Howitt et al. Citation2015). In addition, water shortages increased the amount of drought-related idle land by 45% (540,000 acres by 2015) and 21,000 total job losses. Besides, agricultural losses and water depletion, the California drought was one of the causes for intense wildfires with larger than before area and property damages.
compares 0.5 by 0.5 km resolution S-NPP/VIIRS-based Vegetation health with 4.0 by 4.0 km VH data and with 1500 by 1500 km drought assessment from US Drought Monitor (USDM). USDM is considered as the main US weekly drought product (USDM Citation2017). USDM-based drought is derived from weather data and indices (Palmer Drought Index, Standardized Precipitation Index, etc.). shows images of weather-based drought estimates in California, which has 275 weather stations. Although the number of weather stations is large, considering California area of 423,970 km2 and assuming uniform distribution of weather stations over California, one weather station characterizes environmental conditions for an area of 1542 by 1542 km, which is a very large area to have efficient weather-based drought monitoring. Therefore, drought area and intensity estimated by USDM has extremely low resolution, since at the background of droughts in all indicated years, especially extreme drought in 2015, 4.0 by 4.0 km resolution VH assessments () showed that, in addition to droughts, triggering vegetation stress (red pixels), some pixels in California indicated healthy vegetation conditions (blue and green pixels), due to irrigation of some lands or local weather events. When VH resolution was further improved with 0.5 by 0.5 km data (), the 2015–2017 images have clearly showed California’s Central Valley (CV; Kogan et al. Citation2017), not shown in . California’s CV principle crops, berries, nuts, etc. are irrigated. Following irrigation and local rainfall events, some pixels in the CV, indicate healthy vegetation (blue-green color), and areas without irrigation indicates vegetation stress (red-yellow color).
Figure 4. California’s environmental conditions in July (week 27) 2015–2017 estimated from VIIRS-based Vegetation health (a) 0.5 by 0.5 km and (b) 4.0 by 4.0 km resolution, (c) drought from US Drought Monitor (USDM) at approximately 1500 by 1500 km resolution.
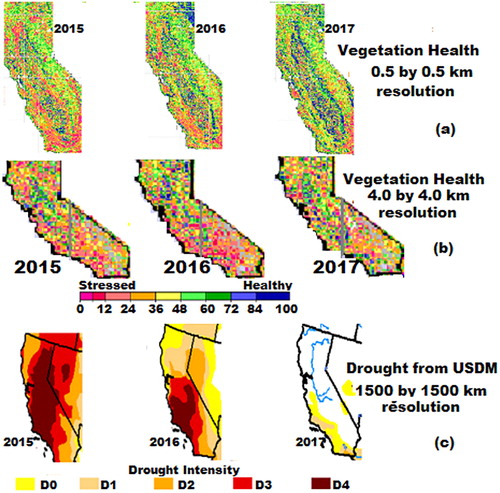
Since some CV grown crops are heavily irrigated, the advantages of the 0.5 by 0.5 km resolution data are in their ability to estimate crop/tree conditions and the need for irrigation on the area comparable to the size of approximately 200–500 acres, or 0.5–2.0 km2. Following , some irrigated areas in the Central Valley (CV) had healthy vegetation (VH >60, blue VH color) during the shown 3-year drought, which indicates that the areas are irrigated, while less or no irrigated areas indicated severe vegetation stress (VH <30, dark red color). In 2017, the areas with severe vegetation stress in the CV was reduced considerably especially in the mid-Valley. However, southeastern California (outside of the CV) remained under severe vegetation stress resulted in the stronger fire disaster in fall 2017 (Howitt et al. Citation2015; Kogan et al. Citation2017).
Finally, it is important to emphasize that VH data are used for modeling and prediction of crop yield (Kogan et al. Citation2015, Citation2016). demonstrates modeling Australian hard wheat. Australia is a major supplier of wheat to the international market being number five among the largest world grain producers (U.S.A., Russia, European Union and Canada) and exporting annually 4–8% of global grain in trade since 1980s. The lowest Australia wheat export (4%) occurs in years of intensive drought. Of the nearly 800 million hectares of Australia land, only 10% is suitable for crops and pastures. The rest are occupied by desert and dry grassland. Following Australian dry climate, wheat is completely dependent on precipitation and temperature. Therefore, high-resolution VH data, estimating moisture and thermal conditions, were tested in Australia for modeling wheat yield.
Figure 5. Modeling mean Australia wheat yield (1981–2014) and mean Kansas (U.S.A.) winter wheat yield (1985–2005) anomaly (dY, deviation from technological trend): (a) and (c) correlation of dY with weekly VHI, (b) and (d) correlation of independently modelled dY with VHI for week 38 in Australia and weeks 15–18 in Kansas (U.S.A.). Note: Area mean VHI data were calculated from 4 km resolution pixels in Australia and 16 km resolution pixels in Kansas (U.S.A.); R – correlation coefficient.
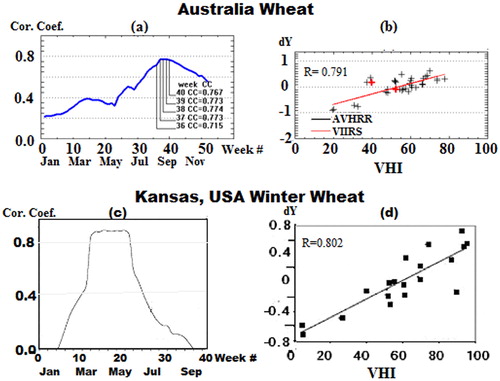
For that purpose, Australia’s area-average weekly VHI (moisture-thermal conditions) index during 1981–2014 was calculated for the major growing area of wheat, which is in the eastern edge of the continent. The 1981–2014 Australian hard wheat yield has experienced technology-improved upward trend. This trend was approximated statistically as a function of year. Weather-related fluctuations of wheat yield around the trend were approximated as a deviation ratio of actual to trend-estimated yield (dY). For yield modeling, the annual dYs were first correlated with weekly VHI data. shows dynamics of correlation coefficients of dY versus VHI. The correlation analysis indicates that in the early period of wheat season, which is pre-planting, planting and emergence (April–June, weeks 16–25), the dY-VHI correlation is low (0.25–0.35). It increases sharply during the green biomass accumulation (July–August, weeks 26–32), reaching maximum (0.71–0.76) in September-early October, weeks 33–38), during the wheat’s critical period (approximately, 2 weeks before and after heading). During this period, good water supply and cooler temperatures stimulate above trend wheat yield. Following , high and positive dY-VHI correlation during the critical period indicates that when VHI <40, indicating moisture/thermal stress (lack of water and/or hotter weather), dY is below trend. Oppositely, if VHI >60 (favorable conditions or weather is wet and cool) dY is above trend. After September–October the dY-VHI correlation is gradually declining. Since the model estimates Australian wheat yield in August, the prediction is advancing harvest for nearly 2 months. provides independent validation of the model, indicating that the predictions are quite accurate.
A very interesting question was raised by one of the reviewers: if VHI-based yield predictability improves with a higher pixel resolution (1 or 2 km2)? Unfortunately, we cannot verify that on high-resolution data since 1–2 km2 data are currently limited (2012–2017) for reliable yield modeling. However, comparing 16 km VHI-based winter wheat modeling in Kansas, U.S.A. (Kogan et al. Citation2011; ) with 4 km wheat modeling in Australia showed a similar strong dY-VHI correlation for Australia’s conditions, estimated from 4 km pixels (R = 0.791) and for Kansas estimated from 16 km pixels (R = 0.801). In addition, also indicates that in both locations dY-VHI correlation dynamics has bell-shape form: early in the season when wheat is in initial growth stage correlation is low, with season progress the correlation is increasing very fast reaching maximum by the time of crop going through the reproductive stage and fast decreasing by the crops’ harvest. More interesting, that for Australia wheat, planted early in the year, the highest correlation coincides with reproductive stage between August and September while in Kansas, winter wheat, planted in fall of previous year, has the highest correlation in March–April, when it is going through reproductive stage.
Conclusion
The presented examples with high-resolution VIIRS measurements have shown that VH data estimated accurately vegetation health, especially drought-triggered stress portion of its scale. In 2012, total VH-estimated (VHI <40) drought-affected vegetation stressed area was the largest in the past 6 years, occupying 28% of the world’s vegetated land (9% area with extreme vegetation stress). Following this drought, global grain production was 4% below the consumption. Even during much smaller area and relatively a milder global vegetation stress, the 2017 vegetation health predicted problems with food security in west and east sub-Sahara Africa, where large areas in a few countries were affected by drought two years in a row (2016 and 2017). VIIRS assessments at 0.5 km2 are extremely important for monitoring drought impacts on irrigated agriculture in order to predict irrigation time and amount of water needed, especially in case of such unusual multi-year (2012–2017) drought in California or very extreme thermal stress in fall 2017 in the western Europe. The new JPSS generation of satellites with VIIRS instrument will be extremely useful for VH-based modeling agricultural production, its prediction in advance of harvest in order to identify countries with food insecurity.
In the twenty-first century, around one-quarter of the world population has not had enough food for normal living, nearly 1 billion people became hungry, some migrated and some died every year. Moreover, the world hunger is currently on the rise and food security is the most important concerns of the society. One of the strongest contributors to food insecurity is drought, which reduces agricultural production, specifically grain, the principal staple food, affecting global population, especially in the developing countries. In November 2017, a new generation NOAA operational polar-orbiting satellite, JPSS-1 was successfully launched with the VIIRS sensor on board, which observations will improve considerably drought detection and assessment of its area, intensity, duration and impacts. The new method of estimation of vegetation health (VH) from JPSS/VIIRS will considerably improve advanced drought detection, monitoring and, what is the most important, prediction of agricultural losses with nearly 2 months ahead of grain crops harvest. Such an advanced agricultural assessment would permit to predict food security situation early enough in order to provide food assistance and to avoid hunger.
Related Research Data
References
- CIA. 2017. The world factbook. https://www.cia.gov/library/publications/the-world-factbook/geos/kz.html. Accessed May 25.
- Donley A. 2016. June 15. Sub-Saharan Africa taking in more wheat. World-Grain.com. http://www.world-grain.com/articles/news_home/Features/2016/06/Sub-Saharan_Africa_taking_in_m.aspx?ID=%7BB08ECA1C-FB6C-4B9C-9180-DAD20C6BBDC1%7D. Accessed January 13.
- Ehrlich PR, Holdren JP. 1971. Impact of population growth. Science. 171(3977):1212–1217. https://doi.org/10.1126/science.171.3977.1212.
- Ephraim M, Nkonya M, Bekele S, Msangi S. 2007. Food security in the drylands of South Asia and Sub-Saharan Africa. International Food Policy Research Institute. http://www.ifpri.org/publication/food-security-drylands-south-asia-and-sub-saharan-africa. Accessed October 21, 2017.
- EM-DAT. 2011. The international disaster database. http://www.emdat.be/old/Documents/Publications/publication_2004_emdat.pdf. Accessed October 21, 2017.
- Euronews. 2017. Devastating drought. http://www.euronews.com/2017/11/09/drought-across-spain-and-portugal-raises-alarm. Accessed December 12.
- FAO. 2017. How close we are to zero Huhnger. http://www.fao.org/state-of-food-security-nutrition/en/. Accessed May 25.
- Gottlieb R, Joshi A. 2010. Food Justice. Cambridge, MA: The MIT Press. p. 304. https://mitpress.mit.edu/books/food-justice. Accessed October 21, 2017.
- Howitt RE, MacWan D, Medellin-Azuara J, Lund JR, Sumner DA. 2015. Economic analysis of the 2015 drought for California agriculture. Davis (CA): Center for Watershed Sciences, University of California–Davis; p. 16. https://watershed.ucdavis.edu/files/biblio/DroughtReport_23July2014_0.pdf
- Hui C. 2006. Carrying capacity, population equilibrium, and environment’s maximal load. Ecol Modell. 192(1-2):317–320. doi:10.1016/j.ecolmodel.2005.07.001.
- IPMA (Instituto Portugues Meteo A). 2017. MeteoGlobal. https://www.ipma.pt/en/ and http://meteoglobal.ipma.pt/relatos/nevoeiro-13. Accessed December 12.
- JPSS. 2017. JPSS-1 has new name: NOAA-20. November 21, http://www.jpss.noaa.gov/launch.html.
- Kogan FN. 1987. Vegetation Health index for areal analysis of NDVI in monitoring crop conditions. Preprint 18th Conference on Agricultural and Forest Meteorology AMS, Boston, 103–114.
- Kogan F. 1989. Remote sensing of weather impacts on vegetation in non-homogeneous areas. International Journal Remote Sensing, 11(8), 1405–1419.
- Kogan F, Guo W, Young W. 2017. SNPP/VIIRS vegetation health to assess 500 m California drought. Geomat Nat Haz Risk. 8(2), 1383–1395. doi:10.1080/19475705.2017.1337654.
- Kogan F, Salasar L, Roytman L. 2011. Forecasting crop production using satellite-based vegetation health indices in Kansas, USA. Int J Remote Sen. 33(9), 2798–2814. doi:10.1080/01431161.2011.621464.
- Kogan F, Adamenko T, Guo W. 2013. Global and regional drought dynamics in the climate warming era. Remote Sensing Letters 4:364–372. doi:10.1080/2150704X.2012.736033.
- Kogan F, Goldberg M, Schott T, Guo W. 2015. SUOMI NPP/VIIRS: improve drought watch, crop losses prediction and food security. International Journal Remote Sensing, doi: 10.1080/01431161.015.1095370.
- Kogan F, Popova Z, Alexandrov P. 2016. Early forecasting corn yield using field experiment dataset and Vegetation health indices in Pleven region, north Bulgaria. Ecologia i Industria 9(1):76–80.
- Kogan F. 2006. Early drought detection, monitoring and assessment of crop losses from space: Global approach. In: F. Kogan, S. Habib, M. Matsuoka, editors. Disaster forewarning diagnostic methods and management. SPIE Asia-Pacific Remote Sensing, Gao, India. pp. 91–95.
- Kogan FN. 2001. Operational space technology for global vegetation assessment. Bull Amer Meteor Soc. 82(9):1949–1964.
- Kogan FN. 1997. Global drought watch from space. Bull Amer Meteor Soc. 78(4):621–636.
- Kogan FN. 1995. Droughts of the late 1980s in the United States as derived from NOAA polar-orbiting satellite data. Bull Amer Meteor Soc. 76(5):655–667.
- LOM. 2017. Liebig’s Law of the Minimum. https://en.wikipedia.org/wiki/Liebig%27s_law_of_the_minimum.
- Masih I, Maskey S, Mussá FEF, Trambauer P. 2014. A review of droughts on African continent: a geospatial and long-term perspective. Hydrol Earth Syst Sci. 18(9):3635–3649. doi:10.5194/hess-18-3635-2014.
- Monteith JL. 1972. Solar radiation and productivity in tropical ecosystems. J Appl Ecol. 9(3):747–766.
- NCDC (National Climatic Data Center). 2011. Billion dollar U.S. weather disasters. Accessed October 21, 2017. http://www.ncdc.noaa.gov/oa/reports/billionz.html.
- NIDIS. 2017. Global drought information system. https://www.drought.gov/gdm/current-conditions.
- NOAA. 2017. U.S. billion-dollar weather & climate disasters 1980-2016. https://www.ncdc.noaa.gov/billions/. Accessed June 05.
- NOAA/NESDIS 2017. Vegetation health. https://www.star.nesdis.noaa.gov/smcd/emb/vci/VH/vh_browse.php. Accessed June 05.
- Saleous NE. 2005. An extended AVHRR 8-km NDVI data set compatible with MODIS and SPOT vegetation NDVI data. Int J Remote Sen. 26(20):4485–5598.
- Sasson A. 2012. Food security for Africa: an urgent global challenge. Agriculture Food Security. 1(2). https://doi.org/10.1186/2048-7010-1-2.
- Shelford VE. 1931. Some concepts of bioecology. Ecology. 12(3):455–467. doi:10.2307/1928991. ISSN 1939-9170.
- The Guardian. 2017. Extreme heat warnings issued in Europe as temperature pass 40C. https://www.theguardian.com/world/2017/aug/04/extreme-heat-warnings-issued-europe-temperatures-pass-40c. Date of publication: August 4, 2017.
- USDA. 2017. Food security. https://www.usda.gov/topics/food-and-nutrition/food-security. Accessed December 12.
- WB. 2017. Agriculture & Rural Development. https://data.worldbank.org/topic/agriculture-and-rural-development. Accessed April 18.
- USDA/FAS. 2017. Gain Report. Global Agricultural Information Network. SP1714, June.
- USDM (US Drought Monitor). 2017. https://www.drought.gov/drought/node/25. Accessed December 12.
- VH (Vegetation Health). 2018. VH Data and Products. https://www.star.nesdis.noaa.gov/smcd/emb/vci/VH/vh_browseByCountry.php. Accessed April 18.
- Vincent P. 2017. Portugal struggle with extreme drought. Terra Daily News. Madrid, Spain. http://www.terradaily.com/reports/Spain_Portugal_struggle_with_extreme_drought_999.html. Accessed November 28.
- WEF (World Economic Forum). 2017. What are the 10 biggest global challenges? https://www.weforum.org/agenda/2016/01/what-are-the-10-biggest-global-challenges/. Accessed December 12.
- Wilhite DA. 2000. Drought as a natural disaster. In: Donald W, editor. Drought. Routledge: Routledge Hazards and Disasters Series; p. 3–19.