
Abstract
Oil spills in oceans have substantial influence on marine ecosystems. This study investigates 21 oil spills in the world. Analyzing Chlorophyll-a (Chl-a) from Moderate Resolution Imaging Spectroradiomerer (MODIS) data after Penglai oil spills on 4 June 2011, found a bloom with peak value of Chl-a (13.66 mg m−3) spread over an area of 800 km2 during 18–25 June 2011, and a pronounced increase in the monthly Chl-a concentration (6.40 mg m−3) on June 2012 in the Bohai Sea. Out of the 21 oil spills, 14 blooms were observed, while 11 blooms associated with oil spills in the time interval of 3–10 months. In total, about 75% blooms occurred during June–August. Among all 14 blooms, 72% appeared when temperature was warm (20–30 °C), 7% appeared when temperature was low (10–20 °C), and the remaining 21% occurred when temperature was lower than 10 °C. This research concludes that the odds of a phytoplankton bloom after an oil spillage are higher at the time of higher temperature (>20 °C). The short-term impact of the oil spills on ecosystem could mainly depend on the quantity and composition of oil, while the long-term impact of the oil spills on ecosystem could be related to biodegradation of microorganisms.
1. Introduction
The oil spills in the ocean can have considerable influence on marine ecology, which have become one of the serious environmental concerns. Despite declining frequency, the risk of oil spills remains high in the global. According to the report of National Oceanic Administration in 2010, in average, an oil spill happens once every 4 days in coastal areas of China.
The common list of reasons for oil spills in the ocean include offshore/onshore oil exploration, movements of oil tankers, ships, cruise sand submarines, and the waste produced due to general operation of the tankers (unloading, filling oil tankers, and cleaning) (Rogowska and Namieśnik Citation2010; Abbriano et al. Citation2011). Oil spills greatly impact shallow water and coastal resources, fishery resources, tourist industry, and ecosystems, especially mangroves, and salt marshes (Gundlach and Hayes Citation1978).
Cleaning up the affected ocean area is the first phase of the recovery in ocean conditions after an oil spill, and the recovery varies upon the ocean conditions. The BP Deepwater Horizon oil spills near the south-eastern Louisiana coast occurred on 20 April, 2010 was one of the worst oil spills in the global oil-spill history. About 200 million gallons of crude oil spilled in the Gulf of Mexico affected ocean ecology for a long time. Using ground and satellite data, photosynthetic activities and physiological status of the coastal salt marshes associated with oil spills were studied and marked decrease in photosynthetic activities (Mishra et al. Citation2012) were found. On 6 Jan 2018, the oil tanker ‘SANCHI’ collided with the Hong Kong bulk carrier CF Crystal” in the East China Sea. The ‘SANCHI’ was loaded with one million-barrel (about 136 thousand ton) gas condense that was a low-density mixture of hydrocarbon liquids of which the main component was a mixture of C5 to C11. The SANCHI’s sinking resulted in a big leaking and burning of gas, with many oil spills areas observed from found satellite images.
Oil spills form oil films on the water with different thickness. These oil films prevent the interaction between ocean and atmosphere, including the exchanges of gas, heat and energy transfer (Mei and Yin Citation2009; Ivanov Citation2011) due to pronounced reduction in refractive index of ocean surface. As a result, phytoplankton photosynthesis intensity changes drastically, increasing or decreasing depending on the type and concentration of oil spills (Gordon Jr and Prouse 1973). Numerous parameters, for example, oil type and thickness of oil spills influence algae species and marine environment (Parsons et al. Citation1976; Davenport et al. Citation1982).
Oil spills have pronounced influence on zooplankton. High concentrations of petroleum hydrocarbons enhance toxicity of ocean water that can affect the brain, liver, kidneys, and cardiac performance of aquatic and terrestrial organism (Peterson et al. Citation2003; Milinkovitch et al. Citation2013), increase mortality rate and deformity (Abbriano et al. Citation2011), decrease the survival rate of eggs and larva, and influence the growth and reproduction of zooplankton (Yang et al. Citation2009). Oil spills also influence marine mammals, birds and benthos (Banks et al. Citation2008; Jung et al. Citation2011). After the oil spills, immediate cleaning is important to avoid adverse impact on ocean ecology for long period (Bernabeu et al. Citation2013).The use of dispersants further contaminants oil and ocean water complicate the marine ecosystems (Lan et al. Citation2012; Claireaux et al. Citation2013; Milinkovitch et al. Citation2013).
Although some studies show no obvious influence of oil spills on phytoplankton, especially on community structure (Moldan et al. Citation1985; Varela et al. Citation2006) many other studies found important influence of oil spills on marine phytoplankton. In a short term, the concentrations of phytoplankton reduced, and in the long term, outbreak of algal blooms occurred when the Chlorophyll-a (Chl-a) concentration increased (Lee et al. Citation2009; Sheng et al. Citation2011; Pan et al. Citation2012). High Chl-a concentration of phytoplankton were also found soon after the oil spills (Miller et al. Citation1978; Johansson et al. Citation1980; Hu et al. Citation2011). Similar conclusion can be drawn from different regional and environmental conditions: small amount of oil spills are unable to trigger blooms in the open ocean; but in closed or semi-closed ocean, serious oil spills would lead to blooms (Zhou et al. Citation2013). Changes in the Bohai Sea ecology associated with oil spills on phytoplankton are still not well understood. Here, we have made efforts to get better understanding of changes in ocean ecology caused by the Penglai oil spills. Based on the analysis of ground and satellite data, we present a possible mechanism of algal bloom initiation associated with the oil spills.
2. Study area, data and methods
2.1 Study area and the Penglai oil spills in June 2011
The Bohai Sea is one of the Chinese marginal seas, covering an area of approximately 77,000 km2, with an average depth of 18 m. The sea surface temperature (SST) in the Bohai Sea varies in the range 0–28 °C (Tang et al. Citation2004b; Citation2006). During monsoon season (June–August) wind is southerly and during winter (December–February) season northerly wind is dominant (Sun et al. Citation2010). The Bohai Sea is covered by sea ice for about three months during November–February with relatively weak currents. Bohai Strait is only 150 km in width connect to the Bohai Sea and the Yellow Sea with water exchange between the two seas relatively feeble. Within the area of 37.12–41.00°N, 117.45–122.28°E that the Bohai Sea covers (), we have considered four sampling sites (more than 5 m deep) to study the impact of oil spills (). In the Bohai Sea, oil exploitation started in 1967, the oil and gas production has been boosted from 10 million tons per year−1 during 1967–2004 to 20 million tons annually−1 during 2004–2009, and further increased to 30 million tons a year−1in 2010. Consequently, rising oil production has led to frequent oil spills (Sun et al. Citation2009).
Figure 1 Penglai oil spills in the Bohai Sea. (a) Photos of the oil spills. (b) Affected beaches, cities and counties. (c) Polluted area due to the oil spills (from the State Oceanic Administration of the People’s Republic of China). (d) Photo of red tide on July 15, 2011 (from news.sina.com.cn). Red pentagram is the location of the oil spills and white pentagrams are the affected cities or counties.
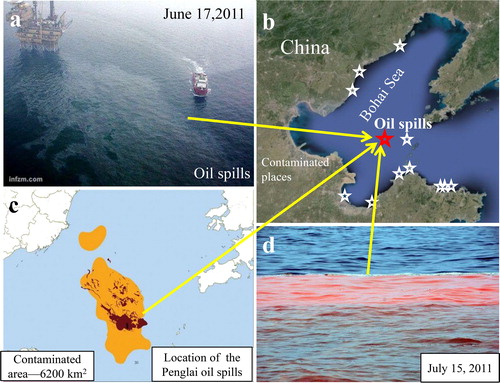
On 4 June 2011, the Penglai oil spills, occurred in the Bohai Sea and the spill continued until the end of August (). The oil spills slowly spread and seriously affected many coastal sites (). About 7,070 tons (http://china.caixin.com/2011-09-16/100305911.html) of crude oil were estimated in an area of 6,200km2 in the Bohai Sea ().The disaster was unprecedented and imposed a serious threat to biological productivity and marine ecology and continued until 2013(source - Marine Bulletin from the State Oceanic Administration (SOA) of the People’s Republic of China). On 15 July 2011—within 1 month—red tide (about 3.70 km long) was observed at a distance of ∼5.56 km from the Platform B of the Penglai Oil field and 3.70 km from Platform C ().
2.2. Study data
2.2.1. Details of the oil spills
In the present study, we used the historical data of the oil spills occurred in the Bohai Sea from various sources, such as the State Oceanic Administration of China (http://www.soa.gov.cn/), the China Oceanic Information Network (http://www.coi.gov.cn/) and the Ministry of Environmental Protection of the of China (http://www.mep.gov.cn/). The historical data are of high quality as they are using measurements from ships.
2.2.2. Remote sensing data
The temporal and spatial variability of Chl-a and SST data is taken from the Moderate Resolution Imaging Spectroradiomerer (MODIS). We have used the Chl-a data from MODIS Terra level-3 monthly (4-km resolution), 8 days (4-km resolution) and level-2 daily (1-km resolution) data. The monthly Chl-a data for the period during February 2000–January 2013 and 8 days interval Chl-a data for the period during 7 April–5 September each year during 2000–2012.
The SST data are obtained from the Ocean Color website (http://oceancolor.gsfc.nasa.gov/) for the period 2 June–5 September each year during the period 2000–2012 (8-day composite data). Both monthly (June 2011–May 2012) and daily (4 June–31 August 2011) level-3 sea surface wind field data with spatial resolution of 25 km are taken from the Advanced Scatterometer (ASCAT) onboard the European MetOp satellite (http://manati.star.nesdis.noaa.gov/). These satellite data are processed using MATLAB code and SeaDAS Version 6.2 developed by NASA.
2.3. Study methods
2.3.1. Phytoplankton blooms due to oil spills
First, selected single oil spill occurred in (the Penglai oil spills in the Bohai in 2011) and further collected 21 oil spills (listed in ) for further analysis.
Table 1. 21 serious oil spills in the world, with Information of location, time, related algal blooms and references.
Table 2. Satellite data sampling area – the locations of four boxes.
Table 3. Oily sewage discharged and drilling mud discharge from 2004 to 2007.
The time of oil spills from 1967 to 2018, the time scale was very long. The locations of oil spills in the Pacific, Atlantic, and Indian Ocean, the space was very wild. Thus, the analysis would more comprehensive.
2.3.2. Single oil spills in Bohai
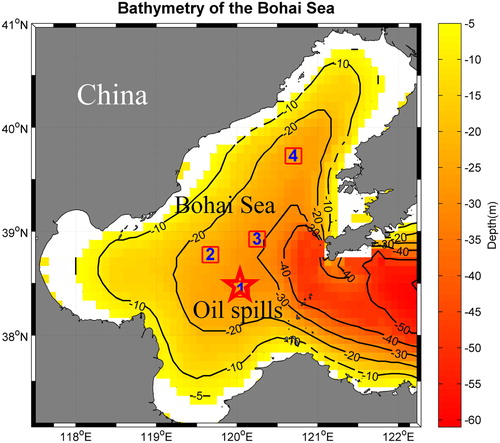
- According to the wind and flow data in the Bohai Sea, we identified the Penglai oil spills impacted area. We have considered four sampling locations (, Box 1, Box 2, Box 3, and Box 4; ) in and around the areas. The depths of all samplings are less than 30 m; Box 1 is the location of the Penglai oil spills, selecting for analysis sample of oil spills area. Box 2 is in the northwest of Box 1, selecting for analysis sample of near oil spills area, and Box 3 is in the northeast of Box 1 selecting for analysis sample of faraway oil spills area, (). Box 4 is also in the northeast of Box 1. Box 4 is far away (about 180 km) from the oil spills, selecting for a comparison analysis. We used satellite products of 8-day-average Chl-a concentration date to make 1 month average Chl-a data.
2.3.3. 21 oil spills events in the world (Table 1)
Algal blooms events were observed after oil spills, we have carried out detailed analysis to study the occurrence time, season, and interval of phytoplankton blooms as well as temperature conditions.
3. Results
3.1. Southerly wind and SST variability after the oil spills
The movement and dispersion of oil spills in the ocean water are controlled by the surface wind, ocean currents and vertical mixing. We have used monthly sea surface wind field data form of ASCAT for the period June 2011–May 2012 to study the extent of dispersion of the oil spills. The wind direction is almost southeasterly during spring (March–May) and summer (June–August), and northerly wind during autumn (September–November) and winter (December–February). Daily wind data shows southward direction during 4 June–31 August 2011. After the oil spills, the wind was mainly southeastward during June to August. It is mainly because of the summer monsoon during this period.
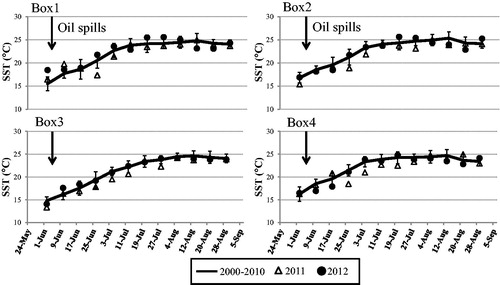
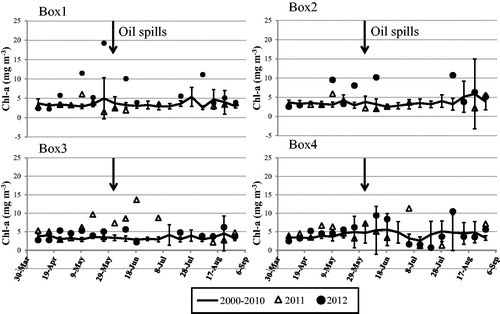
Monthly SST data do not show any pronounced changes in the Bohai Sea during February 2000–January 2013. After the oil spills, a small reduction in SST (about 2 °C) was observed in Box 1 and 4 during 25 June–3 July 2011 (), compared to the same periods during 2000–2010, and small changes in SST were observed in Box 2 and 3.
3.2. Variation of monthly Chl-a concentration
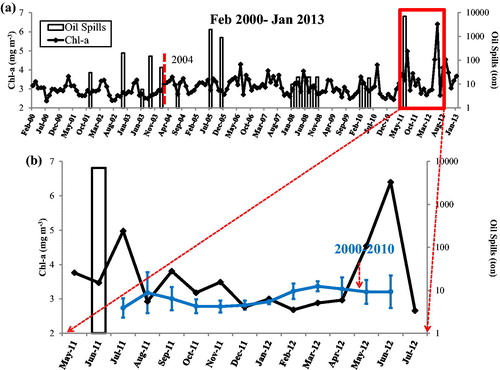
shows variations of MODIS-derived monthly Chl-a during February 2000–January 2013. Time-average Chl-a is shown by the dotted blue curve for the period of 2000–2010 (). A small change in Chl-a occurred in the Bohai Sea, with the maximum value (3.37 mg m−3) in the month of March and the lowest value (2.73 mg m−3) in the month of July. Before 2004, Chl-a was almost constant (), which is similar to the time-average value (); after 2004, the Chl-a exhibits high variance in its annual maximum and minimum values. Monthly Chl-a shows a maximum (4.97 mg m−3) in the month of July 2011 (one month after the Penglai oil spills) (). In June 2012, a pronounced increase in Chl-a (6.40 mg m−3) was observed, nearly doubling the time-average value of Chl-a (3.21 mg m−3) in the month of June during 2000–2010. In addition, the Chl-a concentration in the month of June 2012 was also the highest during February 2000-January 2013.
3.3. Variations of Chl-a (8-day mean) at four data sampling sites
3.3.1. RS detect oil spills in the Penglai 19-3 oilfield area
Envisat Advanced Synthetic Aperture Radar (ASAR) image which shows the location of oil spills was used to detect the oil spills. On 14 June 2011, the Envisat ASAR image clearly shows oil slicks in the northeast, after 10 days of the Penglai oil spills ().
The oil pollution appeared near the Penglai 19-3 Oilfield area on May 27, 2009 (), which was also confirmed by the archived data.
3.3.2. The 8-day-averaged Chl-a show an change in four sites
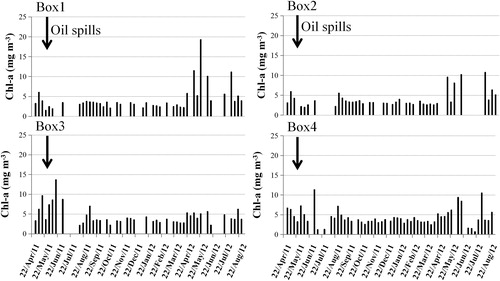
The 8-day-averaged data clearly show small changes in Chl-a for a few days after the oil spills in Box 1 and 2. Afterwards, the Chl-a concentration reached to a maximum (about 19.25 mg m−3 in Box 1, 10.19 mg m−3 in Box 2) in late May and early June 2012, specially in Box 1 (). Chl-a concentration increased (13.66 mg m−3) in Box 3 after about 20 days (), and a phytoplankton bloom appeared (MODIS image, ) on 24 June 2011 covering 800 km2 area. This bloom disappeared after 8 days. A small increase in Chl-a concentration was observed in Box 4 in early 2011 July (11 mg m−3) and 2012 mid-June (10.5 mg m−3) (, Box 4).
The 8-day-averaged Chl-a shows an enhancement in Box 1 and 2 after the oil spills during late May and early 2012 June (), and similar enhancement was observed in early 2012 August. Large increase in Chl-a concentration was observed in Box 3 during late June 2011. In Box 4, small changes in Chl-a was clearly observed in early 2011 July (5 mg m−3) and 2012 August (10 mg m−3) (), compared to the average value (3.03 mg m−3) of Chl-a during 2000–2010.
3.4. The interval between algal bloom and the oil spill
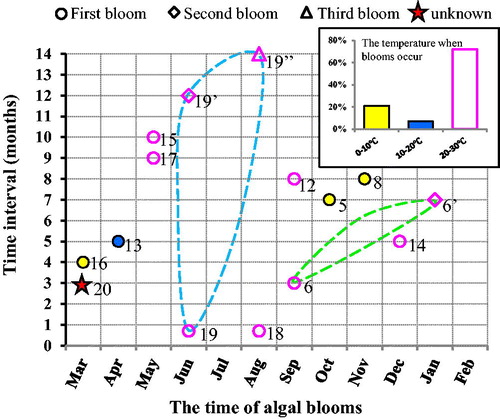
After the Penglai oil spills, three algal bloom events were observed (). lists major oil spill events in the world. Out of the 20 oil spills, 11 algal bloom events were detected after 11 oil spills (). The time interval between blooms and oil spills are found in the interval of 3 to 10 months. In some cases the interval was within 1 month, and in some other cases it was more than 12 months.
3.5. The temperature after oil spills and occurrence of blooms
After the oil spills, most frequent blooms occurred during March–May, June–August, and September–November. Three out of four blooms occurred during June–August after the Penglai oil spills. About 72% phytoplankton blooms occurred when temperature was warmer (20–30 °C), except in one case temperature was low (10–20 °C), and three blooms occurred when temperature was less than 10 °C. In Huangdao, the spills occurred on 22 Nov 2013 (), while the temperature was 9–13 °C. After the oil spills, the monthly average Chl-a concentration was 2.51–3.54 mg m−3 for the period Nov 2013–Nov 2014.
4. Discussion
4.1 Dispersion of oil spills
After oil spills, oil films formed different thicknesses over the ocean water and the dispersion of oil spills are mainly determined by the surface wind, ocean salinity, oil properties (density and dielectric properties), and SST (Singh Citation1982; Citation1984).The oil films undergo a series of physical and chemical weathering processes, such as spreading, dissolution, evaporation, drifting, sinking, emulsification, photo-oxidation, and microbial de-gradation (Medina-Bellver et al. Citation2005; Ivanov Citation2011; Joo et al. Citation2013). Wind and ocean currents are the main factors influencing oil diffusion (Le Henaff et al. Citation2012).
The surface ocean currents of the Bohai Sea, mainly from the Yellow Sea Warm Current (YSWC), show distinct in different seasons (Zou et al. Citation2005). The YSWC flows into two branches in the Bohai Sea, one branch enters the Liaodong Bay and forms an anti-clockwise circumfluence with the coastal current, the other branch goes along the Bohai Bay (Zou et al. Citation2005). Combined the wind direction, which was mostly southeast during the 3 months after the oil spills and the direction of the YSWC, the oil slicks drifted northwest and northeast of the location of the oil spills. Guo et al. (Citation2013) also observed dispersion of oil in the eastern and north-western parts of the Bohai Sea at different times from satellite (Guo et al. Citation2013). Based on the contaminated area (), wind direction, currents, satellite data (Guo, Liu and Xie Citation2013) and the oil films (), we selected four boxes (): Box 1 for oil spills area; Box 2 and Box 3 for contaminated area; Box 4 for uncontaminated area.
Figure 2 The study area with bathymetry of the Bohai Sea. Total 4 individual areas (4 red squares: Box 1, Box 2, Box 3, and Box 4) are included in the entire study area (region deeper more than 5 m). Red pentagram is the location of the 2011 oil spills, where Box 1 covers the oil spills. Blank region represents for depth shallower than 5 m. Black contours are the isobaths.
4.2. Changes in SST
A small reduction in SST appeared in Box 1 and 4, and no change in SST was found in Box 2 and 3 (). Since Box 1 is the location of the oil spills, while Box 4 is not polluted, the small reduction at these two sites clearly show that oil spills has no impact on SST. The growth of phytoplankton depends on various factors, for example, nutrients, light, SST, and wind (Tang et al. Citation2003; Citation2004a;Wang et al. Citation2010). Changes in SST was not found in enhancing Chl-a concentration, therefore, oil spills have no notable impact on SST.
Figure 3 The variability curve of SST from June 2–September 5 (2000–2012). The continuous line is the average value from 2000 to 2010. Black vertical arrow stands for the date of beginning of the oil spills.
4.3. Phytoplankton blooms and the oil spills
The Chl-a concentration before 2004 was found to be close to the mean value, while large changes in Chl-a concentration was detected afterwards (). The amount and growth rate of oily wastewater, mud and cuttings in the Bohai sea have increased every year after 2004 (marine bulletin from SOA, http://www.soa.gov.cn/zwgk/hygb/zghyhjzlgb/). The increase in oil pollution (circular shape) near the Penglai 19-3 Oilfield in the year 2009 could be due to seepage from oil platforms. Therefore, the big change in Chl-a concentration after 2004 is likely due to the considerable increase in oil pollution. There are two reasons for speculation which are domestic sewage and petroleum exploitation (), according China Marine Environmental Quality Bulletin. (State Oceanic Administration, 2004, 2005, 2006, 2007).
Figure 4 (a) Variability of Chl-a with the dates of oil spills marked by a red vertical box. The left x-axis stands for monthly mean Chl-a and the right x-axis is the amount of oil spills. (b) Blue average curve (with error bars) represents monthly mean Chl-a during 2000–2010. Blue short line means standard deviation. Black curve is the Chl-a from May 2011 to June 2012.
After the Penglai oil spills in the month of June 2011, changes in Chl-a concentration in the Bohai Sea are found about 1 month after the oil spills. Petroleum hydrocarbons influence the growth and reproduction of plankton, and zooplankton was found to be more sensitive as compared to phytoplankton to the oil. The quantity of zooplankton would greatly decrease after the oil spills. As zooplankton are mainly predators for phytoplankton, therefore, the Chl-a concentration could be increase in July 2011. Pronounced increase in the Chl-a concentration was found in June 2012, with the highest concentration (6.40 kg m−3) during February 2000–January 2013. Some ingredients of oil could persist for a long time since it is difficult for them to evaporate, such as heavy petroleum hydrocarbons (Oudot and Chaillan Citation2010; Natter et al. Citation2012). The oil spills could be one of the major contributors to the changes in Chl-a concentration in 2012.
Box 1, 2, and 3 are contaminated locations. Box 1 is the location of highly contaminated area due to the oil spills. Box 2 is in the main path of oil movement by wind and the YSWC, belong to highly polluted area, and Box 3 is part of the contaminated area. According to the satellite data ( and ), the variability of Chl-a concentration enhanced over the historical Chl-a concentration after the Penglai oil spills, and is very likely that the increase of the Chl-a is related with the oil spills, instead of other environmental factors.
Figure 5 Change of Chl-a after Penglai oil spills. Black arrows indicate the beginning date of the oil spills.
About 1 month after the oil spills, the Chl-a concentration in Box 1 and Box 2 show small changes, while Box 3 shows a largest bloom (). In a short period after the oil spills, most marine ecology could be influenced because of the toxicity of oil, depending on the type and concentrations of the oil spills. Harrison et al. (Citation1986) found that low concentrations (<100 mg/l) of polycyclic aromatic hydrocarbon (PAHs) enhance phytoplankton growth and higher concentrations (>100 mg/l) of PAHs inhibit the growth of phytoplankton; complicated hydrocarbon or high-molecular-weight would also inhibit the growth and photosynthesis of algae (Vargo et al. Citation1982; Harrison et al. Citation1986; Yang et al. Citation2009). At the same time, as zooplankton are more sensitive to oil spills due to the lack of oxygen in the water surface, quantity of zooplankton greatly decreased after oil spills (Fefilova Citation2011). The Chl-a bloom in Box 3 might be related to the decrease of predators and stimulation of oil on phytoplankton (Dunstan et al. Citation1975; Parsons et al. Citation1976).
Figure 6 Satellite images. (a) MODIS image of Chl-a on June, 24 2011, 20 days after the Penglai oil spills. Black areas are covered by clouds, or missing data. Gray area indicates the land. Thin white curve represents coastline. Numbers 1–4 represent the four boxes. Both red pentagram and “1” indicate the location of the oil spills. The algal bloom is marked by the blue dashed line. (b) Envisat ASAR image of the location of some oil slick on 14 June 2011. (c) Envisat ASAR image on 27 May 2009. Red pentagram is the location of the oil spills and the red arrow points to the location of oil slick. Yellow pentagram is the Penglai 19-3 Oilfield.
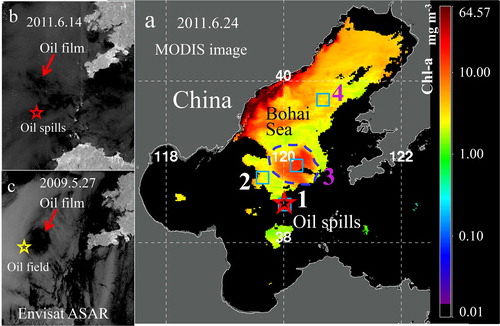
Figure 7 Variation of Chl-a from 7 April–5 September 5 (2000–2012 mean, 2011 and 2012). The Black arrow marks the beginning date of the oil spills.
About 12 months after the Penglai oil spills, the Chl-a in Box 1 and 2 increased and a phytoplankton bloom was observed ( and ). Our earlier results also show pronounced algal blooms several months after the oil spills (Sheng et al. Citation2011; Pan et al. Citation2012; Zhou et al. Citation2013), and some of the studies have shown that the algal blooms, occurred in a long time after oil spills, that could be associated with the oil spills (Jernelöv and Lindén Citation1981; Riaux-Gobin Citation1985; Peterson et al. Citation2003). After two months, another bloom appeared in Box 1 and 2 (), and the intensity of the second bloom was larger compared to the first one. Microorganism could degrade petroleum hydrocarbons (Tazaki et al. Citation2006; Almeida et al. Citation2013; Ribeiro et al. Citation2013), and the decomposition products could enhance the phytoplankton growth, which might lead to algal blooms (the first bloom-Box 1 and Box 2). Since the start time of degradation and the ability to degrade are different, depending on microorganism and environment (Atlas Citation1995; Van Hamme et al. Citation2003), the times of phytoplankton blooms are also found to be different (Atlas Citation1995).The appearance of the second bloom might be linked to bio degradation from sunken oil, which was possibly re-suspended by some ocean dynamic processes (Moonkoo et al. Citation2013). Also, sea ice, a unique feature in the Bohai Sea, was likely to affect biodegradation, which could delay the process of degradation. The characteristics of Chl-a and phytoplankton blooms in Box 1 and 2 are found to be similar ( and ).
The area shown in Box 4, near the Liaodong Bay, about 180 km away from the oil spills, may not be influenced by the oil spills and instead was more likely affected by coastal human activities. In this area, strong variations in Chl-a is observed at the time of red tide every year (Lin et al. Citation2008), which is possibly connected to the red tides in the Bohai Sea. Specifically, a large area (3452 km2) near Box 4 was affected by a red tide event during 8 June–20 August. Therefore, the change in Chl-a concentration in Box 4 was mainly due to strong red tides.
Comparisons of algal blooms occurred during three-time intervals at three locations (). The first bloom was the largest, which occurred in Box 3 and the time interval of which was about 20 days after the oil spills. The second bloom appeared in Box 1 and 2, and its time interval was 12 months. Enhancement in Chl-a concentration (in the second bloom) was very small in Box 1 and 2. After about 2 months following the second bloom, the third bloom occurred. The favorable conditions for the third bloom are the quantity and thickness of oil films, biodegradation, re-suspension of oil, and sea ice (). The possible driving factors behind the blooms, could be self-diffusion, wind and water currents (). It is observed that the blooms occur after a long-time interval of the oil spills, and the locations of those blooms might be far away from the original location depending on dispersion of oil spills, which were largely determined by the ocean currents and meteorological parameters during that period.
Table 4. The three phytoplanktonblooms associated with the Penglai oil spills in Bohai Sea in the year 2011.
4.4. Time intervals and seasons
The Bohai Sea is a semi-enclosed sea that restricts disappearance of the oil spills. The oil spills can persist for long time at the same location. This may cause several blooms.
Among all the blooms after the oil spills, the time intervals are different and most blooms appear after 3–10 months. Soon after the oil spills, the extent of affected regions depends on the wind and ocean temperature. Zooplankton was more sensitive to the lack of oxygen, it is one of the reasons that the blooms occurred about 1 month after the oil spills. After several months, the production of biodegradation of microorganisms favored phytoplankton and blooms. The time of degradation by different microbial varies in different seas and the degradation process takes several months (Atlas Citation1995). The other marine driving forces (e.g., currents or/and the process of freezing/thawing of sea ice) may delay the speed of degradation and put off the occurrence of blooms, extending the time intervals to be more than 12 months. In winter, as the oil was frozen in the ice, the oil was prevented from moving, sinking, spreading, and so decomposing. Only until spring when the temperature rose and the ice thawed, the oil then started moving again. In such way, the oil degradation was delayed.
In the northern hemisphere, where spring (March–May) and autumn (September–November) are opposite to the southern hemisphere, most of the blooms occurred after the oil spills during spring and autumn (; Diaz and Rosenberg Citation2008). This was due to favorable conditions of warmer SST (about 20–30 °C; Robarts and Zohary Citation1987).
Figure 8 The interval between algal bloom and the 20 oil spills and occurrence time of algal blooms. The dashed blue line covers the blooms after the Penglai oil spills and the green dashed line covers the blooms after the Ixtoc I oil spills.
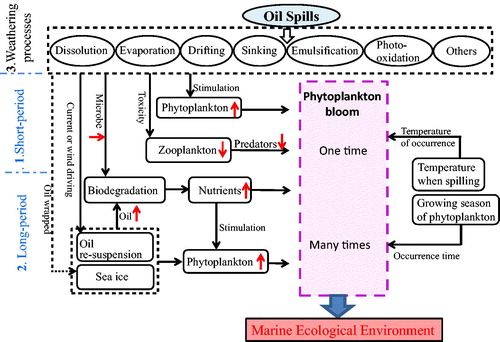
Based on our past research results (Sheng et al. Citation2011; Pan et al. Citation2012; Zhou et al. Citation2013), it is clear that oil spills influence the growth of plankton that could result in algal blooms. Meanwhile, the time interval, between oil spills and algal blooms, could be more than 10 months. The blooms after oil spills are related to growing seasons of phytoplankton and warmer SST (Zhou et al. Citation2013). Based on detailed data analysis, we have discussed possible processes and mechanisms () associated with the short- and long-term impacts on marine ecosystem due to oil spills and the factors for algal blooms. The probable causes could include: the stimulation of oil on phytoplankton, toxicity on zooplankton, biodegradation of microorganism, re-suspension of oil by wind and ocean surface currents, and the delayed biodegradation by sea ice, as well as the temperature of oil spills and growing seasons of phytoplankton (). The present study shows impacts of oil spills on marine ecosystems in the Bohai Sea, Three blooms occurred successively with variances in occurrence time, severity and location, depending on many factors. A concept model shows impacts on marine ecological environment () in short and long periods after the oil spills.
Figure 9 The concept model showing both short and long period impact of oil spills on marina ecological environment. Solid black arrows indicate relations between the two sides, and dashed black arrows suggest the potential relations.
The nutriment released from the oil decomposition was absorbed by phytoplankton and then boosted the growth of phytoplankton. The time of oil decomposition could last for a long time. Besides, there were the indirect impact of the post-oil-spill blooms, which was that the oil killed zooplankton and marine animal. Muhammad and Ahmad (Citation2017) studied the impact of pH from 8.5 to 6.5 on toxicity of crude oil WAF to white-leg shrimps, L. vannamei. Muhammad and Ahmad (Citation2017) found that the pH of 6.5 increased the toxicity of crude oil water accommodated fraction (WAF). Declining predators also contributed to the phytoplankton boom. Therefore bloom occurred a while after oil spills).
4.5 The temperature of the blooms occurred
During high temperature conditions in summer, the blooms are common, 14 phytoplankton blooms were observed after 21 oil spills. Ten (about 72%) blooms occurred when temperature was warmer (20–30 °C). The probability of post-oil-spill blooms was low when temperature was cooler, with only one bloom occurrence in the temperature of 10–20 °C, and other three blooms occurring when temperature was less than 0–10 °C. Blooms were not observed () in May 2009 when the average temperature was 16 °C (<20 °C). We also have observed oil spills on the 6 January 2018, caused by the collision of oil tankers () in the East China Sea, blooms did not occur because of low temperature (about 0 °C).
4.6. Biological actions play important role
Some of marine environmental factors, like water temperature, salinity, nitrogen and phosporus (), could affect the content of Chl-a. In the present study, oil is organic that may decompose to carbon and hydrogen, but cannot decompose to salinity, nitrogen and phosphorus. During oil spills, oil reduced the number of predator of phytoplankton, and when oil spill decomposition at last, the ingredient of decomposition can cultivate phytoplankton, biological action more adaptable to high temperature (>20 °C), so phytoplankton blooms occurred in high temperature (>20 °C) condition after oil spills. It clearly shows that the biological actions play an important role in oil spill cases.
5. Summary
The short-term impact of oil spills on ecosystem could mainly depend on the quantity and composition of oil spills, the thickness of oil slicks, and the toxicity of hydrocarbons on zooplankton (1 in ).
The long-term impact could be the biodegradation of indigenous microorganisms. Many other parameters could also affect the ecosystem, including the degree of surface wind, the strength of ocean currents, and the extent of oil spills frozen in the sea ice (2 in ).
The time interval between the accident of oil spills and the occurrence of algal blooms varies. Phytoplankton blooms generally occur during the growth season of phytoplankton or/and under warmer weather conditions.
The extent of regions affected by the oil spills can be mainly subjected to the direction of ocean wind, the strength of ocean currents and the degree of temperature. More detailed short- and long-term data of various parameters are required to understand better the speed of dispersion of oil spills, the pace of chlorophyll blooms and their impacts on the marine ecology (3 in ).
Acknowledgement
Thanks to colleagues of the Guangdong Key Laboratory of Ocean Remote Sensing (LORS) for their help in the present study.
Additional information
Funding
Related Research Data
References
- Abbriano RM, Carranza MM, Hogle SL, Levin RA, Netburn AN, Seto KL, Snyder SM, Franks PJS. 2011. Deepwater horizon oil spill: a review of the planktonic response. Oceanog. 24(3):294–301. Sep
- Almeida CM, Reis I, Couto MN, Bordalo AA, Mucha AP. 2013. Potential of the microbial community present in an unimpacted beach sediment to remediate petroleum hydrocarbons. Environ Sci Pollut Res. 20(5):3176–3184. May
- Anderson RJ, Monteiro PMS, Levitt GJ. 1996. The effect of localised eutrophication on competition between Ulva lactuca (Ulvaceae, Chlorophyta) and a commercial resource of Gracilaria verrucosa (Gracilariaceae, Rhodophyta). Hydrobiologia. 326:291–296.
- Atlas RM. 1995. Petroleum biodegradation and oil spill bioremediation. Mar Pollut Bull. 31(4-12):178–182.
- Banks AN, Sanderson WG, Hughes B, Cranswick PA, Smith LE, Whitehead S, Musgrove AJ, Haycock B, Fairney NP. 2008. The Sea Empress oil spill (Wales, UK): effects on Common Scoter Melanitta nigra in Carmarthen Bay and status ten years later. Mar Pollut Bull. 56(5):895–902. May
- Batten SD, Allen RJS, Wotton COM. 1998. The effects of the Sea Empress oil spill on the plankton of the southern Irish Sea. Mar Pollut Bull. 36(10):764–774. Oct
- Bernabeu AM, Fernandez-Fernandez S, Bouchette F, Rey D, Arcos A, Bayona JM, Albaiges J. 2013. Recurrent arrival of oil to Galician coast: the final step of the Prestige deep oil spill. J Hazard Mater. 250-251:82–90.
- Claireaux G, Theron M, Prineau M, Dussauze M, Merlin FX, Le Floch S. 2013. Effects of oil exposure and dispersant use upon environmental adaptation performance and fitness in the European sea bass, Dicentrarchus labrax. Aquatic Toxicol. 130160–170.
- Davenport J, Angel MV, Gray JS, Crisp DJ, Davies JM. 1982. Oil and planktonic ecosystems. Philos T Roy Soc B. 297(1087):369–384.
- Diaz RJ, Rosenberg R. 2008. Spreading dead zones and consequences for marine ecosystems. Science. 321(5891):926–929.
- Dunstan WM, Atkinson LP, Natoli J. 1975. Stimulation and inhibition of phytoplankton growth by low-molecular weight hydrocarbons. Mar Biol. 31(4):305–310.
- Fefilova EB. 2011. The State of a River in Pechora Basin after an oil spill: assessment of changes in zooplankton community. Water Resour. 38(5):637–649. Sep
- Gordon DC Jr, Prouse NJ. 1973. The effects of three oils on marine phytoplankton photosynthesis. Mar Biol. 22(4):329–333.
- Graham WM, Condon RH, Carmichael RH, D’Ambra I, Patterson HK, Linn LJ, Hernandez FJ. Jr 2010. Oil carbon entered the coastal planktonic food web during the Deepwater Horizon oil spill. Environ Res Lett. 5(4):045301.
- Gundlach ER, Hayes MO. 1978. Vulnerability of coastal environments to oil-spill impacts. Mar Technol Soc J. 12:18–27.
- Guo J, Liu X, Xie Q. 2013. Characteristics of the Bohai Sea oil spill and its impact on the Bohai Sea ecosystem. Chin Sci Bull. 58(19):2276–2281. Jul
- Harrison PJ, Cochlan WP, Acreman JC, Parsons TR, Thompson PA, Dovey HM, Xiaolin C. 1986. The effects of crude-oil and Corexit 9527 on marine-phytoplankton in an experimental enclosure. Mar Environ Res. 18(2):93–109.
- Hu CM, Weisberg RH, Liu YG, Zheng LY, Daly KL, English DC, Zhao J, Vargo GA. 2011. Did the northeastern Gulf of Mexico become greener after the Deepwater Horizon oil spill? Geophys Res Lett. 38:1–5.
- Ivanov AY. 2011. Remote sensing of oil films in the context of global changes. In: Remote sensing of the changing oceans. New York: Springer; p. 169–191.
- Jernelöv A, Lindén O. 1981. Ixtoc I: A case study of the world's largest oil spill. Ambio. 299–306.
- Johansson S, Larsson U, Boehm P. 1980. The Tsesis Oil-Spill - Impact on the Pelagic Ecosystem. Mar Pollut Bull. 11(10):284–293.
- Joo C, Shim WJ, Kim GB, Ha SY, Kim M, An JG, Kim E, Kim B, Jung SW, Kim Y-O, Yim UH. 2013. Mesocosm study on weathering characteristics of Iranian Heavy crude oil with and without dispersants. J Hazard Mater. 248-24937–46.
- Jung JH, Kim M, Yim UH, Ha SY, An JG, Won JH, Han GM, Kim NS, Addison RF, Shim WJ. 2011. Biomarker responses in pelagic and benthic fish over 1 year following the Hebei Spirit oil spill (Taean, Korea). Mar Pollut Bull. 62(8):1859–1866.
- Kerr RA. 1977. Oil in the ocean: circumstances control its impact. Science. 198(4322):1134–1136.
- Lännergren C. 1978. Net-and nanoplankton: effects of an oil spill in the North Sea. Bot Marina. 21:353–356.
- Lan KW, Nishida T, Lee MA, Lu HJ, Huang HW, Chang SK, Lan YC. 2012. Influence of the marine environment variability on the Yellowfin Tuna (Thunnus Alabacares) catch rate by the Taiwanese longline fishery in the Arabian Sea, with special reference to the high catch in 2004. J Mar Sci Technol. 20514–524.
- Le Henaff M, Kourafalou VH, Paris CB, Helgers J, Aman ZM, Hogan PJ, Srinivasan A. 2012. Surface evolution of the deepwater horizon oil spill patch: combined effects of circulation and wind-induced drift. Environ Sci Technol. 467267–7273.
- Lee CI, Kim MC, Kim HC. 2009. Temporal variation of chlorophyll a concentration in the coastal waters affected by the Hebei Spirit oil spill in the West Sea of Korea. Mar Pollut Bull. 58(4):496–502. Apr
- Lin FL, Lu XW, Luo H, Ma MH. 2008. History, status and characteristics of red tide in Bohai Sea. Mar Environ Sci. 27:1–5.
- Linden O, Elmgren R, Boehm P. 1979. The Tsesis oil spill: its impact on the coastal ecosystem of the Baltic Sea [water pollution]. Ambio. 8:244–253.
- Martinelli M, Luise A, Tromellini E, Sauer TC, Neff JM, Douglas GS. 1995. The M/C Haven oil spill: Environmental assessment of exposure pathways and resource injury. Proceedings of the International Oil Spill Conference; American Petroleum Institute.
- Medina-Bellver JI, Marin P, Delgado A, Rodriguez-Sanchez A, Reyes E, Ramos JL, Marques S. 2005. Evidence for in situ crude oil biodegradation after the Prestige oil spill. Environ Microbiol. 7(6):773–779.
- Mei H, Yin YJ. 2009. Studies on marine oil spills and their ecological damage. J Ocean Univ China. 8(3):312–316.
- Milinkovitch T, Thomas-Guyon H, Lefrancois C, Imbert N. 2013. Dispersant use as a response to oil spills: toxicological effects on fish cardiac performance. Fish Physiol Biochem. 39(2):257–262.
- Miller MC, Alexander V, Barsdate RJ. 1978. The effects of oil spills on phytoplankton in an arctic lake and ponds. Arctic. 31:192–218.
- Mishra DR, Cho HJ, Ghosh S, Fox A, Downs C, Merani PBT, Kirui P, Jackson N, Mishra S. 2012. Post-spill state of the marsh: remote estimation of the ecological impact of the Gulf of Mexico oil spill on Louisiana Salt Marshes. Remote Sens Environ. 118176–185.
- Moldan AGS, Jackson LF, McGibbon S, Van Der Westhuizen J. 1985. Some aspects of the Castillo De Bellver Oilspill. Mar Pollut Bull. 16(3):97–102.
- Moonkoo K, Sang HH, Jongho W, Un Hyuk Y, Jee-Hyun J, Sung YH, Joon GA, Changkyu J, Eunsic K, Gi MH. 2013. Petroleum hydrocarbon contaminations in the intertidal seawater after the Hebei Spirit oil spilleEffect of tidal cycle on the TPH concentrations and the chromatographic characterization of seawater extracts. Water Res. 47:758–768.
- Muhammad AA, Ahmad DK. 2017. pH effects in the acute toxicity study of the crude oil-WAF (water accommodated fraction) in thewhiteleg shrimp, Litopenaeus vannamei. AACL Bioflux. 10(5):1248–1256.
- Natter M, Keevan J, Wang Y, Keimowitz AR, Okeke BC, Son A, Lee MK. 2012. Level and degradation of Deepwater Horizon spilled oil in coastal marsh sediments and pore-water. Environ Sci Technol. 46:5744–5755.
- Oudot J, Chaillan F. 2010. Pyrolysis of asphaltenes and biomarkers for the fingerprinting of the Amoco-Cadiz oil spill after 23 years. Comptes Rendus Chimie. 13(5):548–552. May
- Pan G, Tang DL, Zhang YZ. 2012. Satellite monitoring of phytoplankton in the East Mediterranean Sea after the 2006 Lebanon oil spill. Int J Remote Sens. 33(23):7482–7490.
- Parsons TR, Li WK, Waters R. 1976. Some preliminary observations on the enhancement of phytoplankton growth by low levels of mineral hydrocarbons. Hydrobiologia. 51(1):85–89.
- Peterson CH. 2001. The “Exxon Valdez” oil spill in Alaska: acute, indirect and chronic effects on the ecosystem. Adv Mar Biol. 391–103.
- Peterson CH, Rice SD, Short JW, Esler D, Bodkin JL, Ballachey BE, Irons DB. 2003. Long-term ecosystem response to the Exxon Valdez oil spill. Science. 302(5653):2082–2086. Dec 19.
- Riaux-Gobin C. 1985. Long-term changes in microphytobenthos in a Brittany estuary after the Amoco Cadiz oil spill. Mar Ecol Prog Ser. 2451–56.
- Ribeiro H, Mucha AP, Almeida CM, Bordalo AA. 2013. Bacterial community response to petroleum contamination and nutrient addition in sediments from a temperate salt marsh. Sci Total Environ. 458-460:568–576. 1
- Robarts RD, Zohary T. 1987. Temperature effects on photosynthetic capacity, respiration, and growth rates of bloom‐forming cyanobacteria. N Z J Mar Freshwater Res. 21(3):391–399.
- Rogowska J, Namieśnik J. 2010. Environmental implications of oil spills from shipping accidents. In: Reviews of environmental contamination and toxicology. New York: Springer; p. 95–114.
- Sheng YL, Tang DL, Pan G. 2011. Phytoplankton bloom over the Northwest Shelf of Australia after the Montara oil spill in 2009. Geomat Nat Hazards Risk. 2:329–347.
- Singh RP. 1982. Microwave remote sensing of oil slicks over the ocean surface. Can J Remote Sens. 4:126–136.
- Singh RP. 1984. Microwave radiometry for the detection of oil films on water surfaces. Indian J Technol. 22:119–120.
- Smith JE. 1968. “Torrey Canyon” pollution and marine life. A report by the Plymouth Laboratory of the Marine Biological Association of the United Kingdom. Cambridge Univ. Press: Marine Biol. Ass. U.K.
- State Oceanic Administration, China Marine Environmental Quality Bulletin. 2001-2005.
- Sun L, Yu HM, Wang P, Chang XJ, Wang SL. 2010. Analysis of the seasonal and interannual variability of sea surface wind in the East China Seas and its adjacent ocean. Mar Forecasts. 27:30–37.
- Sun PY, Bao M, Li GM, Wang XP, Zhao YH, Zhou Q, Cao LX. 2009. Fingerprinting and source identification of an oil spill in China Bohai Sea by gas chromatography-flame ionization detection and gas chromatography–mass spectrometry coupled with multi-statistical analyses. J Chromatogr A. 1216(5):830–836.
- Tang DL, Di BP, Wei GF, Ni IH, Oh IS, Wang SF. 2006. Spatial, seasonal and species variations of harmful algal blooms in the South Yellow Sea and East China Sea. Hydrobiologia. 568(1):245–253. Sep
- Tang DL, Kawamura H, Doan-Nhu H, Takahashi W. 2004a. Remote sensing oceanography of a harmful algal bloom off the coast of southeastern Vietnam. J Geophys Res-Oceans. Mar. 5:109.
- Tang DL, Kester DR, Ni IH, Qi YZ, Kawamura H. 2003. In situ and satellite observations of a harmful algal bloom and water condition at the Pearl River estuary in late autumn 1998. Harmful Algae. 2(2):89–99.
- Tang DL, Ni IH, Muller-Karger FE, Oh IS. 2004b. Monthly variation of pigment concentrations and seasonal winds in China's marginal seas. Hydrobiologia. 511(1):1–15.
- Tazaki K, Watanabe H, Chaerun SK, Shiraki K, Asada R. 2006. Hydrocarbon-degrading bacteria and paraffin from polluted seashores 9 years after the Nakhodka Oil Spill in the Sea of Japan. Acta Geol Sin Eng Ed. 80(3):432–440.
- Van Hamme JD, Singh A, Ward OP. 2003. Recent advances in petroleum microbiology. Microbiol Mol Biol Rev. 67(4):503–549.
- Varela M, Bode A, Lorenzo J, Alvarez-Ossorio MT, Miranda A, Patrocinio T, Anadón R, Viesca L, Rodríguez N, Valdés L, et al. 2006. The effect of the “Prestige” oil spill on the plankton of the N-NW Spanish coast. Mar Pollut Bull. 53(5-7):272–286.
- Vargo GA, Hutchins M, Almquist G. 1982. The effect of low, chronic levels of no 2 fuel-oil on natural phytoplankton assemblages in microcosms.1. Species composition and seasonal succession. Mar Environ Res. 6(4):245–264.
- Wang JJ, Tang DL, Su Y. 2010. Winter phytoplankton bloom induced by subsurface upwelling and mixed layer entrainment southwest of Luzon Strait. J Mar Syst. 83(3-4):141–149. Nov
- Weeks SJ, Boyd AJ, Monteiro PMS, Brundrit GB. 1991. The currents and circulation in Saldanha Bay after 1975 deduced from historical measurements of drogues. S Afr J Mar Sci. 11(1):525–535.
- Yang SZ, Jin HJ, Wei Z, He RX, Ji YJ, Li XM, Yu SP. 2009. Bioremediation of oil spills in cold environments: a review. Pedosphere. 19(3):371–381. Jun
- Zhou L, Tang DL, Sun J. 2013. Investigation of marine phytoplankton blooms after the oil spills in the seas. Ecol Sci. 32:692–702.
- Zhou L, Tang DL, Sun J. 2014. Investigation of marine phytoplankton blooms after the oil spills in the seas. Journal of Ecological Science. 32:692–702.
- Zou B, Zou YR, Jin ZG. 2005. Analysis of characteristics of seasonal and spatial variations of SST and chlorophyll concentration in the Bohai Sea. Adv Mar Sci. 23:487–492.