
 ?Mathematical formulae have been encoded as MathML and are displayed in this HTML version using MathJax in order to improve their display. Uncheck the box to turn MathJax off. This feature requires Javascript. Click on a formula to zoom.
Abstract
Arid regions are composite of complex structures. Desertification and land degradation of these arid regions need appropriate measures in accordance with time. Hyperspectral remote sensing data sets have high potential capabilities in estimating land degradation phenomenon. Imaging spectroscopy appears to be an emerging technology for the assessment of soil properties which directly influences land degradation. In this study, soil properties were studied from the arid region in Jaisalmer, Rajasthan, India using low bandwidth data like Hyperion along visible, near-infrared and shortwave infrared (350–2500 μm) region of the electromagnetic spectrum. Spectral reflectance-based algorithms have been applied for the assessment of soil resources of arid regions. The results showed that sand, clay and organic matter content can be adequately estimated from linear models such as principal components and partial least square regression-based model over band reflectance derived from the ground observation and satellite imagery. This study might help in rapid assessment of soil properties in arid regions which might help us in periodic assessment of degradation over any region.
1. Introduction
Land degradation is an increasing problem in and around the world. Approximately, 45% of the global land surface is covered by dry lands which needs immediate attention (Asner and Heidebrecht Citation2005). Combatting land degradation requires an improved understanding of its causes, impact, degree and acquaintance with climate, soil, water, land cover and socioeconomic factors. Drylands have a complex ecosystem, it is fragile and very often subjected to land degradation. Extreme land degradation condition is often termed as Desertification manifested by ‘desert-like’ conditions in dryland regions (Rapp 1986). United Nations Convention to Combat Desertification (UNCCD) approved by 195 countries, defined desertification as land degradation in arid, semi-arid and dry sub-humid areas which may result from various factors, including climatic variations and human activities (UNCCD 1994, 2012). Spatial and temporal variability presents a major challenge to land degradation and desertification-monitoring assessment efforts in drylands. However, local-scale studies have documented natural and human-driven changes in dryland ecosystems but quantitative spatial information is still lacking on the regional scales specifically in Indian dynamics. Remote sensing is a candid choice in recent times, it has been widely applied for mapping and monitoring land degradation because it is the most cost-effective process. SPOT HRV, Landsat MSS and Landsat TM, IRS LISS III, LISS IV sensors have often been used for mapping land degradation but with the limited number of bands in these sensors helped in resulting only qualitative assessment. Thus, it is quite clear that broadband data cannot provide sufficient information to characterize quantitative difference, because their bandwidth cannot resolve diagnostic spectral features of terrestrial materials (de Jong Citation1994). Hyperspectral remote-sensing data sets provide narrow contiguous spectral bands, which can characterize the features of land degradation-affected soils clearly (Weng et al. 2010). Hyperspectral imagery uses the spectroscopy techniques over the visible, near-infrared and shortwave infrared (VNIR–SWIR) regions (350–2500 μm) as an alternative technique for the in-situ estimation of soil properties. This technique has been used for the estimation of several soil properties such as soil organic matter nitrogen content, soil electrical conductivity, cation exchange capacity, iron content, soil colour, soil moisture content, soil carbonates and soil mineralogical compositions (Ben-Dor et al. Citation2009). Thus, the successful implementation of VNIR–SWIR spectroscopic methods is needed for the exploitation of hyperspectral technology in managing soils from drylands which are very fragile and prone to rigorous land degradation. However, there are some practical limitations associated with hyperspectral imagery, which includes the non-availability of orbital data and limited spatial coverage of the existing satellite sensors (Judkins and Myint Citation2012). Inspite of these constraints, several studies have clearly shown that hyperspectral data can be used to quantify the characteristics of different types of soils at various scales. Several regression methods based on image reflectance have been used to estimate the soil properties (Farifteh et al. Citation2007). Implementation of this regression method over image spectroscopy is the need for the successful exploitation of hyperspectral technology in managing soils. A basic requirement in this approach is the availability of robust relationships between soil property of interest and its corresponding imaging spectra (Lagacherie et al. Citation2008). Principal component (PC) model and partial least square regression (PLSR) approach have capabilities, which are used to model a probable linear relationship between the spectral reflectance and the soil properties. Therefore, this study aims at understanding the spectral behaviour of the hyperspectral image with respect to the desertification studies in the arid environment. It explores the soil properties of dry lands specifically in India with a view to develop the spectral reflectance-based proximal sensing technique for rapid estimation of different soil properties using statistical models.
2. Study area
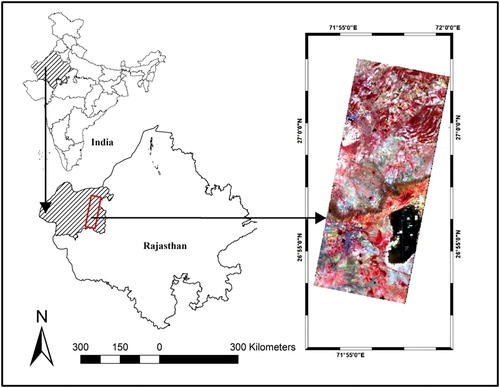
The study area is a part of Thar Desert which marks the eastern most extension of northern hemispheric mid-latitude desert belt. The exact site of the study corresponds with the coverage of the hyperspectral image over point 22°05″16′ North and 71°89″18′ East of Pokhran Tehsil, Jaisalmer district, Rajasthan, India (). The area exhibits a water balance with rainfall of 100–500 mm/a and potential evapo-transpiration ranging between 1500 and 2000 mm/a (Roy et al. 2009). The area is irrigated by Indira Gandhi Mukhya Nahar (canal) and its branches. The terrain is relatively rugged due to the formation of desert pavement and the presence of sparse vegetation. In this area, plenty of shallow and saline playas exist. They receive occasional inflow of water, due to summer monsoon, via transport of ephemeral stream sediments from surrounding highlands to playa basins and sometimes by direct precipitation. Main land use over this region has recently turned into agriculture because the area is irrigated by canal and its branches in a well-distributed network.
Figure 1. Location map of the study area.
3. Material and methods
3.1. Data used
Remote-sensing satellite data Hyperion (Earth Obsererving-1 satellite) obtained from the United States Geological Survey (USGS) https://earthexplorer.usgs.gov/ archive was acquired on 3 November 2010 (Path-150 and Row-41) in the Kharif season when vegetation vigour is maximum. Hyperion sensor is a hyperspectral data set. It has 242 bands with spectral resolution of 10 μm and spatial resolution of 30 m. Only 196 bands out of 242 bands were calibrated. These bands belong to visible-to-near-infrared (VNIR) (bands, 8–57) and shortwave-infrared (SWIR) wavelength regions (bands, 77–224) (Datt et al. Citation2003). Apart from the remote-sensing data set, survey of India toposheet at a scale of 1:50,000 and soil map by NRDBMS (Natural Resource Data Base Management System) at scale of 1:50,000 were used for cross-referencing.
3.2. Methodology
3.2.1. Pre-processing of Hyperion satellite data
The main pre-processing applied to the Hyperion imagery is briefly described in the subsequent section. The Level 1G/1T data set consists of radiometrically corrected images, formatted as HDF files (metadata in binary and ASCII formats) and terrain corrected 16-bit radiance values as GeoTIFF (Geographic Tagged Image-File Format) Hyperion imagery. These data sets were converted into ENVI format files that contain wavelength and bad band information. The entire work was performed in ENVI image-processing environment (ITT Visual Information Solutions) using the Hyperion_tools.sav toolkit. The non-calibrated bands of the Hyperion imagery (namely bands 1–7, 58–76, 77–78 and 225–242) were identified and removed. Hyperion VNIR spectrometer has 70 bands of which only 50 are calibrated, whereas the SWIR spectrometer has 172 bands of which only 148 are calibrated. The 198 calibrated bands cover the entire spectrum from 426 to 2395 μm (USGS 2008). Also, the Hyperion imagery water-absorption bands (namely bands 120–132, 165–182, 185–187 and 221–224) were eliminated in order to reduce the data that influence atmospheric scattering, water vapour absorption caused by well-mixed gases. Bands 77 and 78 were also eliminated because they had a low SNR value, and overlapped with band 56 and band 57, respectively. In the next step, the Hyperion imagery bands with vertical stripping were identified based on visual inspection and those were manually removed (namely bands 8–9, 56–57, 79–82, 97–99, 133–134, 152–153, 188, 213–216 and 219–220). Vertical stripes are caused by differences in gain and offset of different detectors in push broom-based sensors such as Hyperion (Beck Citation2003). Then, the at-sensor radiance was computed from the raw digital number (DN) values, for all remained spectral bands. This was derived by dividing the pixel’s DN by a constant value, which was 40 for the VNIR (bands 8–57) and 80 for the SWIR (bands 79–224). Hyperion radiance values were atmospherically corrected and converted into surface reflectance images using the Fast Line-of-sight Atmospheric Analysis of Hyper cubes (FLAASH) algorithm. The FLAASH is based on standard equation for spectral radiance at a sensor pixel, L that applies to the solar wavelength range, Lambertian materials or their equivalents. The equation is as follows:
Where:
ρ is the pixel surface reflectance, an average surface reflectance for the pixel and a surrounding region, S is the spherical albedo of the atmosphere, La is the radiance back scattered by the atmosphere, A and B are the coefficients that depend on atmospheric and geometric conditions but not on the surface. The values of A, B, S and Lα are strongly dependent on the water vapour column amount and the aerosol optical depth. (Kaufman et al. Citation1997; Perkins et al. Citation2005). In this case, an average aerosol optical depth was considered as 0.3 as Jaisalmer is often influenced by dust aerosols and water vapour column retrieved was 0.66 cm.
3.2.2. Field investigation and spectral measurement
The field work was undertaken in July 2015. Random sampling was done and a total of 141 locations were identified and soil samples were collected with Global Positioning System (GPS) localizations. Field spectral measurements were carried out on a clear, sunny day using a high-spectral resolution ASD, which operates in the VNIR and SWIR (350–2500 μm). For each sample, 20 individual measurements were taken consecutively and averaged to present the spectral characteristics. The field spectra collected in this research were used for comparison with the Hyperion image generated spectra.
3.2.3. Principal component analysis of spectra
Principal component analysis (PCA) is a very effective statistical method in reducing a large set of variables into a much smaller set of independent variables while retaining information content (Tabachnick and Fidel Citation1996). The PCA transforms a number of correlated variables into a number of uncorrelated variables called PCs (Bair et al. Citation2006). Mathematically, PCA produces linear combinations of the observed variables and therefore it is possible to reconstruct the original spectra by applying the appropriate coefficients to the major PCs followed by a recombination procedure (Rabbette and Pilewskie 2002). Among the entire PCs, the first PC accounts for maximum variability in the data as possible as the other PCs. In this study, PCA of spectra was carried out to reduce the dimension of raw data set to some extent of numbers for better realization and further analysis. In brief, 95% of total variation in data was considered in final spectral data with reduced dimensions. The eigenvalue of each PC indicates the amount of variation explained.
3.2.4. Partial least square regression model
The PLSR algorithm integrates the compression and regression step and it selects successive orthogonal factors that maximize the co-variance between predicted and observed variables (Maitra and Yan 2008). The PLSR model was used, keeping in view its advantages. PLSR technique reduces the data dimension, considering the target variable and input relationship. For each target variable, the component set will be different. Optimal number of components is decided by checking the root mean squared error (RMSE) between observed and predicted components. Optimal number of components corresponds to first local minima. Finally, the PLSR model with optimum number of components was used for tenfold cross-validation and corresponding prediction accuracy of soil properties was measured. For using the PLSR method, 15 bands of EO-1 Hyperion were chosen from the calibrated bands as they showed comparatively better correlation with electronic conductivity and pH. The bands chosen for this are listed in .
Table 1. Selected bands from Hyperion data sets used for the study based on correlation coefficient of spectral bands with soil characteristics EC and pH.
4. Result and discussion
4.1. Soil reflectance spectra
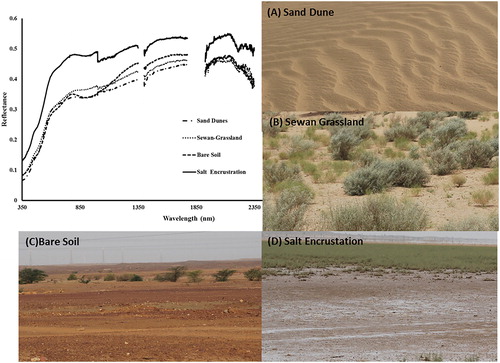
Wide variation was observed in soil spectra across the study area. Specifically, in the SWIR region, peak reflectance ranged between 0.3 and 0.55 μm. Two distinct absorption features were observed near 1400 and 1900 μm, showing the characteristics of water-absorption features of these soil spectra. Selected spectra from the study area are shown in , representing different land use situations covering different types of features present in the area. As shown in , the overall soil spectral brightness in arid grasslands is higher than that in open dunes, which may be due to the difference in particle size distribution and carbon content. Sand content in sand dune site was around 90% and arid grass land site was around 82–85%, respectively, gradually away from these two sites sand content reduces considerably. However, earlier studies over this region documented by Santra et al. (Citation2015) clearly explain that inorganic carbon content in the form of CaCO3 was more in arid grassland site than the sand dunes which ultimately resulted in brightness of the spectra in each case of arid grasslands. The lower part of the study area is a depression often termed as playas which clearly exhibits the presence of salt due to higher rate of evaporation in this region. These areas have marshy soil and most often the salt is clearly visible on the surface. The spectral signature of this region shows the highest reflectance among all the land cover. Bare soil has typical characteristics, this soil surface is undisturbed dry, compact, even and smooth which evenly reflects back the sunlight.
Figure 2. Soil spectral signatures in and around Pokhran, Jaisalmer Rajasthan. (A) sand dune, (B) sewan grassland, (C) bare soil and (D) salt encrustation.
4.2. Soil properties
4.2.1. Descriptive statistics
Descriptive statistics of soil properties are summarized in . Soil pH is generally found more than 8 with an average value of 8.58. Such soil reactions are characteristics of desert soil. Soil EC ranged from 0.12 to 34.2 (mSm–1).Organic carbon content has been found very low for most of the soil samples with an average content of 0.12%. Average sand content in the soil samples is 82.56%, representing the predominance of aeolian activity in the region. Consequently, clay and silt contents of soils are 7.54 and 4.5%, respectively. Histogram of soil properties is shown in . From the histogram plot, it is clear that only organic matter content is normally distributed, whereas other soil properties are skewed. Electrical conductivity is positively skewed with almost half of the soil samples having EC >0.15 mSm–1; similarly, sand content is highly negatively skewed with most of the soil samples having the value of 82%. Both the silt and clay are positively skewed but mostly clay has been found between 12.6% except few outliers.
Figure 3. Histogram of soil properties; (A) pH, (B) electrical conductivity, (C) organic carbon content(%), (D) sand content (%), (E) silt content (%) and (F) clay content (%).
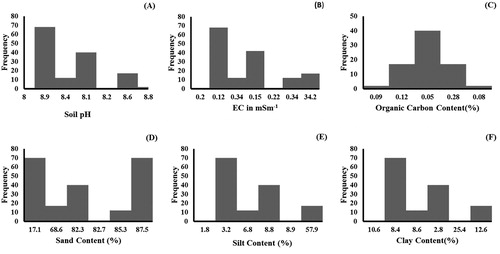
Table 2. Descriptive statistics of soil properties from the study area.
4.3. Correlation matrix
Correlation among soil properties is summarized in . Organic carbon content appears to be significantly correlated with EC (r = 0.89) sand content (r = –0.655) and clay content (r = 0.54). Soil properties, correlationship with PCs and band reflectance were checked before using the linear model for the prediction of soil properties. Correlation between soil properties and PCs is listed in . PC1 showed significant correlation with EC, OC sand and clay content. PC2 showed significant correlation with EC, OC, sand and clay content. PC3 showed significant relation with EC and no other properties may be due to the particle size distribution. From the correlation table, it is noted that pH was not significantly correlated with any of the three PCs.
Table 3. Correlation matrix of soil properties and different spectral signatures.
Correlation between soil properties and derived band reflectance from spectral data corresponding to spectral bands of Hyperion is provided in . Some spectral band reflectance showed significant correlation with OC, EC, sand, and clay content. Soil pH and silt were not found significantly correlated with spectral band reflectance. shows the significance of p values for understanding the statistical significance for the above analysis.
Table 4. The p values of PCs and the Hyperion bands which are significantly correlated.
4.4. Algorithms used for the estimation of soil properties
4.4.1. Principal components of spectra
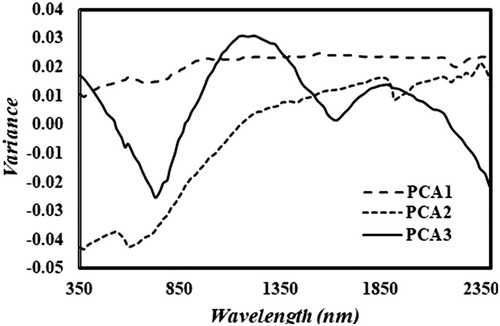
Large data sets often are difficult to be interpreted. Principal component analysis is a technique for reducing the dimensionality of such data sets and increases interpretability by minimizing information loss. New uncorrelated variables that successively maximize variance are created. These new variables in the PCs help to reduce an eigenvalue/eigenvector problem as the new variables are defined by the data set itself. In this study, three major PCs explain about 95% variation in data sets; due to this reason 660 spectral data set dimension was reduced to three prominent dimensions of PC. As shown in , it was observed that the first PC has positive values for the entire range of wavelength and thus it may be represented as the overall brightness of the spectra. Second PC has some negative values in the visible region and had been changed to positive higher values in SWIR region and therefore it may be considered as a representative of slope in the spectra. Third PC has higher loadings in the wavelength regions with absorption feature of sand and clay, thus, may be considered to represent the absorption features of the soil spectra. However, from these three major PCs, clear inference can be drawn that each of the soil types are well separated.
Figure 4. Variance of first three PC spectra in VIS–NIR–SWIR region.
4.4.2. PLSR-based estimation of soil properties
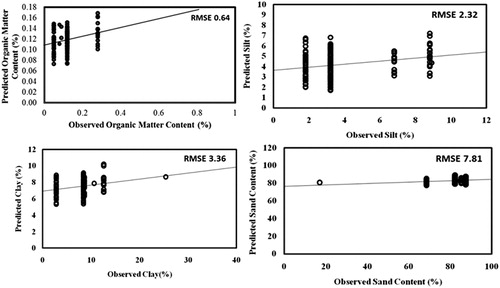
The PLSR-based models were used to estimate the soil properties. Although the PLSR technique is quite similar with PC analysis in regrouping the data with reduced dimensions capturing the most variations in data set, it has an additional advantage of selecting components as per target variable. Optimal number of components in PLSR model was decided according to the first local minima of RMSE estimate. The scores of major components were plotted to see the percentage variation of data explained by respective component (). In case of sand and silt, 75% of variation was observed, whereas organic matter silt and clay content showed over 70 and 90% of variation. These were explained by four major components. Thus, the relative importance of components in relation to target variable has been considered in PLSR analysis, which is generally ignored in PCA analysis. The correlationship between observed and predicted variable of each soil property was measured and shown in for understanding the accuracy of the model.
Figure 5. Plots showing variance of soil properties in each data components.
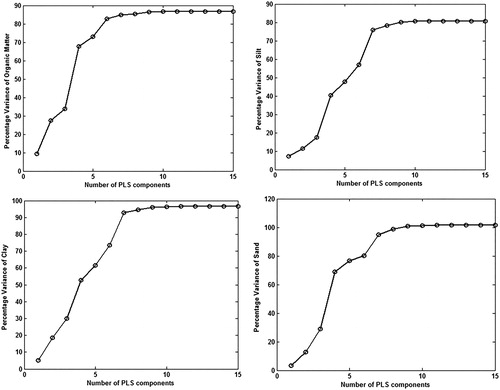
Figure 6. Observed and predicted values of soil properties using PLSR analysis.
4.5. Application of the algorithm to the satellite images
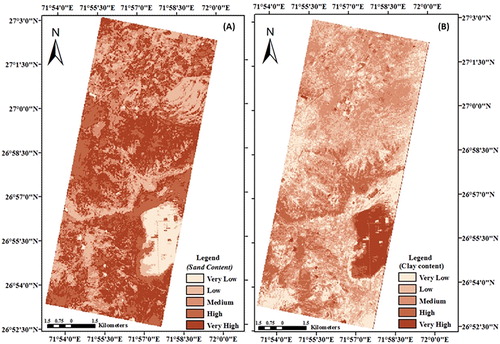
The knowledge derived from the relationship between soil properties and proximally measured spectral reflectance characteristics varies when applied to the remote sensing platform depending on several factors such as spectral resolution, atmospheric behaviour, surface roughness, soil moisture content, soil particles size, land surface composition, and so on. Here, an effort has been made to estimate few soil properties using the Hyperion data set. It was seen that sand and clay were quite moderately predicted by the above algorithms with a correlation of 0.54 and 0.47, respectively, in each case. shows the estimation of sand content in the study area and shows the estimation of clay content in the study area from reflectance of EO-1 Hyperion data sets. However, pH, EC and silt were not satisfactorily predictable in this study. Land surface reflectance corresponding to the sampling points located within the scene was extracted from Hyperion image and seen that correlation coefficients estimated using the measured and extracted EC and pH values from the Hyperion surface maps showed negative correlation. However, many researchers have reported that the soil salinity assessment by using multispectral and hyperspectral band reflectance using different types of derived indices such as normalized difference salinity index, salinity index, brightness index, and so on, but from satellite-measured band reflectance and not from proximally measured reflectance data sets. This may be because of the heterogeneity of land surface with scattered vegetation in most of the sampling points of the study.
Figure 7. (A) The estimation of sand content in the study area and (B) the estimation of clay content in the study area from reflectance of EO-1 Hyperion data sets.
5. Conclusion
Land degradation has become a major environmental problem in the world today. Governments in from different nations have been laying more emphasis on the matter as it is such a complex phenomenon which needs to be well understood based on some basic rules. Understanding land degradation helps to manage land resource as it plays a significant part in interactions between human society and the ecosystem. This article uses imaging spectroscopy to identify soil properties which will help to arrest land degradation phenomenon. Spectral reflectance from Hyperion data set corresponding to ground measurement was derived. The PC and PLSR models were applied to understand soil properties. Three major PCs were identified to explain the total variation in spectra by PC model. These PCs represented overall brightness, slope of VIS–NIR–SWIR region and the absorption features of the spectra, respectively. Linear regression model is applied to relate soil properties with PCs and derived band reflectance. Sand and clay content of the study area were more or less satisfactorily estimated from the linear models. Organic carbon content was also found satisfactorily correlated with spectral data, however; soil pH, electrical conductivity and silt could not be satisfactorily predicted using the spectral reflectance data. The PLSR-based model was found better than the PC-based multiple regression models for estimating soil properties from reflectance data. The RMSEs of predicted sand content (%) and clay content (%) were found to be 4.47 and 3.01, respectively. It may be concluded that soil spectral information has a great potential for the rapid assessment of soil resources. It has a special relevance in arid region for translation of ground-based spectral algorithm to remote-sensing platform as the abstraction of soil reflectance by canopy vegetation and atmospheric cloud is negligible in the arid ecosystem. In addition, robust algorithms relating to soil resources with spectral data may be developed in future involving raw spectra as well as other secondary products.
Acknowledgments
The authors are thankful to Tapan Mishra, Director, Space Application Centre (ISRO), Dr. Rajkumar, Deputy Director, EPSA for their support in this work. The authors are also thankful to Dr. P. C. Moharana, Principal Scientist, Centre for Arid Research Institute (CAZRI) for his co-operation in field trip.
Disclosure statement
No potential conflict of interest was reported by the authors.
References
- Asner GP, Heidebrecht KB. 2005. Desertification alters regional ecosystem–climate interactions. Global Change Biol. 11(1):182–194.
- Bair E, Hastie T, Paul D, Tibshirani R. 2006. Prediction by supervised principal components. J Am Stat Assoc. 101(473):119–137.
- Beck R. 2003. EO-1 user guide v. 2.3. Cincinnati, Ohio: Department of Geography University of Cincinnati.
- Ben-Dor E, Chabrillat S, Demattê JAM, Taylor GR, Hill J, Whiting ML, Sommer S. 2009. Using imaging spectroscopy to study soil properties. Remote Sens Environ. 113:S38–S55.
- Datt B, McVicar TR, Van Niel TG, Jupp DL, Pearlman JS. 2003. Preprocessing EO-1 Hyperion hyperspectral data to support the application of agricultural indexes. IEEE Trans Geosci Remote Sens. 41(6):1246–1259.
- de Jong SM. 1994. Applications of reflective remote sensing for land degradation studies in a Mediterranean environment. Koninklijk Nederlands Aardrijkskundig Genootschap.
- Farifteh J, Van der Meer F, Atzberger C, Carranza EJM. 2007. Quantitative analysis of salt-affected soil reflectance spectra: a comparison of two adaptive methods (PLSR and ANN). Remote Sens Environ. 110(1):59–78.
- Judkins G, Myint S. 2012. Spatial variation of soil salinity in the Mexicali valley, Mexico: application of a practical method for agricultural monitoring. Environ Manag. 50(3):478–489.
- Kaufman YJ, Wald AE, Remer LA, Gao BC, Li RR, Flynn L. 1997. The MODIS 2.1-/spl mu/m channel-correlation with visible reflectance for use in remote sensing of aerosol. IEEE Trans Geosci Remote Sens. 35(5):1286–1298.
- Lagacherie P, Baret F, Feret JB, Netto JM, Robbez-Masson JM. 2008. Estimation of soil clay and calcium carbonate using laboratory, field and airborne hyperspectral measurements. Remote Sens Environ. 112(3):825–835.
- Maitra S, Yan J. 2008. Principle component analysis and partial least squares: two-dimension reduction techniques for regression. Appl Multivar Stat Models. 79:79–90.
- Perkins T, Adler-Golden S, Matthew M, Berk A, Anderson G, Gardner J, Felde G. 2005. Retrieval of atmospheric properties from hyper and multispectral imagery with the FLAASH atmospheric correction algorithm. In: Remote Sensing of Clouds and the Atmosphere X (Vol. 5979, p. 59790E). International Society for Optics and Photonics.
- Rabbette M, Pilewskie P. 2002. Principal component analysis of Arctic solar irradiance spectra. J Geophys Res. 107(C10):8049.
- Rapp A. 1986. Introduction to soil degradation processes in drylands. Clim Change. 9(1–2):19–31.
- Roy PD, Nagar YC, Juyal N, Smykatz-Kloss W, Singhvi AK. 2009. Geochemical signatures of Late Holocene paleo-hydrological changes from Phulera and Pokharan saline playas near the eastern and western margins of the Thar Desert, India. J Asian Earth Sci. 34(3):275–286.
- Santra P, Singh R, Sarathjith MC, Panwar NR, Varghese P, Das BS. 2015. Reflectance spectroscopic approach for estimation of soil properties in hot arid western Rajasthan, India. Environ Earth Sci. 74(5):4233–4245.
- Tabachnick BG, Fidell LS. (1996). Using Multivariate Statistics, 3rd edn. New York: Harper Collins.
- UNCCD. 1994. United Nations Convention to Combat Desertification in countries experiencing serious Drought and/or Desertification, Particularly in Africa [Report]. Paris: United Nations.
- UNCCD. 2012. United Nations Convention to Combat Desertification [Report]. www.unccd.int: United Nation.
- USGS. 2008. EO1. User Guide [Report]. http://eo1.usgs.gov/userGuide/index.php?page=program, Viewed 01.05.08 – [s.l.].
- Weng YL, Gong P, Zhu ZL. 2010. A spectral index for estimating soil salinity in the Yellow River Delta Region of China using EO-1 Hyperion data. Pedosphere. 20(3):378–388.