
 ?Mathematical formulae have been encoded as MathML and are displayed in this HTML version using MathJax in order to improve their display. Uncheck the box to turn MathJax off. This feature requires Javascript. Click on a formula to zoom.
Abstract
Watersheds from semiarid zones are sensitive to land degradation processes wherein the morphometric investigation is an important aspect to unwrap the susceptible areas. Hence it is a prerequisite for the assessment of erosional pattern of the watershed. Thus, based on the response to erosional processes, prioritization task has been undertaken for fourteen sub-watersheds from basaltic region of Western Ghats of India. A morphometry-based framework using weighted sum analysis (WSA) coupled with the remote sensing data, field data and topographical maps were generated on geographical information system (GIS) platform to estimate the soil erosion susceptibility. The study also evaluates the performance of this new methodology by considering the sediment production rate (SPR) of these sub-watersheds. The resultant WSA-SPR model has prioritized the study area into high, moderate low and very low categories. The high and moderate priority areas lie in the proximity of outlet, upper elevated and undulating terrain of the watershed. It represents 41.38% of the total area covering SW1, 3, 13 and 14 sub-watersheds. This study proposes a useful tool to define areas for planning the strategies to control soil erosion and promote soil conservation.
1. Introduction
Soil erosion is broadly defined as the accelerated removal of topmost layer through water, wind or tillage from fragile skin of the earth. Erosion through water mainly occurs when overland flow entrains soil particles detached by raindrop impact, weathering process or surface runoff, often leading to clearly defined channels such as rills or gullies. The heavy loss of topsoil through erosion is recognized as an utmost threat to the world’s soil resources. It is a fearful fact that the soil in many areas is eroding much at faster rate than be replaced by soil formation processes. The large difference between erosion and soil formation rates has compelled to consider this resource as non-renewable. To address this issue the opening statement of the preamble of the revised World Soil Charter states that ‘Soils are fundamental to life on Earth but human pressures on soil resources are reaching critical limits’. Careful soil management is an essential element of sustainable agriculture which provides a valuable lever for climate regulation and a pathway for safeguarding ecosystem services and biodiversity (FAO and ITPS Citation2015).
The soil formation process is very slow especially on rugged terrain and has threats of wind, water and gravity erosions. Wind erosion, mass movement by gravity and dust emissions are affected by hydrological set up of a terrain in several ways. Remote sensing studies of dust sources by Prospero (Citation2002) showed that major dust sources were originated from deep alluvial deposits formed by intermittent flooding during the Quaternary and Holocene epoch and produced wind-erodible sediments (Ginoux et al. Citation2012). As half of the topsoil on the earth has been lost in the last 150 years (FAO and ITPS 2015), there is reduction in soil availability thus affecting the soil carrying capacity (Adgo et al. Citation2013; Jaiswal et al. Citation2014; Singh and Panda Citation2017) as well as the degradation of water quality downstream due to sediment deposition (Welde Citation2016; Singh and Panda Citation2017). In this concern, the present study has a major focus on the soil erosion analysis of the Shivganga watershed.
In India about 53% of the total geographical area suffers from serious soil erosion as well as other forms of land degradation resulting topsoil loss in 132 mha area and terrain deformation in 16.4 mha area (Ministry for Environment and Forests [MoEF] Citation2001). India shares 16% of the world’s population situated on 2% of the global land area placing the soil resources in danger. Thus, planning and management of soil and water resources on a sustained basis without deterioration and with constant increase in productivity are the need of the hour. Proper scientific planning and management of soil resources requires holistic approach and historical data. The geomorphological characteristics of watersheds are commonly used for developing the regional hydrological models for solving various problems of the watersheds under inadequate data situations (Bagyaraj and Gurugnanam Citation2011; Dutta and Roy Citation2012; Altaf et al. Citation2014). Applications of geographical information system (GIS) techniques are much efficient, time-saving and suitable for spatial planning. The GIS also has capability of handling large datasets and can also resolve many complex issues besides facilitating retrieval and querying of data.
Thus, the present study has been attempted by using the framework of morphometry coupled with weighted sum analysis (WSA) and sediment production rate (SPR) for soil erosion prioritization of watershed. The rate of sediment production is affected by the shape of the watershed which controls the time taken for run-off to concentrate at the outlet of a watershed. The present paper highlights soil erosion and sediment production rate with reference to morphometric characteristics of the Shivganga River basin, representative of the high relief region from Western Ghats of India. The foremost purpose of the present study is to integrate the WSA and SPR methods using GIS to establish the modified morphometric watershed prioritization method to evaluate the erosion prone area in the sub-watersheds.
2. Study area
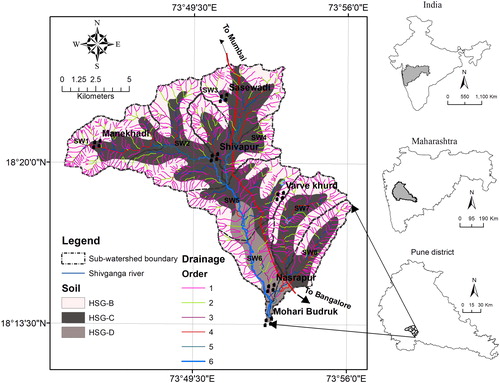
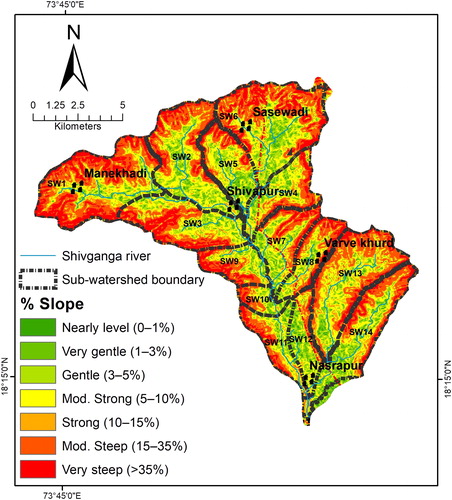
The river Shivganga originates at the foothills of Sinhagad fort, Western Ghats and meets Gunjawani river near village Mohari Budrukh. The river drains through the study area having an extent of 173.93 km2 representing a part of Pune district, Maharashtra, India (). The elevation ranges from 1264 m in western part to 590 m in easternmost part of the watershed. The area receives an average annual rainfall of 964 mm (50-year average) from NW monsoon from June to September (IMD, Citation2017). The entire catchment has rugged terrain comprising of basaltic rocks which exhibits shallow soil and thin veneer of soil at places where vegetation growth is meagre (Kadam et al. Citation2017).
Figure 1. Location map of Shivganga watershed. The basin has 6th order drainage pattern and three soil groups. The entire area is divided into 14 sub-watersheds for morphometric prioritization method. Source: Author
2.1. Material and methods
Survey of India toposheets, of 1:50,000 scales and ASTER GDEM data of 30 m spatial resolution were used to identify the drainage pattern and perform the morphometric analysis of Shivganga watershed. Digital elevation model (DEM) was validated with differential global positioning system surveyed points and toposheet contours for better results. The drainage network was extracted from DEM using River Tools 3.0 software. The automated River Tool follows a series of steps namely, select the DEM, flow grid, watershed outlet, RT tree file, river network etc. Furthermore, Strahler’s drainage ordering scheme was adopted for assigning orders to various streams. Soil classification map (scale 1:500,000) was resized to 1:50,000 scale by superimposing Landsat satellite data, image ratio tool and principal component analysis (Kadam et al. Citation2012). The slope map was derived from DEM. Thematic layers, such as basin and sub-basin boundary, drainage, relief and slope were brought to common spatial reference system (WGS-84/UTM) for overlay analysis in GIS.
The soil map availed from National Bureau of Soil Science and Land Use Planning was referred to prepare the soil map of study area and the soil classes were formed on the basis of USDA soil classification system (). In view of this, the study area comprises of B, C and D hydrological soil groups (HSG). The HSG-B is moderately deep, well-drained with moderately coarse texture, covering 49.63% area. HSG-C is moderately fine texture with a clay pan or clay layer at or near the surface covering 42.37% of total area and HSG-D is shallow, nearly impervious material with (8.01%) total area (Kadam et al. Citation2012).
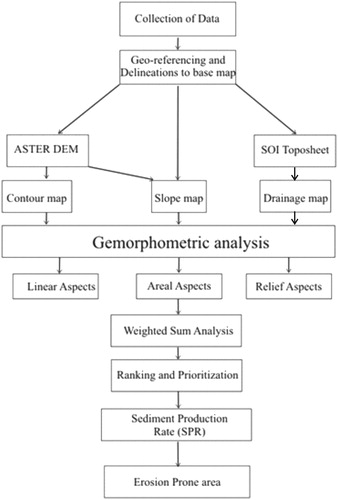
The study carried out has been divided into three sections (). The first section deals with delineation of stream numbers, stream order and stream lengths in the study area along with delineation of watershed area, perimeter and length in GIS environment. The second section deals with the computation of various linear and shape morphometric parameters which characterize the sub-watersheds and lead to understand the hydrological behaviour of sub-watersheds and thereby soil erosion in the respective sub-watersheds. The third section deals with the prioritization of watersheds on the basis of morphometric parameters and sediment production rate.
Figure 2. Methodological framework of the study to prioritize the erosion prone areas using varied data sets.
Relevant linear, areal and relief parameters of drainage morphometry were computed using respective formula and the entire basin was divided into fourteen sub-watersheds SW1 to SW14 for prioritization process.
2.2. Linear aspects
Parameters like stream order, stream length and bifurcation ratio (Rb) elucidate the significance of basaltic lithology and structural control on drainage pattern (Kale and Gupta Citation2001). The parameters considered for prioritization of sub-watersheds are bifurcation ratio (Rb) stream order (Su), stream length (Lu), stream number (Nu) and Length of Overland flow (Lg). The computation of these parameters has been performed by using standard formulas () and the stream number, length and perimeter of sub-watersheds are measured in GIS environment.
Table 1. Parameters for prioritisation of erosion prone areas in Shivganga watershed.
2.3. Areal aspects
Several influencing areal parameters are used in prioritization process like form factor (Rf), which is affected by size, slope and shape of the sub-watersheds. Shape factor (Bs) is the qualitative representation of a watershed or basin that affects the stream discharge pattern. Elongation ratio (Re) between 0.6 and 1.0 runs over a wide variety of climatic and geologic types. The texture ratio (Rt) is based on underlying lithology, infiltration capacity and relief aspect of the terrain and expressed as the ratio between the first order streams and perimeter of the watershed. Circulatory ratio (Rc) is influenced by the lithology of the basin, stream frequency and gradient of various orders. It specifies the basin shape, depending upon the geology, slope and vegetative cover of the area. Stream frequency (Fs) is an index of the various stages of landscape evolution. The formulation of stream segments depends on the nature and structure of rocks, nature and amount of rainfall, soil permeability and land use pattern. Drainage texture depends on rock underneath, infiltration capacity and relief aspect of the terrain. Drainage density is a measure of how frequently the streams occupy the land surface area. Compactness coefficient (Cc) of a watershed is the fraction of perimeter of sub-watershed to circumference of circular area. The Cc is independent of size of watershed and dependent only on the slope.
2.4. Relief aspects
Difference in the elevation between the highest point of a watershed and the lowest point on the valley floor is known as the relief. There is a strong correlation between hydrological characteristics and the Relief of a drainage basin (Schumm Citation1956). The parameters include Relief ratio (Rhl), which is fraction of the basin relief (R) and the basin length (L), the high Rhl, representing more erosive influence due to steep slope. Average slope is a morphometric parameter of hydrological significance (Mesa Citation2006) that shows the speed of soil overland flow and time for run-off accumulation.
2.5. Prioritization of sub-watersheds using WSA method
Prioritization process is the hierarchy of different sub-watersheds and according to the priority order they are taken up for treatment and soil conservation measures. These ranks are derived on the basis of average slope, soil texture, land use, geology and geomorphology by Pandey et al. (Citation2007). The parameters such as drainage density, stream frequency, bifurcation ratio, drainage texture and texture ratio have direct relationship with erodibility (Kiran and Srivastava Citation2012). In this study, the sub-watershed with lowest erosion potential has been assigned first rank and the sub-watershed with highest erosion potential has been assigned rank 14 shown in parentheses ().
Table 2. Morphometry based watershed prioritization and Identification for erosion susceptibility of Shivganga and its sub-watersheds using preliminary ranking.
Higher values of linear parameters enhance the runoff potential and thereby the erodibility, the highest value of Rb was given a rating of 14, the next highest value was given a rating of 13 and so on. Thus, the lowest value was rated last in the series of numbers (Thakkar and Dhiman Citation2007).
Shape parameters, form factor, elongation ratio, circulatory ratio and length of overland flow are inversely proportional to erodibility where, lower values of areal parameters give higher sediment yield per unit area (Thakkar and Dhiman Citation2007). Parameters namely basin relief, relief ratio and terrain slope are directly proportional to land and water degradation where, higher values of these parameters give greater sediment yield per unit area. Thus, the ratings of all the sub-watersheds in Shivganga were carried out by calculating the compound parameter index. The sub-watershed with the highest compound parameter value was given the highest (14) priority.
Relief has direct relationship with sediment production thus tends to possess rank 14 for high relief ratio and rank 1 for lowest relief ratio. In similar way, high average slope representing rank 14 while lowest average slope assigned rank 1.
The WSA method is efficient and highly suitable for watershed prioritization. Therefore, in present study sub-watershed wise demarcation is done by using a newly designed methodology for prioritization where geospatial technologies are coupled with statistical method to allow the appropriate ranking of sub-watersheds by avoiding the individual biasness associated with several influencing parameters. In this method, various geomorphometric parameters were ranked and correlation analyses amongst these parameters were carried out. So, it is hypothesized that there is an opportunity to rectify the erroneous results to increase accuracy in prioritization. This method was helpful to generate and assign the weights to each input parameter according to their importance.
Validity of morphometry driven sediment production rate (SPR) for watershed prioritization is the prime development in present study and it is hardly considered in any previous study except by Jaiswal et al. (Citation2014). The sub-watershed having lowest slope was ranked 1 and with highest average slope was ranked 14, indicating soil erosion potential respectively. The second step identified the correlation between erosion assessment (morphometric) parameter namely bifurcation ratio, form factor, shape factor, elongation ratio, texture ratio, circularity ratio, stream frequency, drainage texture, drainage density, length of overland flow, compactness coefficient, relief ratio and average slope. Sum of all correlations in the column () was taken and recognized as ‘sum of correlation’ (Aher et al. Citation2014). The ‘sum of correlation’ formulated the ‘grand total’ (). Furthermore, final weightages (Fw) of each morphometric parameter were estimated by dividing the ‘sum of the correlation coefficient’ of each parameter by ‘grand total’ of correlations ().
Table 3. Correlation matrix of morphometric properties for the sub-watersheds.
Table 4. Prioritization and the final ranking of sub-watersheds.
Table 5. Prioritization of sub-watersheds based on natural breaks (Jenks method).
Finally, ‘compound parameter constant’ values of all sub-watersheds were calculated on the basis of weightages of each morphometric component using the equation below.
(1)
(1)
Where, Pri is ‘Preliminary ranking’ of ‘ith’ parameter for sub-watershed, Fwi is ‘Final weightages’ of same ‘ith’ parameter.
In modified WSA approach, prioritization has been achieved by ranking and correlation analysis techniques. The results of present study show better accuracy in prioritizing smaller hydrological units than other methods such as multi-criteria evaluation approach (Alvarado et al. Citation2016; Vollmer et al. Citation2016), compound factor analysis (Avinash et al. Citation2011; Patel et al. Citation2012) and compound parameter technique (Hlaing et al. Citation2008; Rawat et al. Citation2014). Morphometry based soil resource depletion studies are lacking according to the previous literature reviewed regarding sediment production rate of the terrains. (Altaf et al. Citation2014; Khadse et al. Citation2015; Dorici et al. Citation2016; Tadesse et al. Citation2017) Therefore, same has been given significant emphasis in this study.
2.6. Sediment production rate (SPR)
For assessing soil erosion and sediment yield, experimental models based on geomorphological parameters have been developed in the past by Josh and Dash (Citation1982) and Reid and Dunne (Citation1984). The sediment production rate has been estimated using morphometry-based model proposed by Josh and Dash (Citation1982). However, the sediment production rate in the present study has been estimated for fixing priority of sub-watersheds in Shivganga catchment (). The SPR model can be described in mathematical term as:
(2)
(2)
Where, SPR is the sediment production rate in ha-m/100 km2/year, Rf is the form factor, Rc is the circulatory ratio and Cc is the compactness coefficient.
3. Results and discussion
This study emphasizes the behaviour of drainage network system which includes the spatial relationship among streams or rivers influenced by inequalities of slope, soil, rock resistance factor, structure and geologic history of the region. The morphometric analysis includes linear, areal and relief parameters, discussed in the following paragraphs.
3.1. Linear parameters
Bifurcation Ratio (Rb) changes from one order to its subsequent order as the drainage development depends upon climate, topographic, ecological and geological factors (Strahler Citation1964, Schumm Citation1956). The bifurcation ratio for the sub-watersheds ranges between 2.70 (SW14) and 5.70 (SW8). The sub-watershed SW8 shows highest Rb of 5.70 and has high erosion potential and thus assigned rank 14 similarly, SW14 has minimum Rb value () and having lowest erosion thereby assigned rank 1. The lithology represented by basalts with less variation in geologic structure is the main reason for values of bifurcation ratio falling between 3 and 5 (Kale and Gupta Citation2001; Sujatha et al. Citation2015). Apart from this, the mature stage of the basin and account of the river flow through mountainous and highly dissected area also contributed to these Rb values.
Length of overland flow (Lg) can be estimated approximately as one-half of drainage density (Strahler Citation1964). Low values of Lg are found in sub-basins 1 and 2 () in contrast, sub-watersheds 6, 11 and 12 have higher Lg values. The sub-watershed 11 with highest Lg (0.64) was given rank 14, indicating highest erosion potential. The sub-watershed 1 having low Lg value (0.47), makes it minimum susceptible to surface soil loss and it was given rank 1. In general, small river basin like Shivganga, overland flow is a dominant hydrological parameter that has a significant effect on the shape of hydrograph. In this study, the length of average overland flow is 0.43 km which shows high surface runoff vis-à-vis high erosion.
3.2. Areal aspects
Long-narrow watersheds have larger lengths and hence smaller values of form factors (Magesh and Chandrasekar Citation2014). All the sub-watersheds have values of form factor ranging from 0.14 (SW14) to 0.51 (SW6) and were thus assigned rank 1 and 14 respectively. The watershed with high form factors has high peak flows of shorter duration thus highest erosion, whereas watershed with low form factor i.e. 0.14 are elongated in shape where the streams flow for longer duration hence least prone to soil erosion.
Shape factor (Bs) can be defined as the ratio of the square of the basin length to area of the basin (Horton Citation1945). All the shape factor values ranged from 1.95 in SW6 to 7.11 in SW14 and were thus assigned rank 1 and 14 respectively. Shape factor impacts the size of peak discharge and its arrival time at the basin outlet. Peak discharge for a circular basin will arrive sooner than that of an elongated basin of the same area because the tributary network in a circular basin is more compactly organized and water flow from tributaries enter the mainstream at roughly the same time, thus more surface runoff is delivered to the outlet together (shorter duration, higher flood peak).
Elongation ratio (Re) is defined as the ratio of diameter of a circle of the same area as the watershed to the maximum watershed length. The elongation ratio of Shivganga watershed is 0.73 (), which indicates that the sub-watershed is less elongated with high relief and steep slope (Magesh and Chandrasekar Citation2014). Values nearing 1.0 are typical of regions with low relief, whereas values in the low range are generally associated with strong relief and steep ground slopes. All the values are ranging from 0.42 in SW14 to 0.81 in SW6 and were thus assigned rank 14 and 1 respectively. The sub-watershed 6 is less elongated with maximum Re value, in contrast to sub-watershed 14 (0.45) which has elongated shape. Shivganga watershed has sub-circular to slightly elongated shape having low peak flows of longer duration except sub-watershed1 which has circular shape that would be expected to have sharp peak flood discharge.
Texture ratio (Rt) is expressed as the ratio between the number of streams and perimeter of the watershed. In SW10 low Rt value (0.97) depicts less vulnerable rocks that produces a fine texture and has low erosion potential (Sreedevi et al. Citation2009) and ranked 1. Whereas, substantial and resistant rock supporting Rt value of 4.72 in SW1 has high erosion and ranked 14. In general, Rt values decrease from source to mouth of river. The Rt value for Shivganga watershed is 10.54, indicates fine texture which is a representative of basaltic terrain ().
Circulatory ratio (Rc) is influenced by drainage density, frequency of streams, geology, structures, land cover, climate, relief and slope of the basin. The young, mature and old stages of the life cycle of the river are related to the low, medium and high values of the circulatory ratio respectively. The circularity ratio of Shivganga watershed is 0.42 () which reveals that the basin is less elongated and characterized by moderate to high relief and drainage system is structurally controlled. Sub-watershed WS14 (0.19) showed the lowest Rc and was ranked 14 which in turn reflects rapid discharge from the sub-watershed and resulting more erosion vulnerability. Similarly, the sub-watershed 9 (0.53) showed the highest Rc and was assigned rank 1 as it reflects low discharge from the watershed and resulting lower vulnerability (Altaf et al. Citation2014).
Stream frequency (Fs) is defined as the ratio of number of stream segments per unit area of watershed. The dense or sparse occurrence of stream segments depends on the nature and structure of rocks, land use cover, nature and amount of rainfall and soil permeability. The Fs in the Shivganga ranges from 3.34 (sub-watershed 11) to 7.34 (sub-watershed 1). Maximum Fs seen in SW1 shows that it has the low penetration capability and thus has high wearing down vulnerability, thus assigned rank 14. The lowermost Fs was observed in sub-watershed 11 (3.34/km2) showing least soil loss potential and assigned rank 1. High value indicates the high relief and low infiltration capacity of the bed rocks. The stream frequency for the Shivganga watershed is 6.008 () thereby meaning that entire watershed has high possibility of soil loss.
Drainage texture (Dt) is the ratio of total number of drainage segments of all orders to perimeter of that area (Horton Citation1945). The drainage texture value of the Shivganga watershed is 14.56 (). The SW1 (6.35) was given rank 14 leading to more erosion. Consequently, the sub-watershed 10 with lowest Rt 1.29 was given rank 1, showed that it has low vulnerability to soil-loss. Higher value of drainage texture for sub-watershed 1 depicts thin soil cover, steep to moderate land slope, poor vegetation cover and presence of hard rock, in contrast with sub-watershed 10 and 11 where Shivganga watershed has low value of drainage texture. The above values also suggest low to moderate permeability of basalt generating higher surface runoff (Kadam et al. Citation2017, Citation2018). Horton in 1945 recognized infiltration capacity as the single important factor which influences drainage texture. It also depends on the subsurface weathered rock and soil type, rainfall, vegetation cover, slope and relief of the terrain.
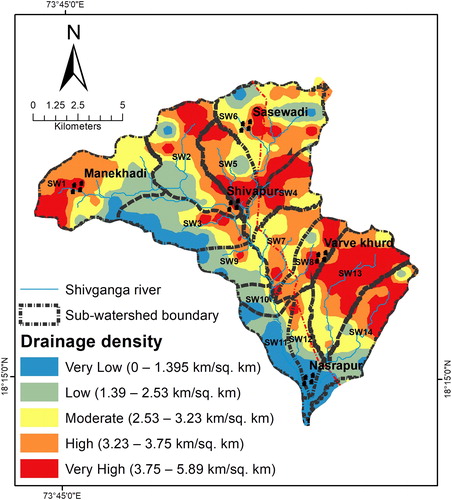
Drainage density (Dd) is a measure of the length of streams per unit of land surface. Drainage density is a function of climate, lithology, and slope. Therefore, it maintains a balance between the driving forces of erosion and the ground resistance (Horton Citation1945; Strahler Citation1952). The drainage density of Shivganga watershed is 4.6 km/km2. It ranges between value 3.12 and 4.24 for sub-watersheds 11 and 1 respectively (). Thus, sub-watershed 1 with highest Dd (4.24) indicated that it has the lowest permeability, maximum erosion potential and thus given rank 14. Higher Dd values reflect high runoff with high flood peak, thin soil cover, low permeability of soil, steep to moderate land slope (). Whereas the low drainage density values are attributed to relatively permeable soil cover, land having gentle slopes and less runoff in sub-watershed 11 (ranked 1). Furthermore, the low drainage density can be explained by semiarid conditions prevailing in the study area. The high values of drainage density, stream frequency and drainage texture indicate that the study area is underlain by impermeable rocks responsible for high runoff (Umrikar Citation2017; Kadam et al. Citation2017).
Figure 3. Drainage density map of Shivganga watershed with most of the areas covered by high- and very high-drainage density categories. Source: Author
Compactness constant is essentially the relationship of the shape of the drainage basin with a circle having the same area and is dependent on the slope. Cc = 1 indicates that the basin completely behaves as a circular basin. Cc > 1 indicates more deviation from the circular nature of the basin. It is directly related to the penetration capability of the watershed (Altaf et al. Citation2014). The lowest Cc (1.38) was observed in sub-watershed 9 which indicated it has lowest infiltration capacity and was thus assigned rank 14. The highest Cc was observed in sub-watershed 14 (2.28) indicating its highest infiltration capacity and was thus assigned rank 1.
3.3. Relief aspects
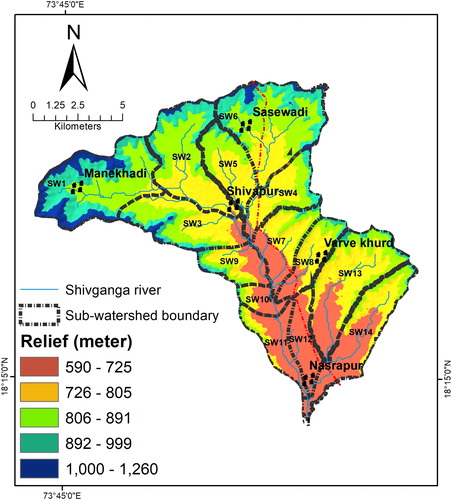
Relief ratio (Rhl) is the ratio between the total reliefs of a basin to the longest dimension of the basin parallel to the main drainage line (Schumm Citation1956). Watershed relief is key factor in understanding the erosional characteristics of the watershed and plays a significant role in development of landforms, drainage development, surface runoff and recharge, permeability and erosional properties of the terrain (Magesh et al. Citation2011). The maximum elevation in Shivganga watershed is 1264 m representing Western Ghat origin (). In the study area, the value of relief ratio is 32.93 (). If Rhl value is high, it indicates a hilly region and a low value of relief ratio represents pediplain and valley region (Avinash et al. Citation2011). Low value of relief ratios is mainly due to the resistant basement rocks of the basin and low degree of slope. High relief ratio values indicate high rate of stream flow velocity and the terrain is vulnerable to erosion which is the function of high sediment yield in sub-watershed 10 ranked as 14 in comparison with sub-watershed 12 having less Rhl value and ranked 1 ().
Figure 4. Relief map of study area. Source: Author
Slope is considered as an important criterion for selecting erosion prone area (Hlaing et al. Citation2008; Bandyopadhyay et al. Citation2009; Sujatha et al. Citation2015). Steep basin slopes are observed at the periphery of sub-watersheds. Nature of slopes within a watershed influences the topographical conditions and drainage network. Slope also plays a key role in runoff and stream discharge. The peripheral areas of sub-watersheds in present study show steep slopes where first and second order streams are concentrated (). High average slopes in sub-watershed 1 is ranked 14 with increased stream flow velocity, minimized length of overland flow and quick water flow into streams contributing to hydrograph rise (Samal et al. Citation2015). It has been observed that sub-watershed 12 has low average slopes and therefore ranked 1 () shows less runoff, relatively less land erosion and low peaks in hydrograph.
Figure 5. Map of study area with most of the area covered by strong, moderately steep and very steep slopes. Source: Author.
3.4. Morphometric prioritization using WSA approach
To facilitate the phase-wise implementation, all the sub-watersheds are prioritized on the basis of sediment production rate and morphometric analysis. Values are rated between 1 and 14, here 1 defines minimum influence while 14, the maximum. Eventually, all parameters were ranked likewise by adopting similar judgment.
The parameters such as bifurcation ratio, form factor, shape factor, elongation ratio, texture ratio, circulatory ratio, stream frequency, drainage texture, drainage density, length of overland flow compactness constant, relief ratio and average slope were used for the prioritization of sub-watersheds for preferential soil erosion treatments. The Rb, Lg, Bs, Rt, Fs, Dt, Dd, Rhl and average slope values have a direct relationship with erosion potential i.e. higher the value, more will be the erosion and vice versa (Gajbhiye et al. Citation2014; Khadse et al. Citation2015). The highest value of these parameters were ranked 14, second highest value ranked 13 and so on. Similarly, Rf, Re, Rc and Cc have an inverse relationship with erosion potential i.e. higher the value, less will be the erosion and vice versa. The highest value of these parameters were ranked 1, second highest value ranked 2 and so on as shown in .
After the ranking of the erosion potential parameters, the correlation matrix was constructed by using WSA method (). Correlation matrix showed that bifurcation ratio, average slope, drainage density has negative correlation with most of the morphometric parameters (except texture ratio and drainage texture which have positive correlation). Form factor (Rf) having strong positive correlation with shape factor, and circulatory ratio and strong negative correlation with relief ratio (). Correlation analysis also revealed that drainage texture bears highest correlation coefficient values with stream frequency (0.719). In modified WSA method, the sum of correlation is the summation of column for Rb, Lg, Rf, Bs, Re, Rt, Rc, Fs, Dt, Dd, Rhl as:
Sum of correlation for Average slope = [(−0.231) + (−0.121) + (−0.481) + (−0.481) + (−0.481) + 0.503 + (−0.371) + 0.222 + 0.569 + 0.121 + 0.142 + 0.430 + 1.00] = 1.783
Further, the grand total obtained from the sum of correlations (10.14) is used for calculating final weight of each geomorphic parameter. This is used in final prioritization ranking. The final weights were calculated using the equation given below. By giving those weights to parameters, a model is formulated to assess the priority
(3)
(3)
For example, final weight of average slope is sum of correlation coefficient i.e. 1.783 divided by the grand total 10.14 (). The resultant value is 0.18, used for the calculation of compound parameter constant, further used in prioritization and final ranking of sub-watershed.
Similarly, the compound parameter constant for SW 1 is calculated as follows
Compound parameter constant for SW1 = (0.02*5) − (0.18*1) − (0.05*3) + (0.05*12) − (0.05 *3) + (0.27*14) − (0.04*7) + (0.23*14) + (0.25*14) + (0.18*14) − (0.11*8) + (0.05*12) + (0.18*4) = 16.72
Further, all the sub-watersheds were prioritized based on the morphometric analysis. The implication of structures, degree and depth of weathering and position of lithological horizons are profound and represented in the present prioritization. Geomorphological signatures of the study area display very significant match with the morphometric parameter-based prioritization. The Shivganga watershed finds an appreciable correlation with the basaltic flows. These are erodible due to the horizons of spheroidal weathering, differential frequency of vesicles and deeply penetrating joint areas that cause deep weathering zones due to the circulation of water.
The compound parameter values using WSA method of the 14 sub-watersheds were calculated and prioritization rating allocation has been incorporated in . Sub-watershed 1 with a compound parameter value of 16.72 received the first priority (14) with the next in priority being sub-watershed 13, having a compound parameter value of 11.97. The highest priority indicates the more degree of erosion in the sub-watershed and it becomes a potential area for applying soil conservation measures. The final prioritized map is shown in .
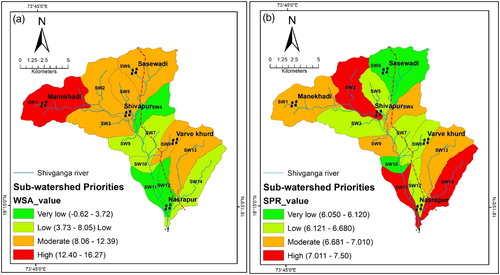
Figure 6. Watershed prioritization map of Shivganga watershed based on (a) WSA, (b) SPR method. Source: Author.
3.5. Morphometry analysis-based prioritization using SPR approach
To facilitate the phase-wise execution, all the sub-watersheds are prioritized on the basis of sediment production rate using morphometric analysis. Values are rated between 1 and 14, here 1 rank defines lowest priority while 14 defines highest priority of soil and water conservation (). Eventually, all sub-watersheds were ranked likewise by adopting similar judgment.
The calculation of SPR value for sub-watershed 1 is given below
Log (SPR) = 4919.8 + 48.64 log (100 + 0.42) − 1337.77 log (100 + 0.40) − 1165.65 log (100 + 0.2356) = 6.792
Thus, soil and water conservation measures can first be applied to sub-watershed 1 and 14 as per both WSA and SPR rating system and then to others depending on their priority ranks.
These WSA and SPR values were further grouped into four classes based on the natural breaks in data (Jenks and Caspall Citation1971), which portrays four erosion prone zones namely high, moderate low and very low priority (). The sub-watershed depicting various priority classes is shown in along with percentage area.
In WSA method, the high priority ranking in the sub-watershed 1 and 13 signifies the high runoff and high erosion (). The SPR model showed that SW2, SW11 and SW14 have high priority, while moderate priority is shown by SW1, SW4, SW13. Integrating morphometric parameters using SPR technique 22.99, 29.88, 32.18 and 14.95% of the total area is considered as high, moderate, low and very low erosion vulnerability respectively ().
4. Conclusion
This study focuses on prioritization of 14 sub-watersheds for measurement of erosion, covering hard rock terrain based on weighted sum analysis of influencing linear, areal and relief morphometric parameters as well as sediment production rate using GIS technique. The conventional methods of morphometric analysis are time-consuming and error prone whereas as application of GIS technique produces more reliable and accurate estimations of length, area and altitude-based parameters of watersheds. As the morphometric analysis helps revealing the salient features of the sub-watersheds with respect to hydrological and land degradation processes, therefore the areas experiencing heavy soil loss due to erosion were identified for adopting watershed treatment and soil conservation measures. The results of morphometric analysis show that sub-watersheds 1, 13 and 14 whereas SPR analysis highlights SW2, 11 and 14 prone to relatively higher erosion and soil loss. Geological and geomorphological field verification also agree the present morphological-analysis based prioritization. Hence, suitable soil erosion control measures are required to be taken up in these sub-watersheds to prevent further deterioration of soil.
Supplemental Material
Download Zip (85.8 KB)Acknowledgements
The authors are thankful to Head, Department of Environmental Sciences, and Head, Department of Geology, S.P. Pune University, for extending their help to use the department laboratory for computational purpose. Authors are thankful to Dr. Khalid Hussain for necessary corrections of earlier versions of the manuscript.
Disclosure statement
No potential conflict of interest was reported by the authors.
Related Research Data
References
- Adgo E, Teshome A, Mati B. 2013. Impacts of long-term soil and water conservation on agricultural productivity: the case of Anjenie watershed, Ethiopia. Agric Water Manage. 117:55–61. doi: 10.1016/j.agwat.2012.10.026.
- Aher PD, Adinarayana J, Gorantiwar SD. 2014. Quantification of morphometric characterization and prioritization for management planning in semi-arid tropics of India: a remote sensing and GIS approach. J Hydrol. 511:850–860. doi: 10.1016/j.jhydrol.2014.02.028.
- Altaf S, Meraj G, Romshoo SA. 2014. Morphometry and land cover based multi-criteria analysis for assessing the soil erosion susceptibility of the western Himalayan watershed. Environ Monit Assess. 186(12):8391–8412. doi: 10.1007/s10661-014-4012-2.
- Alvarado A, Esteller MV, Quentin E, Expósito JL. 2016. Multi-criteria decision analysis and GIS approach for prioritization of drinking water utilities protection based on their vulnerability to contamination. Water Resour Manage. 30:1549–1566. doi: 10.1007/s11269-016-1239-4.
- Avinash K, Jayappa KS, Deepika B. 2011. Prioritization of sub-basins based on geomorphology and morphometricanalysis using remote sensing and geographic informationsystem (GIS) techniques. Geocarto Int. 26(7):569–592. doi: 10.1080/10106049.2011.606925.
- Bagyaraj M, Gurugnanam B. 2011. Morphometry studies, soil characteristics, erosion phenomena and landform processes using remote sensing and GIS for Kodaikanal Hills, A global biodiversity hotpot in Western Ghats, Dindigul District, Tamil Nadu, South India. Res J of Environ and Earth Sci. 3:221–233.
- Bandyopadhyay S, Jaiswal RK, Hegde VS, Jayaraman V. 2009. Assessment of land suitability potentials for agriculture using a remote sensing and GIS based approach. Int J Remote Sens. 30(4):879–895. doi: 10.1080/01431160802395235
- Dorici M, Costa CW, de Moraes MCP, Piga FG, Lorandi R, de Lollo JA, Moschini LE. 2016. Accelerated erosion in a watershed in the southeastern region of Brazil. Environ Earth Sci. 75:1301. doi: 10.1007/s12665-016-6102-7.
- Dutta S, Roy S. 2012. Determination of erosion surfaces and stages of evolution of Sangra drainage basin in Giridih district, Jharkhand, India. Int J Geomatics Geosci. 3:63–73.
- FAO and ITPS. 2015. Status of the world’s soil resources (SWSR) – main report. Food and Agriculture Organization of the United Nations and Intergovernmental Technical Panel on Soils, Rome, Italy, Viewed 20 March 2018. https://www.bergen.kommune.no/bk/multimedia/archive/00316/FAO_status_jordress_316788a.pdf.
- Gajbhiye S, Mishra SK, Pandey A. 2014. Prioritizing erosion-prone area through morphometric analysis: an RS and GIS perspective. Appl Water Sci. 4(1):51–61. doi: 10.1007/s13201-013-0129-7
- Ginoux P, Prospero JM, Gill TE, Hsu C, Zhao M. 2012. Global-scale attribution of anthropogenic and natural dust sources and their emission rates based on MODIS Deep Blue aerosol products. Rev Geophys 50:1–36. doi: 10.1029/2012RG000388
- Gravelius H. 1914. Grundriss der gesamten Gewasserkunder. Flusskunde, 1, Berlin and Leipzig, viii-179.
- Hlaing KT, Haruyama S, Aye MM. 2008. Using GIS-based distributed soil loss modeling and morphometric analysis to prioritize watershed for soil conservation in Bago river basin of Lower Myanmar. Front Earth Sci China. 2(4):465–478. doi: 10.1007/s11707-008-0048-3.
- Horton RE. 1932. Drainage-basin characteristics. Eos, transactions american geophysical union. 13(1):350–361. doi: 10.1029/TR013i001p00350
- Horton RE. 1945. Erosional development of streams and their drainage basins: hydrophysical approach to quantitative morphology. Geol Soc Am Bull. 56(3):275–370.
- IMD. 2017. Pune weather station report. Customized Rainfall Information System (CRIS), Hydromet Division Indian Meteorological Department-New Delhi, Viewed 21 December 2017. http://hydro.imd.gov.in/hydrometweb/(S(qboynovou5m4yljcag0zpo45))/DistrictRaifall.aspx
- Jaiswal RK, Thomas T, Galkate RV, Ghosh NC, Singh S. 2014. Watershed prioritization using Saaty’s AHP based decision support for soil conservation measures. Water Resour Manage. 28:475–494. doi: 10.1007/s11269-013-0494-x.
- Jenks GF, Caspall FC. 1971. Error on choroplethic maps: definition, measurement, reduction. Ann Assoc Am Geogr. 61(2):217–244. doi: 10.1111/j.1467-8306.1971.tb00779.x.
- Josh CS, Dash DC. 1982. Geomorphic prediction models for sediment production rate and intensive priorities of watersheds in Mayurakshi catchment. Proceedings of International symposium on hydrological aspects of mountainous watersheds, School of Hydrology, University of Roorkee, Roorkee, 1, p. 15–23.
- Kadam AK, Jaweed TH, Umrikar BN, Hussain K, Sankhua RN. 2017. Morphometric prioritization of semi-arid watershed for plant growth potential using GIS technique. Model Earth Syst Environ. 3(4):1663–1673. doi: 10.1007/s40808-017-0386-9
- Kadam AK, Kale SS, Pande NN, Pawar NJ, Sankhua RN. 2012. Identifying potential rainwater harvesting sites of a semi-arid, basaltic region of Western India, using SCS- CN method. Water Resour Manage. 26(9):2537–2554. doi: 10.1007/s11269-012-0031-3
- Kadam AK, Karnewar AS, Umrikar B, Sankhua RN. 2018. Hydrological response-based watershed prioritization in semiarid, basaltic region of western India using frequency ratio, fuzzy logic and AHP method. Int J Environ Dev Sustain. 15(5):1387–1585. doi: 10.1007/s10668-018-0104-4.
- Kale VS, Gupta A. 2001. Introduction to geomorphology. Calcutta: Orient Long- man Ltd.
- Khadse GK, Vijay R, Labhasetwar PK. 2015. Prioritization of catchments based on soil erosion using remote sensing and GIS. Environ Monit Assess. 187(6):333. doi: 10.1007/s10661-015-4545-z
- Kiran VSS, Srivastava YK. 2012. Check dam construction by prioritization of micro watershed, using morphometric analysis as a perspective of remote sensing and GIS for Simlapal Block, Bankura, W.B. Bonfring Int Ind Eng Manag Sci. 2(1):20–31.
- Magesh NS, Chandrasekar N. 2014. GIS model-based morphometric evaluation of Tamiraparani subbasin, Tirunelveli district, Tamil Nadu, India. Arab J Geosci. 7(1):131–141. doi: 10.1007/s12517-012-0742-z
- Magesh NS, Chandrasekar N, Soundranayagam JP. 2011. Morphometric evaluation of Papanasam and Manimuthar watersheds, parts of Western Ghats, Tirunelveli district, Tamil Nadu, India: a GIS approach. Environ Earth Sci. 64(2):373–381. doi: 10.1007/s12665-010-0860-4
- Mesa LM. 2006. Morphometric analysis of a subtropical Andean basin (Tucumán, Argentina). Environ Geol. 50(8):1235–1242. doi: 10.1007/s00254-006-0297-y
- Ministry for Environment and Forests (MoEF) 2001. State of environment report: land degradation. Environmental Information System (ENVIS), Ministry of Environment and Forests, Government of India, New Delhi, Viewed 19 September 2018. http://www.envfor.nic.in/soer/2001/ind_land.pdf
- Pandey VK, Pandey A, Panda SN. 2007. Application of Remote Sensing and GIS for watershed characterization—a case study of Banikdin watershed (Eastern India). Asian J Geoinformatics. 3(7):3–15.
- Patel DP, Dholakia MB, Naresh N, Srivastava PK. 2012. Water harvesting structure positioning by using geo-visualization concept and prioritization of Mini-Watersheds through morphometric analysis in the lower Tapi Basin. J Indian Soc Remote Sens. 40(2):299–312. doi: 10.1007/s12524-011-0147-6
- Prospero JM. 2002. Environmental characterization of global sources of atmospheric soil dust identified with the NIMBUS 7 total ozone mapping spectrometer (TOMS) absorbing aerosol product. Rev Geophys. 40(1):1–2. doi: 10.1029/2000RG000095.
- Rawat KS, Tripathi VK, Mishra AK. 2014. Sediment yield index mapping and prioritization of Madia subwatershed, Sagar District of Madhya Pradesh (India). Arab J Geosci. 7(8):3131–3145. doi: 10.1007/s12517-013-1007-1
- Reid LM, Dunne T. 1984. Sediment production from forest road surfaces. Water Resour Res. 20(11):1753–1761. doi:10.1029/WR020i011p01753
- Samal DR, Gedam SS, Nagarajan R. 2015. GIS based drainage morphometry and its influence on hydrology in parts of Western Ghats region, Maharashtra. India. Geocarto Int. 37:41. doi: 10.1080/10106049.2014.978903.
- Schumm SA. 1956. Evolution of drainage systems and slopes in bad lands at Perth Amboy, New Jersey. Geol Soc Am Bull. 67(5):597–646.
- Singh G, Panda RK. 2017. Grid-cell based assessment of soil erosion potential for identification of critical erosion prone areas using USLE, GIS and remote sensing: a case study in the Kapgari watershed, India. Int Soil Water Conserv Res. 5(3):202–211. doi: 10.1016/j.iswcr.2017.05.006
- Sreedevi PD, Owais S, Khan HH, Ahmed S. 2009. Morphometric analysis of a watershed of south India using SRTM data and GIS morphometric analysis of a watershed of South India using SRTM data and GIS. J Geol Soc India. 73(4):543–552. doi: 10.1007/s12594-009-0038-4
- Strahler AN. 1952. Hypsometric (area-altitude) analysis of erosional topography. Geol Soc Am Bull. 63(11):1117–1142
- Strahler AN. 1964. Handbook of applied hydrology. In: Chow VT, editor. Quantitative geomorphology of drainage basins and channel networks. New York: Mc-Graw Hill Book Company; p. 39–76.
- Sujatha ER, Selvakumar R, Rajasimman UAB, Victor RG. 2015. Morphometric analysis of sub-watershed in parts of Western Ghats, South India using ASTER DEM. Geomatics, Nat Hazards Risk. 6(4):326–341. doi: 10.1080/19475705.2013.845114
- Tadesse L, Suryabhagavan KV, Sridhar G, Legesse G. 2017. Land use and land cover changes and soil erosion in Yezat Watershed, North Western Ethiopia. Int Soil Water Conserv Res. 5(2):85–94. doi: 10.1016/j.iswcr.2017.05.004
- Thakkar A, Dhiman S. 2007. Morphometric analysis and prioritization of mini-watersheds in Mohr watershed, Gujarat using remote sensing and GIS techniques. J Indian Soc Remote Sens. 35(4):313–321.
- Umrikar BN. 2017. Morphometric analysis of Andhale watershed, Taluka Mulshi, DistrictPune, India. Appl Water Sci. 7(5):2231–2243. doi: 10.1007/s13201-016-0390-7
- Vollmer D, Pribadi DO, Remondi F, Rustiadi E, Grêt-Regamey A. 2016. Prioritizing ecosystem services in rapidly urbanizing river basins: a spatial multi-criteria analytic approach. Sustain Cities Soc. 20:237–252. doi: 10.1016/j.scs.2015.10.004
- Welde K. 2016. Identification and prioritization of subwatersheds for land and water management in Tekeze dam watershed, Northern Ethiopia. Int Soil Water Conserv Res. 4(1):30–38. doi: 10.1016/j.iswcr.2016.02.006