
 ?Mathematical formulae have been encoded as MathML and are displayed in this HTML version using MathJax in order to improve their display. Uncheck the box to turn MathJax off. This feature requires Javascript. Click on a formula to zoom.
Abstract
Droughts are among the most damaging environmental disasters that may have destructive damages on societal properties and lives. Generally, socio-economic drought occurs when water resources systems could not fulfil the water demand. Additionally, it is not to be overlooked the role of local reservoirs in modifying uneven distribution of water and coping with climatic extremes. This study examined the evolution characteristics of the socio-economic droughts via applying a Multivariate Standardized Reliability and Resilience Index (MSRRI). Furthermore, the influences of anomalous atmospheric circulation on the socio-economic droughts were explored through adopting the cross wavelet analysis to investigate the meteorological driving force behind the socio-economic droughts. Results mainly indicated that (1) the MSRRI has proven to be effective in evaluating socio-economic droughts for its integration of inflow-demand reliability and water storage resilience indexes; (2) the MSRRI series in Datong River Basin (DRB) has a non-significant increasing trend at annual scale with apparent periods (17 and 22 years) and (3) the comprehensive effects of ENSO, EASM and PNA contribute to the socio-economic drought variations, and the ENSO has strongest impacts than others. The findings in this study benefit local socioeconomic drought mitigation and water resources planning and management.
1. Introduction
Drought is widely regarded as a complex natural hazard that occurs in large areas over long-time periods and has highly destructive effects in terms of water supply, crop yield, and ecological environment (Wilhite Citation2000; Huang et al. Citation2014a; Gan et al. Citation2016; Fang et al. Citation2019a). Droughts can be typically divided into four types: meteorological, hydrological, agricultural and socio-economic droughts depending on various hydrological cycle deficits (Wilhite and Glantz Citation1985), and the former three types are with respect to the shortages of precipitation, soil moisture and runoff, respectively.
Previous studies have focused more on meteorological, hydrological, and agricultural droughts (Guttman Citation1998; Heim Citation2002; Shukla and Wood Citation2008; MoránTejeda et al. Citation2013; Lin et al. Citation2017). The Palmer Drought Severity Index (PDSI) (Palmer Citation1965), Standardized Precipitation Evapotranspiration Index (SPEI) (Vicente-Serrano et al. Citation2010) and Standardized Precipitation Index (SPI) (McKee et al. Citation1993) are the most widely utilized indices to monitor meteorological drought across the world. In addition, the Standardized Streamflow Index (SSI) (Shukla and Wood Citation2008; Vicente-Serrano et al. Citation2012) using streamflow data to calculate the Hydrological Drought Index has been widely applied in hydrological research (Lorenzolacruz et al. Citation2013; Barker et al. Citation2016). The Crop Moisture Index (CMI) (Palmer Citation1968) and Surface Water Supply Index (SWSI) (Shafer Citation1982) are extensively applied in agricultural drought monitoring and forecasting.
To the best of our knowledge, it is only until recently that there have been a few studies focusing on socio-economic drought (Arab et al. Citation2010; Mehran et al. Citation2015). Socio-economic drought refers to conditions in which water supply fails satisfying water demand, resulting in adverse effects on society, economy and environment (Dinar and Mendelsohn Citation2011; Zseleczky and Yosef Citation2014). As population and industry grow and water demand increases, socio-economic drought becomes a major concern in many regions of the world (Arab et al. Citation2010; Chen and Fu Citation2011; Wada et al. Citation2011; Madani Citation2014; Sivapalan Citation2015; Wheater and Gober Citation2015; Vogel et al. Citation2015; Montanari Citation2015). In especial, semiarid and arid regions are particularly vulnerable to climatic variability and change impacts on water availability and distribution (Cayan et al. Citation2008; Seager and Vecchi Citation2010; Connell-Buck et al. Citation2011).
Reservoirs play a key role in modifying uneven distribution of water in both space and time, which are regarded as the most important and effective man-made water storage facilities to manage the water resources (Bai et al. Citation2015; Fang et al. Citation2017). Besides producing hydroelectric energy and providing water for irrigation, reservoirs/hydropower stations smooth out extreme inflows and provide resilience against extremes (e.g. floods and droughts) (Chang and Chang Citation2006). From the human economic society, the main function of the reservoir is to manage water supply and demand and to reduce the impacts of socio-economic droughts. At present, reservoirs have controlled approximately 20% of the total global annual river discharge and provided about 70% of global freshwater withdrawal (Shiklomanov et al. Citation2000; Huang et al. Citation2014b; Fang et al. Citation2019b; Meng et al. Citation2019). There are indications that reservoirs are crucial in providing resilience for human water use globally (Zhang et al. Citation2014). China has the world’s largest number of reservoirs in the world, with more than 98,000 reservoirs. The reservoir construction in mainland of China has made the river systems strongly regulated: only 6% of the assessed river basins are free-flowing; 20% of assessed river basins have enough cumulative reservoir capacity to store more than the entire annual river flow (Yang and Lu Citation2014). With quite importance of reservoir in China, it is necessary to take the resilience of reservoir as the main factor on monitoring socio-economic drought.
In recent years, being aware of the importance of reservoirs in resisting socio-economic droughts attracts some attention. Mehran et al. proposed the Multivariate Standardized Reliability and Resilience Index (MSRRI) for assessing water stress due to both climatic conditions and local reservoir levels and has good sensitivity and reliability. In this present study, the application of MSRRI in a region of interest of China is conducted to verify its accuracy and reliability.
Studying socio-economic drought is likely to grow more important as climate changes and population grows. It has been proved that there are statistically significant correlations between hydrological drought and large-scale climate anomalies where some factors such as precipitation showed a statistically significant difference between positive and negative phases of some large-scale climate anomalies (Tan et al. Citation2016). Furthermore, however, it can be inferred that changes in seasonality of precipitation or snowmelt combined with population and agricultural, and industrial growths can lead to more stress on water supply (Mehran et al. Citation2015). This is also suggestive of the importance of studying the relationship between socio-economic drought and climate indices. Many studies demonstrated that meteorological, agricultural and hydrological droughts are closely linked to climate indices such as EI Niño–Southern Oscillation (ENSO), the East Asian Summer Monsoon (EASM) Index, Atlantic Oscillation (AO) and the Pacific North American (PNA) Index and so on (Cronin et al. Citation2002; Wu et al. Citation2009; Li et al. Citation2013). To explore the impact of large-scale climate changes on social-economic drought, the correlations of socio-economic drought with the anomalous atmospheric circulation are also to be carried out in this study.
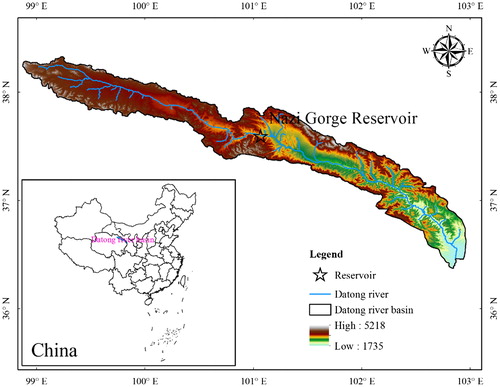
Datong River is located in the northeastern edge of the Qinghai-Xizang Plateau of China, which is one of the secondary tributaries of the Yellow River. With abundant water resources, the DRB has the cascaded power station group composed of large-scale controlling reservoir—Nazi Gorge Reservoir and 16 small hydropower stations. Reservoirs play a very important role in the regulation of water resources in DRB. Taking DRB as the study case, the primary objectives of this present study are to (1) verify the accuracy and reliability of the MSRRI in characterizing socio-economic droughts in DRB; (2) fully reveal the evolution characteristics including the trend, stationarity and periodic component of the socio-economic droughts in DRB and (3) explore the influences of anomalous atmospheric circulation such as ENSO, EASM and PNA on socio-economic drought with a purpose of revealing the meteorological driving force behind the socio-economic droughts.
2. Study area and data
The Datong River is located in the northeast edge of the Qinghai-Tibet Plateau, and situated between 98.5°E∼103.3°E and 36.5°N∼38.4°N, with an area about 15,130 km2. The Datong River Basin (DRB), as the second-order tributary of the Yellow River and the biggest tributary of the Huangshui River (). The length of the Datong River main stream is 560.7 km. Nazi Gorge Reservoir is the first key project in the upper reaches of Datong River. Nazi Gorge reservoir is a within-year reservoir, covering an area of 6593 km2, which has 7.33 hundred million m3 total storage and 121.5 m dam height. As the reservoir was built and came into operation in November 2014, the available water resources in DRB were regulated effectively, and the runoff internal distribution was transformed which not only increased the power generation but also improved the ability of drought resistance. Due to the reservoir is not built for long, there is no long series measured outflow process and the simulated values were adopted in this present study.
Figure 1. The location of Nazi Gorge Reservoir in DRB. Source: Author
The monthly Nino 3.4 index time series spanning 1957–2012 collected from the NOAA Earth System Research Laboratory (www.esrl.noaa.gov/psd/data/correlation/nina34.data) was employed to characterize ENSO events in this study. In addition, the monthly PNA and EASM series were accessed from the NOAA National Climatic Data Center (www.ncdc.noaa.gov/teleconnections/ao.php).
3. Methodology
3.1. A Multivariate Standardized Reliability and Resilience Index
According to the regulation period of the reservoir, reservoir systems are generally classified into two types, over-year and within-year. This classification signifies the importance of variations, especially for the time period which may affect the reservoir system. A time frame is defined for each reservoir system, either 6 months (for within-year system) or 12 months (for over-year system) depending on the category of the reservoir system. After definition of time frame, the developed multivariate approach for characterizing socio-economic drought relies on two individual indices (Mehran et al. Citation2015). The two new indicators are defined as follows: water storage resilience (WSR) indicator and inflow-demand reliability (IDR) indicator. IDR indicator is derived by computing the sum of the percent change of inflow with respect to water demand during the projected time frame:
(1)
(1)
where indicates the monthly inflow to the reservoir (i∈month[1, N], which is the sample size); m indicates the selected time frame in months (6 for within-year and 12 for over-year),
denotes the total estimated water demand within projected time frame, and t is time step and t∈month[13, N]. Here, the first 6 or 12 months (referring to the reservoir system type) of the data are taken to evaluate the demand within the projected time frame. The total water demand for the projected time frame (next m months) is evaluated based on the same period in the previous year (Mehran et al. Citation2015). Therefore, the index can only be estimated beginning from the second year of the data (t = 13, 14, …, N).
The IDR indicator is in respect to the “top-down” methodology (Dessai and Hulme Citation2004), in which the available inflow to reservoir is assessed relative to water demand. That is, the IDR represents whether the available water (inflow to the system) could meet the water demand regardless of the storage in the reservoir.
The WSR indicator corresponds to the “bottom-up” methodology (Mastrandrea et al. Citation2010). WSR is defined on the basis of monthly inflow, monthly water demand, monthly storage and total water demand during the time frame. Computed monthly, WSR represents whether the reservoir storage could satisfy water demand for the selected time period (m):
(2)
(2)
where denotes the reservoir storage at month t, t∈month[13, N], Qmin denotes the minimum operational storage of reservoir;
represents the monthly inflow to the reservoir at month t;
is the monthly water demand at month t. The others are as mentioned above. In addition, if reservoir storage is not available, then it is needed a reservoir model to estimate the storage based on the inflow and outflow (demand).
At first, the marginal probabilities of both indicators (WSR and IDR) are evaluated as follows
(3)
(3)
where P(xt) represents the corresponding empirical probability at month t; N indicates the sample size; I is the rank of nonzero indicator (α or β) data from the smallest to largest.
Then the empirical probability is transformed into a Standardized Index (SI) as
(4)
(4)
where ϕ is the standard normal distribution function. The P(xt) can also be standardized by a commonly used approximation (as EquationEquation (5)(5)
(5) ), in which the value of C0, C1, C2, d1, d2, and d3 are, respectively, 2.515517, 0.802583, 0.010328, 1.432788, and 0.189269 (Kumar et al. Citation2009; Farahmand et al. Citation2015). Substituting α and β with x from EquationEquations (3)
(3)
(3) to Equation(5)
(5)
(5) leads to standardized indices for IDR and WSR (hereafter SI(α) and SI(β)).
Then the two univariate indicators are combined through a multivariate framework as followed (Hao and Singh Citation2015).
(6)
(6)
where Pjt represents the joint (multivariate) empirical probability at month t, calculated by two indexes of SI(αt) and SI(βt). After the two univariate indicators are obtained, the joint empirical probability is hence being derived with the multivariate model of the Gringorten plotting position introduced by Yue et al. (Citation1999).
(7)
(7)
where I denotes the number of occurrences of the pair (SI(αt), SI(βt)) for SI(α) ≤ SI(αt) and SI(β) ≤ SI(βt). The MSRRI, by standardizing the joint distribution function of the IDR index and WSR index (Hao and AghaKouchak Citation2014):
(8)
(8)
where the joint empirical probability Pj can be standardized using EquationEquation (5)(5)
(5) . For each identified socio-economic drought event, the MSRRI value can be calculated through the IDR and WSR.
3.2. The heuristic segmentation method
The traditional time series test methods, such as filter test, sliding T-test, sliding F-test, and the Gramer method, are based on a hypothesis that the time series are stationary and linear when they are used in detecting change points. However, the time series are always non-stationary and nonlinear in real world. The statistical characteristics of the non-stationary time series is a hot topic in many fields. In 2001, Pedro et al. proposed a heuristic segmentation method to study the change of the heart beat non-stationary time series. The heuristic segmentation method segments the non-stationary time series into several self-stationary segments, which overcomes the problem that the traditional test method’s poor application in non-stationary time series (Gong et al. Citation2006; Liu et al. Citation2019a). The heuristic segmentation method is applied in this paper to detect the non-stationary in multivariate drought index time series. The detail computational process can be referred to Pedro et al. (Citation2001).
3.3. The modified Mann–Kendall method
As a frequently used non-parametric test approach, the Mann–Kendall (Mann Citation1945; Kendall Citation1948) trend test method is presented by the World Meteorological Organization (Mitchell et al. Citation1966), which is originated from a rank correlation test put forward by Kendall (Citation1948). Nevertheless, the Mann–Kendall test results are always influenced by the seasonality and persistence existed in the hydrological sequence. A modification of the Mann–Kendall trend test named Seasonal Kendall test (Hirsch et al. Citation1982; Hirsch and Slack Citation1984; Zetterqvist Citation1991) was proposed to eliminate the effect of seasonality. However, the Seasonal Kendall test does not solve the persistence problem (Hirsch and Slack Citation1984). Hamed and Rao (Hamed and Rao Citation1998) put forward the Modified Mann–Kendall trend test method by accounting for the lag-i autocorrelation, which eliminated the persistence of the hydrological sequence successfully. The method is employed in this study due to its robust performance. The detail computational processes can be found in Hamed and Rao.
3.4. The moving-eindow correlation analysis (MWCA) method
Periodic component is one significant part of hydrologic time series. The MWCA is a period analysis method proposed by Xie et al. (Citation2016) for hydrologic series. MWCA constructs periodic processes verifies the significance of periods utilizing the correlation between periodic processes and original series and investigates local time and frequency domain of time series. Moreover, the concept of time frequency centre (TFC) is also proposed for detecting the significant periods of hydrologic series in MWCA. It could identify the true periods, extract the reliable periodic components, find the active time ranges of various periodic components and have a good anti-noise property. MWCA is applied to analyse the periodic component of socio-economic drought series. The specific procedures would be referred to Xie.
3.5. The cross wavelet analysis method
The cross wavelet analysis is a popular method in examining the relationships between two associated time series. Combined the wavelet transform with cross spectrum analysis, it could be used to identify the variation characteristics and coupled oscillations of the two series in both time and frequency fields (Charlier et al. Citation2015). The cross wavelet transform of the two series xn and yn can be defined as WXY=WXWY*, where * is the complex conjugation. Then, the cross wavelet power is described as |WXY| and the complex argument arg(WXY) can be regarded as the local relative phase between xn and yn in the time-frequency domain. The theoretical distribution of the cross wavelet power of the two time-series with their background power spectra and
is expressed as below (Huang et al. Citation2015):
(9)
(9)
where Zv(p) represents the confidence level associated with the probability p for a probability distribution function defined by the square root of the product of two χ2 distributions (Grinsted et al. Citation2004). The relevant codes of the cross wavelet transform can be downloaded freely in the following website: www.pol.ac.uk/home/research/waveletcoherence.
4. Results and discussions
4.1. Variations of monthly MSRRI series in DRB
For the DRB, the reservoir is a within-year system. Thus, the time frame for this system is set as 6 months. The monthly MSRRI series is calculated through considering the WSR indicator and IDR based on the ,
,
and Qmin of the reservoir. The main results are exhibited in . The displayed monthly IDR and WSR indices behave differently in trend and severity, which is related to climatic and reservoir conditions, respectively.
Figure 2. The monthly IDR, WSR and MSRRI series in 1957–2012(a) and 1999–2012(b), respectively.
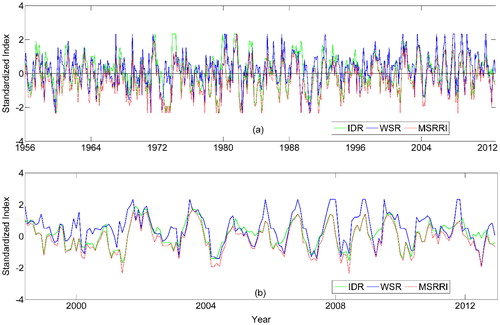
The IDR and WSR values could signify diverse droughts and local reservoir conditions that are relative to the demand. In cases, for instance, as observed in , IDR < 0 means the occurrence of a low-inflow condition (i.e. hydrological drought) for input relative to demand, whilst WSR > 0 represents the storage is adequate to meet the demand. The hydrological indices imply the occurrence of a hydrological drought. However, if the demand could still be met with the available storage, the hydrological drought has not caused a socio-economic drought. By contrast, the scenario of “IDR > 0 and WSR < 0” denotes mean inflow is above to demand (IDR > 0), whilst storage is still below mean and insufficient to meet demand (WSR < 0). This corresponds to a situation in which there is no hydrological drought based on input to reservoirs, while the system is still suffering from a socio-economic drought as the available storage cannot meet the demand.
MSRRI is a combination of IDR and WSR which implies the synthetically information overall the system. As shown in , the three lines of monthly IDR, WSR and MSRRI series demonstrate strong coherence. The correlation coefficients of the monthly MSRRI series in 1957–2012 with the corresponding IDR and WSR series are 0.86 and 0.80, respectively, which indicates the reliability and effectiveness of the MSRRI in characterizing socio-economic droughts. As the integration of IDR and WSR, the smaller of MSRRI the more severe the drought and the more serious water shortage. According to the historical drought data, the certain regions in the DRB experienced severe droughts in 1970, 1990 and 1995 (Wan et al. Citation1997; Wang et al. Citation2015) when the corresponding MSRRI values were smaller than −2. This further verifies the reliability and effectiveness of the MSRRI index.
indicates that MSRRI always presents earlier detection of signs of drought, and with better persistence in DRB. It could be inferred that the MSRRI has better sensitivity in the onset and recovery of socio-economic drought than the IDR and WSR. In addition, the variations of MSRRI are consistent with the changes in all the indices such as supply and storage relative to demand. Therefore, the MSRRI can be adopted to characterize the socio-economic droughts in the DRB with good performance.
4.2. Trends of MSRRI series in DRB
The trends of the MSRRI, IDR and WSR data in DRB are detected at the monthly and annual scale with the application of the MMK trend test method. On the whole, the trend of MSRRI series appears non-significant increasing at the annual scale under the 5% significance level while the monthly MSRRI shows significant increasing tendency. Specifically, the trends statistic value is 3.3818 and 1.8164, respectively, which are less than the standardized test statistic Uα/2=1.96 under the 5% significance level. Additionally, shows the trend line of annual MSRRI series, and the slope of the trend line is 0.0076, which implies progressive increase simultaneously. Generally, the socio-economic drought in 1957–2012 in DRB had a non-significantly increasing trend.
Figure 3. The trends of annual MSRRI(a), IDR(b) and WSR(c) series in 1957–2012 in DRB.
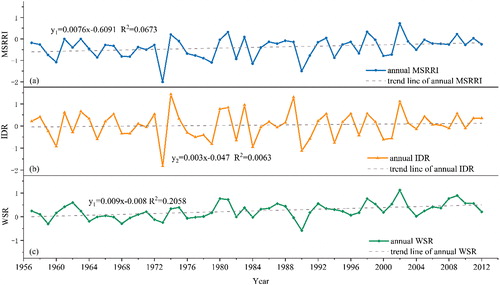
Correspondingly, both annual IDR and WSR series exhibit the performance of sustained growth (). In specific, the WSR appear prominent significantly increasing tendency through the MMK trend test (the statistic value Umonthly=4.009, Uannual=3.4702). Nevertheless, the tendency of IDR maintains incremental change non-significantly both at monthly and annual scale. As mentioned in Section 4.1, the IDR series illustrate stronger coherence with MSRRI, with a significant correlation coefficient 0.86 monthly and 0.91 annually. From this, in part, it can be inferred that IDR occupies a leading role in synthetic index MSRRI. Furthermore, the observed relationship is mainly dominated by variations in the inflow (dominated by metrological component) rather than the bottom-up component.
4.3. Detections of change points of annual MSRRI series
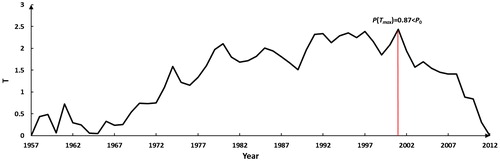
The identification of change points in annual MSRRI series in the DRB was conducted by the application of the heuristic segmentation method which aims to further understanding the changing regime of the socio-economic droughts. With quantifying the discrepancies between the average values of the left- and right-side subseries of MSRRI, the variations were exhibited in . The threshold value of P0 and ε0 were set as 0.95 and 25, respectively (Pedro et al. Citation2001). As shown in , the probability of the largest T = 0.87 is less than P0, which implies that there are no change points detected. Therefore, the stationarity of the annual MSRRI series in the DBR is still valid.
Figure 4. Identification results of change points in the annual MSRRI series in DRB.
4.4. Periodic components of annual MSRRI series
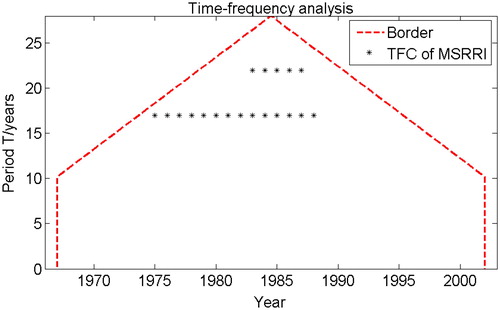
The MWCA method was applied to obtain the periodic component of annul MSRRI series in the DRB at the 5% confidence level. and display the periodic spectrum analysis results of annul MSRRI series. In , the MWCA manifests two apparent periods (T = 17, 22 years), whose coverage ratio is 0.609 and 0.385, respectively. The MWCA could not only detect the true periods according to the period spectrum of time series, but also show the estimated active time ranges of significant periods through the distribution of the TFC points of time series. The TFC points clearly show that T = 17 and T = 22 are two significant periods in the entire time domain, and the period components have no abrupt changes (). Accordingly, it can be believed that annual MSRRI series has two significant periods (17 and 22 years).
Figure 5. Periodic spectrum analysis results of annul MSRRI series in DRB.
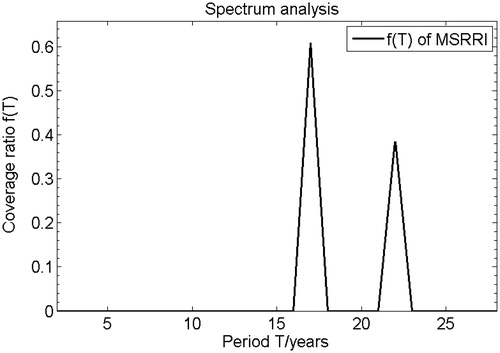
Figure 6. Time frequency analysis results of annul MSRRI series in DRB.
4.5. Analysis of the meteorological driving force behind socio-economic drought
As observed worldwide, the large-scale climate indices show strong linkages with hydrological droughts, especially precipitation event, which is an essential key factor towards reservoir inflow (Huang et al. Citation2016, Citation2017; Liu et al. Citation2019b). Therefore, it is of great necessity to investigate the detailed linkages, especially the evolution of the relations between the socio-economic droughts based on MSRRI from a perspective of climate change. Here, the cross wavelet analysis was utilized to statistically estimate the linkage between annual MSRRI series and climate indices (ENSO, EASM and PNA), with a purpose of revealing the meteorological driving force behind the socio-economic droughts. The cross wavelet transforms between annual MSRRI series in 1957–2012 and corresponding ENSO, EASM and PNA in the DRB are illustrated in , respectively.
Figure 7. The cross wavelet transforms between annual MSRRI series and ENSO during 1957–2012 in DRB. The colour bar denotes the energy density with the unit of 1. The 95% confidence level against red noise is shown as a thick contour and the relationship is represented as arrows (with anti-phase pointing left, in-phase pointing right). (For interpretation of the references to colour in this figure legend, the reader is referred to the web version of this article.).
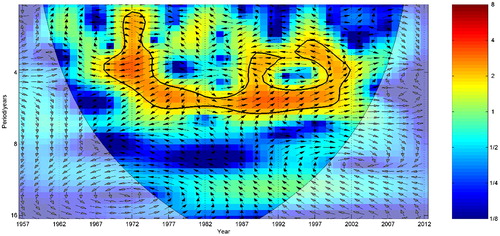
Figure 8. The cross wavelet transforms between annual MSRRI series and EASM during 1957–2012 in DRB. (For interpretation of the references to colour in this figure legend, the reader is referred to the web version of this article.)
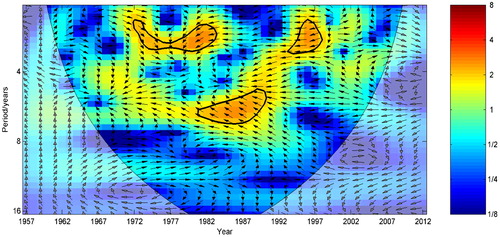
Figure 9. The cross wavelet transforms between annual MSRRI series and PNA during 1957–2012 in DRB. (For interpretation of the references to colour in this figure legend, the reader is referred to the web version of this article.).
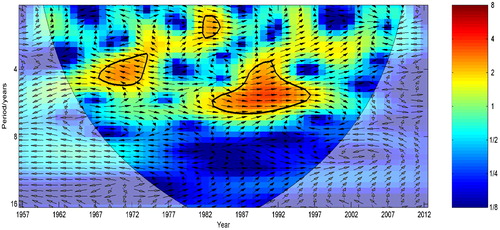
It is evident that ENSO events strongly affect the annual MSRRI series in DRB, implying that ENSO events play an important role in the evolution characteristics of the socio-economic drought in the DRB (). In particular, the ENSO events show consistent, statistically significant coherence at inter-annual (2–6 years) scale with the annual MSRRI series. exhibits the statistically significant linkages is positive in 1981 ∼ 2002 and negative in 1968 ∼ 1980 both with a signal 2–6 year at the 95% confidence level. Additionally, the EASM and PNA also have significant effects on the evolution characteristics of socio-economic drought in the DRB. The EASM showed statistically significant negative correlations with annual MSRRI series with a signal of 2 and3 years in 1971–1982 and in 1992–1998. Moreover, there is also a signal of 5–7 years in 1980–1990. Similarly, the PNA has positive linkages with annual MSRRI with a signal of 3–5 years in 1968–1975 and a signal of 4–6 years in 1982–1997.
Generally, the comprehensive effects of ENSO, EASM and PNA contribute to the variations of the socio-economic droughts in the DRB. Among them, the ENSO has strongest impacts on the socio-economic droughts in the DRB, followed by PNA, and lastly EASM, because the significant correlation region between the ENSO and MSRRI is largest, followed by PNA and EASM. It should be noted that the observed relationship is mainly dominated by variations in the inflow (dominated by metrological component).
5. Conclusion
Socio-economic drought is likely to gain more attention among different drought types as climate changes and population grows. Additionally, it should not be overlooked that reservoirs play a key role in modifying uneven distribution of water in both space and time, which therefore are regarded as the most important and effective man-made water storage facilities in coping with climatic extremes. This offers a further understanding of water stress based on various factors, including large-scale climatic conditions represented by IDR index and local resilience of the water resources system denoted by WSR index to cope with extreme conditions.
In this study, an MSRRI was applied for characterizing the socio-economic drought conditions in the DRB. The main results showed that (1) the MSRRI is more sensitive to the onset and recovery of socio-economic droughts than IDR and WSR, which responds to variations of either or both of the indices (such as supply and storage relative to the demand) as a joint distribution function of IDR and WSR; (2) the MSRRI series in the DRB has a non-significant increasing trend at annual scale with apparent periods (T = 17, 22 years); (3) there are no change points identified in the annual MSRRI series in 1957–2012 in the DRB.
Moreover, the cross wavelet analysis was applied to investigate the linkages between annual MSRRI series and large-scale ocean-atmospheric circulation (ENSO, EASM and PNA) in the DRB, which helps revealing the meteorological driving force of the variations in the socio-economic droughts in the DRB. The results indicate that the comprehensive effects of ENSO, EASM and PNA contribute to the variations of the socio-economic droughts in the DRB, in which the impact of ENSO events is strongest, followed by PNA, and lastly EASM. This suggests that the large-scale ocean-atmospheric circulation index has the potential to improve the accessing of socio-economic droughts in the study region. We highlight the atmospheric impact of large-scale climate indices on the evolution of socio-economic droughts, which has great implications on management of water availability and distribution in semiarid and arid regions.
Disclosure statement
No potential conflict of interest was reported by the authors.
Additional information
Funding
Related Research Data
References
- Arab D, Elyasi A, Far HT, Karamouz M. 2010. Developing an integrated drought monitoring system based on socioeconomic drought in a transboundary river basin: a case study. World Environmental and Water Resources Congress in Providence, Rhode Island, May 16-20, 2010: Challenges of Change; p. 2754–2761.
- Bai T, Wu L, Chang J, Huang Q. 2015. Multi-objective optimal operation model of cascade reservoirs and its application on water and sediment regulation. Water Resour Manage. 29(8):2751–2770.
- Barker LJ, Hannaford J, Chiverton A, Svensson C. 2016. From meteorological to hydrological drought using standardised indicators. Hydrol Earth Syst Sci. 20(6):2483–2505.
- Cayan DR, Maurer EP, Dettinger MD, Tyree M, Hayhoe K. 2008. Climate change scenarios for the California region. Climatic Change. 87(S1):21–42.
- Chang F, Chang Y. 2006. Adaptive neuro-fuzzy inference system for prediction of water level in reservoir. Adv in Water Resourc. 29(1):1–10.
- Charlier JB, Ladouche B, Maréchal JC. 2015. Identifying the impact of climate and anthropic pressures on karst aquifers using wavelet analysis. J Hydrol. 523:610–623.
- Chen J, Fu T. 2011. Application of water poverty index to socioeconomic drought assessment. Water Resources and Power. 29(9):130–133.
- Connell-Buck CR, Medellín-Azuara J, Lund JR, Madani K. 2011. Adapting California’s water system to warm vs. dry climates. Climatic Change. 109(S1):133–149.
- Cronin TM, Dwyer GS, Schwede SB, Vann CD, Dowsett H. 2002. Climate variability from the Florida Bay sedimentary record: possible teleconnections to ENSO, PNA and CNP. Clim Res. 19:233–245.
- Dessai S, Hulme M. 2004. Does climate adaptation policy need probabilities? Climate Policy. 4(2):107–128.
- Dinar A, Mendelsohn RO. (Eds). 2011. Handbook on climate change and agriculture. Edward Elgar Publishing, Cheltenham, Gloucestershire, U. K. p:384-389
- Fang W, Huang Q, Huang S, Yang J, Meng E, Li Y. 2017. Optimal sizing of utility-scale photovoltaic power generation complementarily operating with hydropower: a case study of the world’s largest hydro-photovoltaic plant. Energy Convers Manage. 136:161–172.
- Fang W, Huang S, Huang G, Huang Q, Wang H, Wangal L, Zhang Y, Li P, Ma L. 2019a. Copulas-based risk analysis for inter-seasonal combinations of wet and dry conditions under a changing climate. Int J Climatol. doi: 10.1002/joc.5929.
- Fang W, Huang S, Ren K, Huang Q, Huang G, Cheng G, Li K. 2019b. Examining the applicability of different sampling techniques in the development of decomposition-based streamflow forecasting models. J Hydrol. 568, 534–580.
- Farahmand A, AghaKouchak A, Teixeira J. 2015. A vantage from space can detect earlier drought onset: an approach using relative humidity. Sci Rep. 5: 8553; doi: 10.1038/srep08553.
- Gan TY, Ito M, Hulsmann S, Qin X, Lu X, Liong SY, Rutschman P, Disse M, Koivusalo H. 2016. Possible climate change/variability and human impacts, vulnerability of drought-prone regions, water resources and capacity building for Africa. Int Assoc Scient Hydrol Bull. 61(7):1209–1226.
- Gong Z, Feng G, Wan S, Li J. 2006. Analysis of features of climate change of Huabei area and the global climate change based on heuristic segmentation algorithm. Acta Phys Sin. 55(1):477–484.
- Grinsted A, Moore JC, Jevrejeva S. 2004. Application of the cross wavelet transform and wavelet coherence to geophysical time series. Nonlin Processes Geophys. 11(5/6):561–566.
- Guttman NB. 1998. Comparing the Palmer Drought index and the standardized precipitation index. J Am Water Resourc Assoc. 34(1):113–121.
- Hamed KH, Rao AR. 1998. A modified Mann–Kendall trend test for autocorrelated data. J Hydrol. 204(1–4):182–196.
- Hao Z, AghaKouchak A. 2014. A nonparametric multivariate multi-index drought monitoring framework. J Hydrometeor. 15(1):89–101.
- Hao Z, Singh VP. 2015. Drought characterization from a multivariate perspective: a review. J Hydrol. 527:668–678.
- Heim RR. 2002. A review of twentieth-century drought indices used in the United States. Bull Amer Meteor Soc. 83(8):1149–1166.
- Hirsch RM, Slack JR. 1984. Non-parametric trend test for seasonal data with serial dependence. Water Resour Res. 20(6):727–732.
- Hirsch RM, Slack JR, Smith RA. 1982. Techniques of trend analysis for monthly water quality data. Water Resour Res. 18(1):107–121.
- Huang S, Chang J, Huang Q, Chen Y. 2014a. Monthly streamflow prediction using modified EMD-based support vector machine. J Hydrol. 511:764–775.
- Huang S, Chang J, Huang Q, Chen Y. 2014b. Spatio-temporal changes and frequency analysis of drought in the Wei River Basin, China. Water Resour Manage. 28(10):3095–3110.
- Huang S, Huang Q, Chang J, Leng G, Xing L. 2015. The response of agricultural drought to meteorological drought and the influencing factors: a case study in the Wei River Basin, China. Agr Water Manage. 159:45–54.
- Huang S, Huang Q, Chang J, Leng G. 2016. Linkages between hydrological drought, climate indices and human activities: a case study in the Columbia River basin. Int J Climatol. 36(1):280–290.
- Huang S, Li P, Huang Q, Leng G, Hou B, Ma L. 2017. The propagation from meteorological to hydrological drought and its potential influence factors. J Hydrol. 547:184–195.
- Kendall MG. 1948. Rank correlation methods. Oxford: Griffin.
- Kumar MN, Murthy CS, Sai MVRS, Roy PS. 2009. On the use of Standardized Precipitation Index (SPI) for drought intensity assessment. Met Apps. 16(3):381–389.
- Li Y, Li J, Feng J. 2013. Boreal summer convection oscillation over the Indo-Western Pacific and its relationship with the East Asian summer monsoon. Atmos Sci Lett. 14(2):66–71.
- Lin Q, Wu Z, Singh VP, Sadeghi SHR, He H, Lu G. 2017. Correlation between hydrological drought, climatic factors, reservoir operation, and vegetation cover in the Xijiang Basin, South China. J of Hydrol. 549:512–524.
- Liu S, Huang S, Xie Y, Wang H, Huang Q, Leng G, Li P, Wang L. 2019a. Spatial-temporal changes in vegetation cover in a typical semi-humid and semi-arid region in China: Changing patterns, causes and implications. Ecol Indicator, 98, 462–475.
- Liu S, Huang S, Xie Y, Wang H, Leng G, Huang Q, Wei X, Wang L. 2019b. Identification of the non-stationarity of floods: Changing patterns, causes, and implications. Water Resourc Manage. doi: 10.1007/s11269-018-2150-y.
- Lorenzolacruz J, Vicente-Serrano SM, GonzálezHidalgo JC, López-Moreno JI, Cortesi N. 2013. Hydrological drought response to meteorological drought in the Iberian Peninsula. Clim Res. 58(2):117–131.
- Madani K. 2014. Water management in Iran: what is causing the looming crisis?. J Environ Stud Sci. 4(4):315–328.
- Mann HB. 1945. Nonparametric tests against trend. Econometrica: J Econometr Soc. 13(3):245–259.
- Mastrandrea MD, Heller NE, Root TL, Schneider SH. 2010. Bridging the gap: linking climate-impacts research with adaptation planning and management. Climatic Change. 100(1):87–101.
- McKee TB, Doesken NJ, Kleist J. 1993. The relationship of drought frequency and duration to time scales. Proceedings of the 8th Conference on Applied Climatology, January 17–22, p. 179–183. Boston, MA: American Meteorological Society.
- Mehran A, Mazdiyasni O, AghaKouchak A. 2015. A hybrid framework for assessing socioeconomic drought: Linking climate variability, local resilience, and demand. J Geophys Res Atmos. 120(15):7520–7533.
- Meng E, Huang S, Huang Q, Fang W, Wu L, Wang L. 2019. A robust method for non-stationary streamflow prediction based on improved EMD-SVM model. J Hydrol. 568, 462–478.
- Mitchell JJM, Dzerdzeevskii B, Flohn H, Hofmeyr WL, Lamb HH, Rao KN, Wallén CC. 1966. Climatic change. WMO Technical Note 79 (WMO-No. 195/TP. 100). Geneva: World Meteorological Organization.
- Montanari A. 2015. Debates–perspectives on socio-hydrology: introduction. Water Resour Res. 51(6):4768–4769.
- MoránTejeda E, Ceglar A, Medvedcvikl B, Vicente-Serrano SM, López-Moreno JI, González-Hidalgo JC, Revuelto J, Lorenzo-Lacruz J, Camarero J, Pasho E. 2013. Assessing the capability of multi-scale drought datasets to quantify drought severity and to identify drought impacts: an example in the Ebro Basin. Int J Climatol. 33(8):1884–1897.
- Palmer WC. 1965. Meteorological drought. Washington, DC: Department of Commerce Weather Bureau.
- Palmer WC. 1968. Keeping track of crop moisture conditions, nation-wide: the new crop moisture index. Weatherwise. 21(4):156–161.
- Pedro BG, Plamen CI, Luís ANA, Eugene HS. 2001. Scale invariance in the nonstationary of human heart rate. Phys Rev Lett. 87(16):160815.
- Seager R, Vecchi GA. 2010. Greenhouse warming and the 21st century hydroclimate of southwestern North America. Proc Nat Acad Sci USA. 107(50):21277–21282.
- Shafer BA. 1982. Development of a surface water supply index (SWSI) to assess the severity of drought conditions in snowpack runoff areas. Proceedings of the 50th Annual Western Snow Conference, Colorado State University, Fort Collins. p. 164–175.
- Shiklomanov IA, Shiklomanov AI, Lammers RB, Peterson BJ, Vorosmarty CJ. 2000. The dynamics of river water inflow to the Arctic Ocean. In: E.L. Lewis et al. (eds.), The freshwater budget of the Arctic Ocean. Dordrecht: Springer; p.281–296.
- Shukla S, Wood AW. 2008. Use of a standardized runoff index for characterizing hydrologic drought. Geophys Res Lett. 35, L02405, doi: 10.1029/2007GL032487.
- Sivapalan M. 2015. Debates-Perspectives on socio-hydrology: Changing water systems and the “tyranny of small problems”-Socio-hydrology. Water Resour Res. 51(6):4795–4805.
- Tan X, Gan TY, Shao D. 2016. Wavelet analysis of precipitation extremes over Canadian ecoregions and teleconnections to large-scale climate anomalies. J Geophys Res: Atmos. 121(24):14469-14486
- Vicente-Serrano SM, Beguería S, López-Moreno JI. 2010. A multi-scalar drought index sensitive to global warming: the standardized precipitation evapotranspiration index. J Climate. 23(7):1696–1718.
- Vicente-Serrano SM, López-Moreno JI, Beguería S, Lorenzo-Lacruz J, Azorin-Molina C, Morán-Tejeda E. 2012. Accurate computation of a streamflow drought index. J Hydrol Eng. 17(2):318–332.
- Vogel RM, Lall U, Cai X, Rajagopalan B, Weiskel PK, Hooper RP, Matalas NC. 2015. Hydrology: The interdisciplinary science of water. Water Resour Res. 51(6):4409–4430.
- Wada Y, Van Beek LPH, Viviroli D, Dürr HH, Weingartner R, Bierkens MF. 2011. Global monthly water stress: 2. Water demand and severity of water stress. Water Resour Res. 47, W07518, doi: 10.1029/2010WR009792
- Wan X, Han Y, Zhang P. 1997. Study on the droughts and soil moisture in Gansu Province in 1995. Gansu Agric Sci Technol. 6:24–25. (in Chinese)
- Wang Q, Li F, Liu B, Ling H. 2015. Variation in drought and its response to climate warming in Qinghai plateau in recent 50 years. Arid Zone Res. 32(1):65–72.
- Wheater HS, Gober P. 2015. Water security and the science agenda. Water Resour Res. 51(7):5406–5424.
- Wilhite DA. 2000. Drought as a natural hazard: concepts and definitions. In: Drought A Global Assessment. Vol. 1; edited by Donald A. Wilhite, London: Routledge, chap. 1; p. 3–18.
- Wilhite DA, Glantz MH. 1985. Understanding: the drought phenomenon: the role of definitions. Water Int. 10(3):111–120.
- Wu Z, Wang B, Li J, Jin F. 2009. An empirical seasonal prediction model of the East Asian summer monsoon using ENSO and NAO. J Geophys Res: Atmos. 114, D18120, doi: 10.1029/2009JD011733.
- Xie Y, Huang Q, Chang J, Liu S, Wang Y. 2016. Period analysis of hydrologic series through moving-window correlation analysis method. J Hydrol. 538:278–292.
- Yang X, Lu X. 2014. Drastic change in China's lakes and reservoirs over the past decades. Sci Rep. 4:6041
- Yue S, Ouarda TBMJ, Bobée B, Legendre P, Bruneau P. 1999. The Gumbel mixed model for flood frequency analysis. J Hydrol. 226(1/2):88–100.
- Zetterqvist L. 1991. Statistical estimation and interpretation of trends in water quality time series. Water Resour Res. 27(7):1637–1648.
- Zhang S, Gao H, Naz BS. 2014. Monitoring reservoir storage in South Asia from multisatellite remote sensing. Water Resour Res. 50(11):8927–8943.
- Zseleczky L, Yosef S. 2014. Are shocks really increasing? A selective review of the global frequency, severity, scope, and impact of five types of shocks (Vol. 5). International Food Policy Research Institute, Addis Ababa, Ethiopia