
 ?Mathematical formulae have been encoded as MathML and are displayed in this HTML version using MathJax in order to improve their display. Uncheck the box to turn MathJax off. This feature requires Javascript. Click on a formula to zoom.
Abstract
The various patterns of spatial heterogeneity in the eco-environment of the Silk Road Economic Belt of China differ greatly. In this study, a partition–integration concept was introduced to assess the ecological vulnerability of the Silk Road Economic Belt in China. To confirm the comparability of ecological vulnerability among different sub-regions, the net primary productivity (NPP) was utilized to determine the ecological vulnerability thresholds for different sub-regions. The results indicated that: (1) the new assessment model of ecological vulnerability based on the partition–integration concept was strongly operational and practical for the study region; (2) NPP was conducive to the continuous expression of ecological vulnerability, which can ensure better comparison and analysis of ecological vulnerability among the three sub-regions; (3) the spatial patterns of zones at different vulnerability levels differed greatly. The mild vulnerability zone was the most widely distributed, whereas the zone of slight vulnerability covered the smallest area. (4) Specific environmental protection and treatment measures should be conducted in the three sub-regions with different dominant ecological problems. These results can provide decision-making support in realizing the great strategy of the “one belt and one road” idea.
1. Introduction
Ecological vulnerability refers to the sensitivity and resilience of a landscape or ecosystem toward disturbances of the external environment on a specific spatial-temporal scale (Chuvieco et al. Citation2014; Beroya-Eitner Citation2016). Since the twentieth century, environmental temperatures have increased worldwide, causing significant changes in the global climate and environment. Feedbacks to ecosystem changes, such as loss of species diversity, frequent occurrences of extreme weather events, intensified desertification, and melting of the polar glaciers all greatly threaten the survival of human beings and the sustainable development of a social economy (Farley and Voinov Citation2016; Heltberg et al. Citation2009). Moreover, with the rapid expansion of population and unreasonable exploitation and utilization of resources, the restorative and self-purification abilities of ecosystems have been declining; thus, both human living and natural environments have become more fragile (Li et al. Citation2007; Nandy et al. Citation2015; Liang et al. Citation2017). Ecological vulnerability assessment has become an important means for recognizing ecological conditions, which can aid sustainable development and ecological restoration of fragile ecological areas (Song et al. Citation2010; Shao et al. Citation2015; Sahoo et al. Citation2016). In September 2013, a strategic vision of the ‘Silk Road Economic Belt’ was proposed by President XI; subsequently, the Silk Road Economic Belt has become a relevant topic both at home and abroad (Li et al. Citation2017). The Silk Road Economic Belt of China, with a fragile ecological environment, is an important energy base, extending the advanced provinces of East China eastward, and linking Central Asian countries westward (Liu and Hao Citation2018). However, eco-environmental problems, including drought, desertification, salinization, and soil and water loss, have greatly restricted the sustainable development of the regional economy and society. Therefore, quantitative assessment of the ecological vulnerability of the Silk Road Economic Belt of China is of great importance in realizing the great strategy of ‘one belt and one road’.
The first assessment of ecological vulnerability performed in China dates back to the 1980s; since then, numerous empirical investigations and analyses have been conducted at varying scales (national, regional, and municipal) in different regions (Linder et al. Citation2010; Zhang et al. Citation2015). Through field investigation of ecological conditions in the Bosten Lake basin, the driving mechanisms of ecological vulnerability for the Bosten Lake wetland were analyzed and discussed by combining qualitative and quantitative methods (Ye et al. Citation2017). A pressure-support-state-response model (PSSR) was proposed for ecosystem vulnerability assessment, which had been applied to analyze the spatial patterns of the ecological vulnerability of wetlands in the Yellow River Delta (Zhang et al. Citation2017). Considering ecological sensitivity, pressure, and resilience, an ecological vulnerability assessment indicator system comprising nine elements and 12 indicators was established by Hong et al. (Citation2016) and applied to finding the range of ecologically vulnerable areas in a highly urbanized region. Using remote sensing and geographic information system (GIS) technology, the wetlands of the Yellow River Delta were measured and the influence of human activities on wetland degradation was discussed (Wang et al. Citation2008). During recent decades, various ecological vulnerability assessment frameworks have been proposed, such as the vulnerability scoping diagram assessment framework (Polsky et al. Citation2007), the environmental sensitivity index (Amiri et al. Citation2014; Kang et al. Citation2018), and the pressure-state-response assessment framework (Zhang et al. Citation2017). In addition, specific vulnerability assessment methods have often been utilized as follows: the principal component analysis method (Li et al. Citation2006), the analytic hierarchy process (AHP) method (Guo et al. Citation2016; Shen et al. Citation2016; Topuz and van Gestel Citation2016), the fuzzy comprehensive evaluation method (Enea and Salemi Citation2001; Adriaenssens et al. Citation2004;) and the entropy method (Amiri et al. Citation2014; Hou et al. Citation2015). With its development, aeronautical remote sensing has become one of the most important technologies available for collecting biological parameters (Liu et al. Citation2006; Rogers and Xue Citation2015). Despite its advantages, such as the spatially explicit nature of measurements and the consistency across political borders, there were also some disadvantages that needed improvement.
Over recent decades, various investigations have been conducted to qualitatively or quantitatively evaluate ecological vulnerability, on varying scales, of the Silk Road Economic Belt of China (Liu et al. Citation2006; Hou et al. Citation2015; Jin and Wang Citation2016). However, spatial heterogeneity patterns of the eco-environment have not been considered in previous research. Further, how to determine a reasonable threshold to ensure the comparability of ecological vulnerabilities among the different regions should also be investigated. Therefore, fully considering the diversity of ecosystems in the Silk Road Economic Belt of China, the partition–integration concept has been introduced to assess the ecological vulnerability of the study region. In addition, the net primary productivity (NPP) and natural breaks methods have been utilized to determine the threshold for confirming the spatial consistency of ecological vulnerability among the different sub-zones.
2. Materials and methods
2.1. Study area
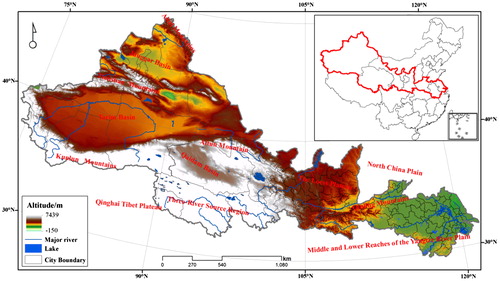
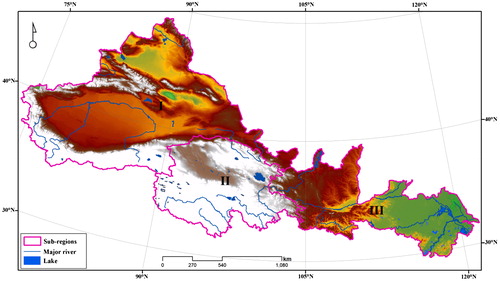
Historically, the Silk Road was an ancient network of routes that facilitated trade, culture, knowledge, and enhanced relations between people and between countries (Liu and Hao Citation2018). Geographically, the Silk Road Economic Belt in China (73°41′–121°57′E, 29°41′–49°33′N; ) covers an area of about 3.40 million km2, including Jiangsu Province, Anhui Province, Henan Province, Shanxi Province, Gansu Province, Qinghai Province, the Ningxia Hui Autonomous Region, and the Xinjiang Uygur Autonomous Region (Xu et al. Citation2017). The terrain is complex and diverse, comprising the North China Plain, Loess Plateau, Tarim Basins, Qinghai-Tibetan Plateau, Altay Mountains, and the Tienshan and Kunlun Mountains (Deng et al. Citation2008). The altitude difference of the whole study region can reach 7000 m. Influenced by the East Asian monsoon, there is an increasing trend in the annual average precipitation from the southeast (1000 mm) to the northwest (50 mm). The annual temperature ranges from −2.5 °C to 10 °C. The climate type is diverse, including a temperate monsoon climate and temperate continental climate (Li et al. Citation2014). Owing to the singular structure of the ecosystem and low vegetation coverage, the ecosystem of the western part is extremely fragile, and the area of soil salinization and desertification is widely distributed (Wang et al. Citation2011).
Figure 1. Location of the Silk Road Economic Belt in China. Source: Author
2.2. Materials
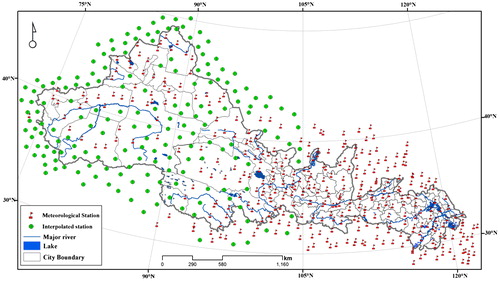
The meteorological data during 2011–2015, including daily precipitation (mm), daily mean temperature (°C), daily highest temperature (°C), daily lowest temperature (°C), and daily and average wind velocity (m/s), were obtained from the Climatic Information Center of China (available at http://data.cma.cn/). The 342 meteorological stations are unevenly distributed over and around the whole study region, particularly in the western part (). Thus, 176 interpolated stations were constructed according to the dataset of TRMM3B42 (Guo et al. Citation2016). The statistical spatial downscaling algorithm of TRMM (EquationEquation 1(1)
(1) ) was used in this study (Guo et al. Citation2017):
(1)
(1)
where Pd is the daily precipitation of the meteorological stations, and ptrmm is the daily precipitation calculated using the 3-hourly precipitation from TRMM3B42.
Figure 2. Spatial distributions of the meteorological and interpolated stations. Source: Author
First, each 3-hourly precipitation rate was multiplied by 3 h to calculate the precipitation for each 3-h period, using FORTRAN. Then, the daily precipitation was obtained by accumulating all 3-hourly precipitation data as defined for the 24-h period.
Land use types from 2013 at 1:100,000 were obtained from the Institute of Remote Sensing and Digital Earth, Chinese Academy of Sciences. This dataset was obtained by combining the computer-automated and manual interpretations with Landsat TM/ETM+/OLI. The digital elevation model data were downloaded free of charge from the National Geospatial-Intelligence Agency and the National Aeronautics and Space Administration (NASA) (available at http://srtm.csi.cgiar.org). The normal differential vegetation index (NDVI) data obtained from the MOD13A2 satellite were produced at a pixel resolution of 1000 m, with a 16-day interval. The annual net primary production (NPP) data derived from MOD17A3 was produced at a spatial resolution of 1000 m. The above mentioned datasets can be collected from NASA-EOS (National Aeronautics and Space Administration Earth Observing System) (https://ladsweb.modaps.eosdis.nasa.gov). Detailed information regarding soil types for the study region, such as soil organic carbon (%), soil particle size distribution (%, sand, silt, and clay content), and calcium carbonate (%), was acquired from the Institute of Soil Science, Chinese Academy of Sciences; the spatial resolution of this dataset is 1000 m. The statistical social and economic data, including population, gross domestic product, and the Engel coefficient, were collected from the national and provincial statistical yearbooks.
2.3. Methods
2.3.1. Weighted linear combinations method
Integrated multiple factors into one index could indicate the condition of the eco-environment (Song et al. Citation2010; Guo et al. Citation2016). The method of weighted linear combinations (EquationEquation 2(2)
(2) ), widely used in the vulnerability or quality assessment of an ecosystem, was used herein to calculate the ecological vulnerability index:
(2)
(2)
where EVI refers to the ecological vulnerability index; wj refers to the weight of factor j; and Ij refers to the standardized factor j.
2.3.2. Fuzzy analytic hierarchy process
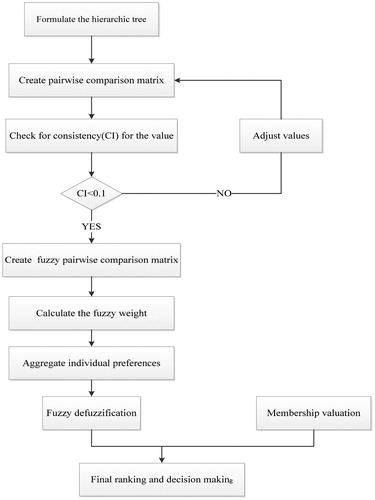
Various methods have been applied to assess ecological vulnerability in different regions, such as the entropy-weight method (Amiri et al. Citation2014), the fuzzy comprehensive assessment (Enea and Salemi Citation2001; Adriaenssens et al. Citation2004), the AHP method (Mikhailov and Tsvetinov Citation2004; Sahoo et al. Citation2016), the landscape evaluation method (Linder et al. Citation2010), and the principal component method (Li et al. Citation2006). Among these methods, the AHP method is one of the most widely used evaluation tools, which can determine the weights of the evaluated factors based on expert experience. However, the subjective judgment in AHP cannot fully consider the inherent uncertainty and ambiguity. Thus, the membership function (EquationEquation 3(3)
(3) ) was introduced to establish the fuzzy analytic hierarchy process (FAHP) with AHP (see ):
(3)
(3)
where
refers to the membership value of factor i;
refers to the value of factor i; d is the width of the transition interval; and b refers to the factor value, whereas the membership value is 1.
Figure 3. Technical process of the fuzzy analytic hierarchy process (FAHP).
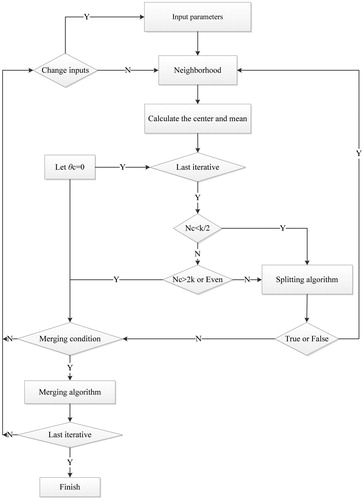
2.3.3. ISODATA algorithm
The ISODATA algorithm is an unsupervised classification method, which is used to simultaneously classify raster grids (various layers) into several categories (Li et al. Citation2017; Zhang et al. Citation2018). The detailed steps of the ISODATA algorithm are listed as follows (see ). The detailed information of the evaluation system and weights is listed in the following table ().
Figure 4. Technical process of the ISODATA algorithm.
2.3.4. Standardization for assessment variables
As the evaluated factors are measured in different units, they must be standardized to a uniform scale (Guo et al. Citation2016; Zhou et al. Citation2016; Guo et al. Citation2017). Therefore, in the process of ecological vulnerability assessment, the first step is to establish a standardized measurement system for all factors. For this case, variables can be processed using EquationEquations 4(4)
(4) and Equation5
(5)
(5) to change them into unitless variables (0–1):
(4)
(4)
where Ii refers to the standardized factor of Var; Varmin refers to the minimum value of factor Var; and Varmax refers to the maximum value of factor Var.
3. Evaluation system of the sub-regions of the silk road economic belt in China
3.1. Partition of the eco-environment
Owing to the vast territory of the Silk Road Economic Belt, there are significant differences in the ecosystems among the different sub-regions (Liu and Hao Citation2018). Moreover, the dominant eco-environmental problems affecting the vulnerability of the regional ecosystems differ greatly (Zhou and Ren Citation2011). Partitioning of the eco-environment is essential for large-scale ecological vulnerability assessment. Expert integration methods have been widely used to construct the eco-environmental sub-regions, which cannot be repeatedly operated owing to the overreliance on expert experience and knowledge.
In this study, spatial autocorrelation analysis was performed among various factors affecting eco-environmental vulnerability by combining the GIS and remote sensing. The result thus obtained showed that correlations among various factors are significant. In addition, the number of factors is vast, which is not conducive to the partitioning of the eco-environment (). Thus, the principal component analysis method was introduced to obtain the main components of the multi-factors, which could largely eliminate the correlation among different factors. Furthermore, the top four principal components with an information contribution of more than 96% were extracted (, EquationEquations (6–7)).
(6)
(6)
where x1, x2, x3, x4, x5, x6, x7, x8, x9, x10, x11, x12, x13, and x14 refers to precipitation, temperature, sunshine hour, aridity, wind velocity, accumulated temperature (>10 °C), altitude, slope, aspect, NDVI, NPP, soil erosion, salinization, and desertification, respectively.
Table 1. Factors for partitioning the eco-environment.
Table 2. Order of principal components and accumulative variance contribution rates.
Then, the ISODATA was utilized to obtain the sub-regions of the study region (). Four partition schemes () were obtained based on four components. showed that there were two sub-regions (sub-region I and sub-region II), mainly resulting from the climate and vegetation factors. Sub-region I was primarily distributed in the humid and semi-humid area, whereas Sub-region I covered the arid and semi-arid zones. Sub-region I in was divided into two parts because of the topography and soil factors; Sub-regions I and II in were divided into two parts, mainly according to the climate factors. In , there were four sub-regions. Then, fully considering the dominant eco-environmental problems (desertification, wind erosion, salinization, freeze–thaw erosion, and soil and water erosion) and previous researches of the Silk Road Economic Belt in China, the study region was finally divided into three sub-regions ().
Figure 5. Different partition schemes for the Silk Road Economic Belt in China. (a) Two sub-regions; (b) Three sub-regions; (c) Four sub-regions; (d) Five sub-regions. Source: Author
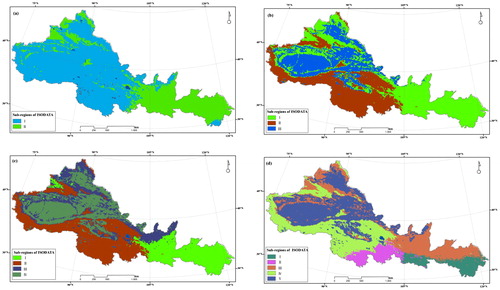
Figure 6. The three sub-regions of eco-environments. Sub-region I refers to the Arid Desert Ecological Region; Sub-region II refers to the Alpine Ecological Region; Sub-region III refers to Humid and Semi-humid Ecological Regions. Source: Author
3.2. Construction of an evaluation system for the three sub-regions
Considering the spatial heterogeneity patterns of the eco-environments of the Silk Road Economic Belt, different evaluation systems can be constructed for different sub-regions. Moreover, the factors to be evaluated must be chosen according to dominance, adaptability, and rationality principles.
3.2.1. Evaluation system of the arid desert ecological region
The Arid Desert Ecological Region is located in the northwest of China, which is slightly influenced by the humid monsoon. The annual precipitation in this area is generally less than 200 m and the vegetation is low (Jin and Wang Citation2016). The surface landscape is dominated by deserts, including the Gobi, and wind-eroded hills. The eco-environmental characteristics of the Arid Desert Ecological Region are sandstorms, drought, desertification, wind erosion, and salinization (Deng et al. Citation2008. Based on field investigations of the eco-environmental background characteristics of the Arid Desert Ecological Region, the evaluation system herein has been established in conjunction with the National Main Function Zone Planning and Implementation Plan, the Technical Standard for Ecological Environment Status Assessment (Trial Implementation), and related previous studies. Next, the weight for each factor in the evaluation system was determined via the FAHP. provides detailed information regarding the same:
Table 3. Evaluating the system and weight of each factor for the Arid Desert Ecological Region.
3.2.2. Evaluation system of the alpine ecological region
The Alpine Ecological Region is located in the Qinghai-Tibet Plateau. Owing to the spatial-temporal distributions of water and heat, the climate of the Alpine Ecological Region is characterized by strong wind, drought, hypoxia, cold, strong radiation, and large temperature differences between day and night (Guo et al. Citation2016). In addition, the average altitude of this sub-region is over 3000 m. Therefore, the dominant eco-environmental problems comprise freeze–thaw erosion, salinization, and drought (Yang et al. Citation2004). The process of selecting the evaluating factors and determining the weight for each factor was similar to that of the Arid Desert Ecological Region. The detailed information of the evaluation system and weights is listed in .
Table 4. Evaluating system and the weight of each factor for the Alpine Ecological Region.
Table 5. Evaluating system and the weight of each factor for the humid and semi-humid ecological regions.
3.2.3. Evaluation system of the humid and semi-humid ecological region
The Humid and Semi-humid Ecological Region is located in the Loss Plateau and the Huang-Huai-Hai Plain, and its climate is significantly affected by the marine monsoon in summer and the Siberian High in winter. Majority of the precipitation occurs during summer (Li et al. Citation2009; Wang et al. Citation2011; Fan et al. Citation2015). The ecosystem of this sub-region was greatly disturbed by rainstorms, soil and water erosion, and human activities (Jiao et al. Citation2012). The process of selecting the evaluating factors and determining the weight for each factor was similar to that of the Arid Desert Ecological Region. The detailed information of the evaluation system and weights is listed in the following table:
4. Results
4.1. Quantitative assessment of the Sub-regions
The weighted linear combinations method was adopted to calculate the ecological vulnerability index of the three sub-regions based on . However, the comparison and analysis were difficult to conduct owing to the differences in evaluation systems and weights of the factors for the three sub-regions. NPP had a clear ecological meaning, which was conducive to the continuous expression of ecological vulnerability in the different sub-regions (Guo et al. Citation2016). In this study, NPP has been introduced to help determine the thresholds of ecological vulnerability. The steps can be listed as follows: (1) the NPP of the whole study region was first divided into four categories using the tool of natural breaks of ArcGIS 10.2; (2) the categorized NPP were then extracted for the three sub-regions; (3) the average vulnerability index of each NPP category for the three sub-regions was calculated; (4) finally, the vulnerability thresholds of the three sub-regions were determined using the statistical average value of the vulnerability indices. Based on the vulnerability thresholds for the three sub-regions (), the spatial distribution of different levels of ecological vulnerability for the Silk Road Economic Belt of China was obtained ().
Figure 7. Spatial distribution of the different levels of ecological vulnerability. Source: Author
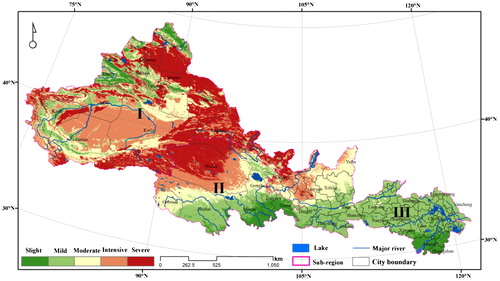
Table 6. Vulnerability thresholds for the three sub-regions.
4.2. Spatial patterns of the ecological vulnerability of the Silk Road Economic Belt
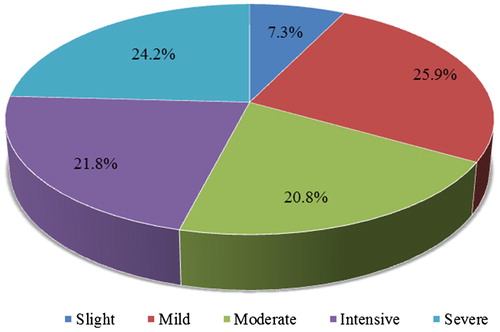
As shown in and , the spatial patterns of the zones at different vulnerability levels differed greatly. The mild vulnerability zone was the most widely distributed and accounted for 25.9% of the entire study region. This zone was concentrated in the middle part of the Three River Source Region (including southern Zhiduo and northern Maqin), the western margin of Tarim Basin (including the middle of Kashi, Southern Hetian), the southern part of the North China Plain, and the Qinling Mountains region. The zone of severe vulnerability, covering the second largest area (accounting for 24.2%), was mainly distributed across Junggar Basin, Qaidam Basin, and the western part of the Inner Mongolia Plateau. The zone of intense vulnerability was mostly distributed across Tarim Basin (including Korla and northern Hetian), the southeastern part of the Qaidam Basin (including Wulan), and the western part of the Loess Plateau. The moderate vulnerability zone was discontinuously distributed across the northern part of the Three River Source Region and the eastern part of the Loess Plateau. Of all the vulnerability levels, the zone of slight vulnerability covered the smallest area and accounted for 7.3%. This zone was mostly concentrated in the southeast part of the Three River Source Region, the Ili River Valley, and the Altay Mountains.
Figure 8. Area percentages of the different levels of ecological vulnerability.
5. Discussions
5.1. Analysis of the method presented
The partition–integration concept has been introduced to establish the evaluation system of the ecological vulnerability of the Silk Road Economic Belt of China, combing the FAHP, RS, and GIS. Similar studies have not been reported in the field of ecological vulnerability evaluation. The Silk Road Economic Belt of China covers about 3.40 million km2, which comprises eight provinces (Xu et al. Citation2017). The terrain and climate are complex and diverse. The dominant ecological problems significantly differ over the whole study region (Liu and Hao Citation2018). In addition, the relative importance of factors considerably varies across the different sub-regions. This method fully considered the spatial pattern differences of the ecological environments, and different evaluation systems were developed. The determination of weights for factors played an important role in the process of vulnerability evaluation. The method of FAHP brought the triangular fuzzy number of the fuzzy set theory into the pair-wise comparison matrix of the AHP, which solved the vague problems that occurred during the analysis of criteria and the judgment process (Adriaenssens et al. Citation2004; Li et al. Citation2009; Topuz and van Gestel Citation2016). Thus, FAHP should tolerate vagueness or ambiguity and be more appropriate and effective than conventional AHP in dynamic estimations of eco-environmental vulnerability.
5.2. Major problems of the three sub-regions
The predominant problems of the three sub-regions considerably differed over the whole study region:
The Arid Desert Ecological Region is located in the northeastern inland area, which is a typical arid region with an annual precipitation of 146 mm (Deng et al. Citation2008). In addition, this sub-region is one of the most severely affected regions by meteorological disasters (Zhang et al. Citation2008). Various disasters, including cold waves, strong winds, snowstorms, sandstorms, heavy rain, early frost, drought, and continuous extreme heat, are widely and unevenly distributed across this entire sub-region (Xu et al. Citation2017). The composition of the vegetation ecosystem is extremely poor, and the community is homogeneous. The structure of the regional ecosystem is mostly monolayer while the biological productivity is extremely low (Guo et al. Citation2017). Therefore, the stability of the ecosystem is low and its self-regulating ability is poor. During the past decades, owing to excessive economic activities, the balance of the ecosystem has been destroyed, and processes of change have occurred in originally non-desert areas (mainly desert grasslands with sparse vegetation), where the surface pattern is similar to the desert landscape (Jin and Wang Citation2016). Desertification is another major environmental problem due to the abundant sources of sand and wind. Moreover, excessive human activity, such as indiscriminate reclamation, logging, digging, cutting, and blind deforestation has greatly destroyed the natural vegetation and gradually transformed non-desert land into desert land (Deng et al. Citation2008). Salinization is one of the most widely distributed ecological problems in this zone owing to the arid climate that can bring the salt of deep soils to the ground surface (Guo et al. Citation2017). In addition, improper agricultural measures, such as blocked drainage systems, have greatly exacerbated this ecological problem.
The Alpine Ecological Region is located in the northeastern part of the Qinghai-Tibetan Plateau. Desertification is the most serious ecological problem in this sub-region owing to its dry and cold climate and human activity (Guo et al. Citation2016). The desertified land types mainly comprise mobile dunes, semi-fixed dunes, and fixed dunes. Moreover, an increasing trend has been observed in the area’s desertification with increasing global warming and human activity (Nandy et al. Citation2015). Freeze–thaw erosion was widely distributed throughout the Qilian Mountains, directly affecting and restricting floral succession and further accelerating the degradation process of the grassland (Shao et al. Citation2015). Soil wind erosion and salinization is widely distributed in Qaidam Basin, causing great loss of arable land resources (Liu et al. Citation2006). Soil water erosion is mainly concentrated in the eastern part of the study region, particularly in the loess hilly region. During recent decades, an increasing trend has been observed in the frequency of drought, snowstorms, and sandstorms, which has brought great loss to farmers and herdsmen (Yang et al. Citation2004; Guo et al. Citation2016).
The Humid and Semi-humid Ecological Region is mostly located in the Loess Plateau and North China Plain. The dominant ecological problems in this region constitute drought, catastrophic floods, rainstorms, sandstorms, and soil water erosion (Hou et al. Citation2015). Owing to the increase in population, the scope and intensity of reclaimed land have been continuously spread, and the vegetation has been seriously damaged (Fan et al. Citation2015). The Loess Plateau has become one of the most serious soil erosion areas in the world, with the erosion area accounting for 80% of the total area (Li et al. Citation2009). Long-term, severe soil erosion has led to the fragmentation and fissuring of the Loess Plateau. In recent centuries, human activity has strongly influenced the evolution of the ecological environment in the Loess Plateau. Furthermore, the soil erosion process has dominated the whole Loess Plateau system (Jiao et al. Citation2012). Sandstorms have become a common natural phenomenon, caused by meteorological factors (including drought, high temperatures, and strong wind) and human factors (including increasing population, poor sense of environmental protection, overcutting of trees, and overgrazing) (Wang et al. Citation2011). The Loess Plateau is located in the arid and semi-arid regions of the middle latitudes. The Loess Plateau is mostly covered by sandy land, sparse grassland, and dry farmland. The plateau has become more easily prone to sandstorms in such areas, where surface vegetative coverage is low and weather conditions are conducive, particularly in spring (Jiao et al. Citation2012). The dust storm process has significantly destroyed the ecosystem, accelerating the land’s desertification (Fan et al. Citation2015). The Loess Plateau is the oldest known area of loess accumulation in the world. However, the development of loess accumulation indicates a general trend toward a dry climate in northern China (Hou et al. Citation2015). Thus, drought is also one of its major ecological problems. In addition, the rainy season in the Loess Plateau is concentrated, making it flood prone owing to frequent rainstorms.
5.3. Conservation implications
The objective of environmental assessment is to assist policy makers and practitioners of environmental protection. Zones of severe ecological vulnerability should receive more attention than others, and appropriate measures such as ‘convert slope farmland into forest or pasture’ should be established and implemented. However, the dominant ecological problems of the Silk Road Economic Belt of China differ greatly. Therefore, different conservation systems should be applied to protect specific regional eco-environments.
First, for the Arid Desert Ecological Region, the shelterbelt and artificial grasslands should be constructed to reduce damage to ecosystems from wind erosion and sandstorms. Second, the oasis should be expanded to optimize the desert ecosystem. In an oasis, owing to expansion of surface irrigation and the enhancement of evapotranspiration, the relative humidity is increased, whereas the maximum surface temperature is decreased (Zhang et al. Citation2008). Therefore, the desert’s water and heat conditions are changed to establish the water and heat balance of the oasis (Deng et al. Citation2008). Third, the efficiency of water resource use should be enhanced to mitigate the water resource deficit over the whole sub-region. Measures, such as construction of regulating reservoirs, diversion pivots, canal seepage controls, and development of shaft irrigation and drainage, can be implemented to reduce the impacts of drought on the agricultural ecosystem (Jin and Wang Citation2016).
For the Alpine Ecological Region, first, the number of livestock should be controlled to maintain the balance of livestock and grass (Yang et al. Citation2004). Excessive grazing has led to extensive degradation of natural grasslands in Qaidam Basin (Liu et al. Citation2006). Second, construction of farmland shelterbelts, windbreak, and sand stabilization forests should be conducted to improve the condition of the regional eco-environment. Third, the organization and management of nature preserves should be strengthened to curb the deterioration of the Three River Source Region.
For the Humid and Semi-humid Region, first, the population size should be controlled, particularly where the ecological load-carrying capacity of the population is small, such as the Loess Plateau. Typical belief states that the population density in the Loess Plateau, which has reached 65 persons/km2, should not exceed 20 persons/km2 (Hou et al. Citation2015); this must be regulated. Second, the reconversion of farmland to forests and grasslands should be implemented in sloping lands to ensure effective vegetation restoration and reconstruction (Li et al. Citation2009). Third, improved water conservation and water use efficiency should be adopted to ease the ecological pressures caused by insufficient water resources.
6. Conclusions
For a comprehensive consideration of the diversity of ecosystems in the Silk Road Economic Belt of China, the partition–integration concept has been introduced herein to assess the ecological vulnerability of the study region. The main conclusions are as follows.
The dominant eco-environmental problems differ greatly over the whole study region, and the relative importance of each factor in three sub-regions is also different. The new assessment model of ecological vulnerability based on the partition–integration concept has strong operational and practical value.
NPP was introduced to help determine the thresholds of ecological vulnerability, which can better ensure accurate comparison and analysis of ecological vulnerability across the three sub-regions.
The spatial patterns of zones at different vulnerability levels differ greatly. The mild vulnerability zone (accounting for 25.9% of total area) was the most widely distributed whereas the zone of slight vulnerability (accounting for 7.3% of total area) covered the smallest area.
Specific environmental protection and treatment measures should be conducted to remedy each of the three sub-region’s different dominant ecological problems.
Disclosure Statement
No potential conflict of interest was reported by the author(s).
Additional information
Funding
Related Research Data
References
- Adriaenssens V, De Baets B, Goethals PLM, Pauw ND. 2004. Fuzzy rule-based models for decision support in ecosystem management. Sci Total Environ. 319(1–3):1–12.
- Amiri V, Rezaei M, Sohrabi N. 2014. Groundwater quality assessment using entropy weighted water quality index (EWQI) in Lenjanat. Iran. Environ Earth Sci. 72(9):3479–3490.
- Beroya-Eitner MA. 2016. Ecological vulnerability indicators. Ecol Indic. 60:329–334.
- Chuvieco E, Martínez S, Roman MV, Hantson S, Pettinari ML. 2014. Integration of ecological and socio-economic factors to assess global vulnerability to wildfire. Global Ecol Biogeogr. 23(2):245–258.
- Deng ZY, Zhang Q, Pu JY, Liu DX, Guo H, Wang QF, Zhao H, Wang HL. 2008. The impact of climate warming on crop planting and production in northwestern China. Acta Ecol Sinica. 28(8):3760–3768.
- Enea M, Salemi G. 2001. Fuzzy approach to the environmental impact evaluation. Ecol Model. 136(2–3):131–147.
- Fan XG, Ma ZG, Yang Q, Han YH, Mahmood R, Zheng ZY. 2015. Land use/land cover changes and regional climate over the Loess Plateau during 2001–2009. Part I: observational evidence. Clim Change. 129(3–4):427–440.
- Farley J, Voinov A. 2016. Economics, socio-ecological resilience and ecosystem services. J Environ Manag. 183(Part 2):389–398.
- Guo B, Zhang FF, Yang G, Sun CH, Han F, Jiang L. 2017. Improved estimation method of soil wind erosion based on remote sensing and geographic information system in the Xinjiang Uygur Autonomous Region, China. Geomat Nat Hazards Risk. 8(2):1752–1767.
- Guo B, Zhou Y, Zhu JF, Liu WL, Wang FT, Wang LT, Yan FL, Wang F, Yang G, Luo W, Jiang L. 2016. Spatial patterns of ecosystem vulnerability changes in Three-River Source Region on the Qinghai-Tibetan Plateau, China. J Arid Land. 8(1):23–35.
- Heltberg R, Siegel PB, Jorgensen SL. 2009. Addressing human vulnerability to climate change: toward a ‘no-regrets’ approach. Global Environ Change. 19(1):89–99.
- Hong W, Jiang R, Yang C, Zhang F, Su M, Liao Q. 2016. Establishing an ecological vulnerability assessment indicator system for spatial recognition and management of ecologically vulnerable areas in highly urbanized regions: a case study of Shenzhen, China. Ecol Indic. 69:540–547.
- Hou K, Li X, Zhang J. 2015. GIS analysis of changes in ecological vulnerability using a SPCA model in the loess plateau of Northern Shaanxi, China. IJERPH. 12(4):4292–4305.
- Jiao JY, Zhang ZG, Bai WJ, Jia YF, Wang N. 2012. Assessing the ecological success of restoration by afforestation on the Chinese Loess Plateau. Restor Ecol. 20(2):240–249.
- Jin J, Wang Q. 2016. Assessing ecological vulnerability in western China based on Time- Integrated NDVI data. J Arid Land. 8(4):533–545.
- Kang H, Tao WD, Chang Y, Zhang Y, Li XX, Chen P. 2018. A feasible method for the division of ecological vulnerability and its driving forces in Southern Shaanxi. J Clean Prod. 205:619–628.
- Li MC, Han S, Shi J. 2017. An enhanced ISODATA algorithm for recognizing multiple electric appliances from the aggregated power consumption dataset. Energy Build. 140:305–316.
- Li Z, Liu W, Zhang X, Zheng F. 2009. Impacts of land use change and climate variability on hydrology in an agricultural catchment on the Loess Plateau of China. J Hydrol. 377(1–2):35–42.
- Li L, Shi ZH, Yin W, Zhu D, Ng SL, Cai CF, Lei AL. 2009. A fuzzy analytic hierarchy process (FAHP) approach to eco-environmental vulnerability assessment for the Danjiangkou reservoir area, China. Ecol Model. 220(23):3439–3447.
- Li AN, Wang AS, Liang SL, Zhou WC. 2006. Eco-environmental vulnerability evaluation in mountainous region using remote sensing and GIS: A case study in the upper reaches of Minjiang River. Ecol Model. 192(1–2):175–187.
- Li ZW, Zeng GM, Zhang H, Yang B, Jiao S. 2007. The integrated eco-environment assessment of the red soil hilly region based on GIS – a case study in Changsha City, China. Ecol Model. 202(3–4):540–546.
- Li XR, Zhang ZS, Tan HJ, Gao YH, Liu LC, Wang XP. 2014. Ecological restoration and recovery in the wind-blown sand hazard areas of Northern China: relationship between soil water and carrying capacity for vegetation in the Tengger Desert. Sci China Life Sci. 57(5):539–548.
- Liang J, Zhong M, Zeng G, Chen G, Hua S, Li X, Yuan Y, Wu H, Gao X. 2017. Risk management for optimal land use planning integrating ecosystem services values: a case study in Changsha, middle China. Sci Total Environ. 579:1675–1682.
- Linder M, Maroschek M, Netherer S, Kremer A, Barbati A, Garcia-Gonzalo J, Seidl R, Delzon S, Coron P, Kolström M, et al. 2010. Climate change impacts, adaptive capacity, and vulnerability of European forest ecosystems. For Ecol Manag. 259(4):698–709.
- Liu YY, Hao Y. 2018. The dynamic links between CO2 emissions, energy consumption and economic development in the countries along the Belt and Road. Sci Total Environ. 645:674–683.
- Liu LS, Zhang YL, Bai WQ, Yan JZ, Ding MJ, Shen ZX, Li SC, Zheng D. 2006. Characteristics of grassland degradation and driving forces in the source region of the Yellow River from 1985 to 2000. J Geogr Sci. 16(2):131–142.
- Mikhailov L, Tsvetinov P. 2004. Evaluation of services using a fuzzy analytic hierarchy process. Appl Soft Comput. 5(1):23–33.
- Nandy S, Singh C, Das KK, Kingma NC, Kushwaha SPS. 2015. Environmental vulnerability assessment of eco-development zone of Great Himalayan National Park, Himachal Pradesh, India. Ecol Indic. 57:182–195.
- Polsky C, Neff R, Yarnal B. 2007. Building comparable global change vulnerability assessments: the vulnerability scoping diagram. Global Environ Change. 17(3–4):472–485.
- Rogers S, Xue T. 2015. Resettlement and climate change vulnerability: evidence from rural China. Global Environ Change. 35:62–69.
- Sahoo S, Dhar A, Kar A. 2016. Environmental vulnerability assessment using Grey Analytic Hierarchy Process based model. Environ Impact Assess Rev. 56:145–154.
- Shao H, Sun X, Tao S, Xiang Z, Xian W. 2015. Environmental vulnerability assessment in middle upper reaches of Dadu River Watershed using Projection Pursuit Model and GIS. Carpathian Int J Earth Environ Sci. 10(4):143–146.
- Shen J, Lu H, Zhang Y, Song X, He L. 2016. Vulnerability assessment of urban ecosystems driven by water resources, human health and atmospheric environment. J Hydrol. 536:457–470.
- Song G, Chen Y, Tian M, Lv S, Zhang S, Liu S. 2010. The ecological vulnerability evaluation in Southwestern mountain region of China based on GIS and AHP method. Procedia Environ Sci. 2(6):465–475.
- Topuz E, van Gestel CAM. 2016. An approach for environmental risk assessment of engineered nanomaterials using Analytical Hierarchy Process (AHP) and fuzzy inference rules. Environ Int. 92-93:334–347.
- Wang S, Fu BJ, He CS, Sun G, Gao GY. 2011. A comparative analysis of forest cover and catchment water yield relationships in northern China. For Ecol Manag. 262(7):1189–1198.
- Wang RY, Zhao GX, Jiang SQ, Wang AL, Wang J. 2008. Spatial-temporal variation of Eco-environment frangibility based on remote sensing and catastrophe theory: a case study of Kenli County in the Yellow River Delta. Chin J Appl Ecol. 8:1782–1788.
- Wang Y, Shao M, Zhu Y, Liu Z. 2011. Impacts of land use and plant characteristics on dried soil layers in different climatic regions on the Loess Plateau of China. Agric For Meteorol. 151(4):437–448.
- Xu LJ, Fan XC, Wang WQ, Lei X, Duan YL, Shi RJ. 2017. Renewable and sustainable energy of Xinjiang and development strategy of node areas in the “Silk Road Economic Belt”. Renew Sustain Energy Rev. 79:274–285.
- Yang M, Wang S, Yao T, Gou X, Lu A, Guo X. 2004. Desertification and its relationship with permafrost degradation in Qinghai-Xizang (Tibet) plateau. Cold Regions Sci Technol. 39(1):47–53.
- Ye ZX, Li WH, Chen YN, Qiu JJ, Aji D. 2017. Investigation of the safety threshold of eco-environmental water demands for the Bosten Lake wetlands, western China. Quat Int. 440(Part B):130–136.
- Zhang Z, Lin L, Liang L. 2008. Climate change and its impacts on agricultural production in Ningxia. J Agric Meteorol. 29(4):402–405.
- Zhang XQ, Wang LK, Fu XS, Li H, Xu CD. 2017. Ecological vulnerability assessment based on PSSR in Yellow River Delta. J Clean Prod. 167:1106–1111.
- Zhang X, Wang Z, Lin J. 2015. GIS based measurement and regulatory zoning of urban ecological vulnerability. Sustainability. 7(8):9924–9942.
- Zhang P, Li J, Yang X, Zhu H. 2018. Semi-automatic extraction of rock discontinuities from point clouds using the ISODATA clustering algorithm and deviation from mean elevation. Int J Rock Mech Mining Sci. 110:76–87.
- Zhou Y, Guo B, Wang SX, Tao HP, Liu WL, Yang G, Zhu JF. 2016. Dynamic monitoring of soil wind erosion in Inner Mongolia of China during 1985–2011 based on geographic information system and remote sensing. Nat Hazards. 83(1):1–17.
- Zhou Y, Ren G. 2011. Change in extreme temperature event frequency over mainland China during 1961–2008. Clim Res. 50(2):125–139.