
 ?Mathematical formulae have been encoded as MathML and are displayed in this HTML version using MathJax in order to improve their display. Uncheck the box to turn MathJax off. This feature requires Javascript. Click on a formula to zoom.
Abstract
Tornadoes rank among the most destructive hazards to human life and property. In the United States, two regions known as Tornado Alley and Dixie Alley are particularly prone to tornadoes, but determining exactly where tornadoes will occur remains difficult. Examining the relationship between land surface heterogeneity (i.e. variations in topography, vegetation, and land cover) and tornado occurrence can provide insight into the spatial distribution of these storms. The objective of this study is to uncover the relationships between severe storm occurrence and land surface heterogeneity variables to determine (1) whether certain land heterogeneity variables exhibit a significant relationship with tornado occurrence, and (2) whether those relationships vary by region and storm strength. We delineate the spatial extent of Tornado Alley and Dixie Alley based on clusters of tornadic activity. We then use logistic regression to investigate how land heterogeneity factors are related to tornado formation of weakly and significantly tornadic storms. Using these relationships uncovered, we map tornado probability across the two regions. Regression results show that several land surface heterogeneity variables have a statistically significant relationship with tornado occurrence, but these relationships vary with region and storm severity, supporting the need for more local studies.
1. Introduction
Tornadoes are among the most destructive natural hazards to human life and property. In the United States, approximately 1253 tornadoes occur every year (NCDC 2017) causing an average of 50 fatalities and $400 million in annual economic losses (Brooks and Doswell Citation2001; Boruff et al. Citation2003; Brooks and Dotzek Citation2008). To improve forecasting and warning, a better understanding of the relationships between environmental factors and the meteorological processes involved in tornadogenesis is needed (Yuan Citation2005). A growing body of research acknowledges there is a relationship between land surface heterogeneity, which refers to the variations in topography, vegetation, and land cover characteristics that combine to produce different environmental conditions (e.g. soil moisture, urban heat island, etc.), and the evolution of mesoscale convective systems (Cheresnick and Basara Citation2005; Holt et al. Citation2006; Niyogi et al. Citation2006; Wu et al. Citation2009; Pielke et al. Citation2011; Bozeman et al. Citation2012; Kellner and Niyogi Citation2014; Pielke et al. Citation2016). However, more research is needed to test whether these relationships are ubiquitous across different geographic regions and environmental conditions.
Pielke et al. (Citation2011) reviewed the biogeophysical impacts of land use and land cover changes (e.g. conversion of forests to cropland) on climate and found that in regions where considerable land use and land cover changes have occurred, there can be major changes to the aerodynamic roughness of the land surface, which in turn can affect local climate conditions (Betts et al. Citation1996; Pitman et al. Citation2009). Aguirre et al. (Citation1993) also noted the relationships between human-driven ecological patterns and an increase in the frequency and magnitude of other natural disasters (e.g. floods, drought, etc.). The authors were able to link those changes to tornadoes. More recently, Pielke et al. (Citation2016) described how regional weather patterns are a function of land cover; and, in a study explicitly testing the role of land surface heterogeneity on tornado climatology, Kellner and Niyogi (Citation2014) found spatial relationships between tornado formation locations and surface roughness as measured through elevation changes and land cover in Indiana. Altogether, these studies suggest that differences in land surface heterogeneity may explain some of the geographical variation in tornado formation. While it remains extremely difficult to predict exactly where a tornado will form (Brotzge et al. Citation2011), determining the relationship between land surface heterogeneity and tornado occurrence from climate data remains an important factor for reducing risk (Brooks et al. Citation2003; Dixon et al. Citation2011).
In the U.S., a considerable number of tornadoes form in the region known as Tornado Alley (Dixon et al. Citation2011), which is loosely defined as stretching from Texas north through Oklahoma, Kansas, and Nebraska (although the exact geographic extent is debated in the literature [Gagan et al. Citation2010]). A second area of high incidence, termed Dixie Alley (Gagan et al. Citation2010; Dixon et al. Citation2011), stretches across the Delta region of the United States and is generally considered to include Louisiana, Mississippi, and Alabama (Brooks et al. Citation2003). While the extent of both Tornado Alley and Dixie Alley have been delineated differently in the literature according to different methods (see Gagan et al. Citation2010 for a review), it is generally agreed that there are observable differences in the number of violent tornadoes affecting the two general regions, both in terms of the seasonality of tornado occurrences as well as the time of day when tornadoes are most likely to occur. For example, Gagan et al. (Citation2010) found that severe tornadoes are more likely to form in Tornado Alley during the period April through October, while in Dixie Alley, severe tornadoes are more likely during the opposite months. Tornado Alley also experiences most strong tornadoes during the afternoon and early evening hours, whereas Dixie Alley experiences more tornadoes during the late night and early morning hours. These diurnal differences may in turn affect fatalities, since tornado-related deaths are concentrated more in the southeastern United States (Ashley Citation2007; Sutter and Simmons Citation2010). While some research has focussed on understanding the differences between the two regions in terms of their distinctive tornadic characteristics (Gagan et al. Citation2010), a better understanding of the driving forces behind these differences is needed to improve forecasting and warning.
The objective of this study is to uncover the relationships between tornado occurrence and land surface heterogeneity characteristics across Tornado Alley and Dixie Alley to determine (1) if there are statistically significant relationships between tornado occurrences and certain land surface heterogeneity variables, and (2) whether these relationships vary across regions and with storm strength. We first delineate the spatial extent of Tornado Alley and Dixie Alley based on tornado occurrences using an established statistical test for the detection of clusters of spatial association. These extents are not meant to supplant pre-existing conceptualizations of the two regions but rather provide a statistically relevant and spatially explicit area from which to undertake a systematic investigation in the two regions. Next, using locations of tornadoes as well as severe storms that produced wind/hail (but not tornadoes), we investigate how land surface heterogeneity factors (as measured through environmental and topographic variables) are related to tornado occurrence in each region using binary logistic regression. Based on the literature, we hypothesize that areas characterized by flatter topography and east-facing slopes closer to river beds will have greater odds of tornadoes than areas characterized by steeper topography with west-facing slopes further from rivers. We also hypothesize that urban and developed areas will experience greater odds of tornado occurrence compared to non-urbanized areas. As part of our objectives, we also map the results from our logistic analysis to visually compare the spatial trends of tornado occurrence probability in each region. Our aim is to derive useful information that can aid in identifying vulnerable geographic locations and ultimately inform risk assessment, the dissemination of warning information, and the development and placement of warning infrastructure (e.g. tornado sirens).
2. Data and preprocessing methods
2.1. Study area delineation
To define the study region, we delineate the spatial extent of Tornado Alley and Dixie Alley based on actual tornado counts using the Getis-Ord generalized (local) statistic, which is an established statistical test for the detection of clusters of significant spatial association. Getis-Ord
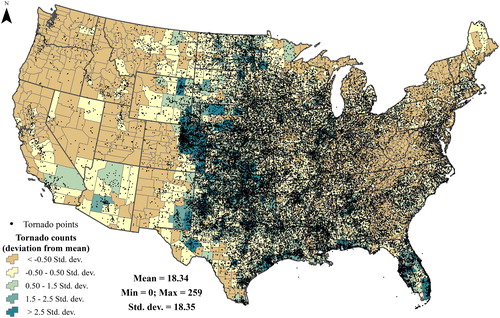
is used to identify ‘hot spots’ (Besag and Newell Citation1991; Ord and Getis Citation1995) where there is a raised incidence of a phenomenon in an area or location of interest (Ord and Getis Citation1995). We use counties as the unit of analysis (i.e. geographic neighborhood) and aggregate tornado counts from the National Weather Service (NWS) Storm Prediction Centre within each county to serve as the occurrence variable (). While counties represent human-defined administrative boundaries as opposed to natural boundaries, NWS forecasting regions follow county boundaries, and they are also the administrative unit for providing disaster-related services to the population (Wright et al. Citation1979), making them appropriate for delineation of tornado regions.
Figure 1. Tornado counts in the contiguous United States for storms occurring between 1950 and 2015. Counts have been aggregated per county and symbolized showing standard deviation from the mean. Source: Author
The Getis–Ord generalized (local) statistic (Getis and Ord Citation2010; Ord and Getis Citation1995) is computed as
(1)
(1)
where
is a symmetric 1/0 spatial weights matrix with 1 for all links defined as being within a distance
of a given target region,
All other links are set to 0. In the standardized version of the statistic used here, the target region i is included in the computation of the statistic. Therefore,
The variables
and
are the sample mean and standard deviation of the observed set of
respectively.
will produce high values and a high positive z-score when there is a dominant pattern of high values near other high values, and will produce low values when there is clustering of low values (Rogerson and Yamada Citation2008).
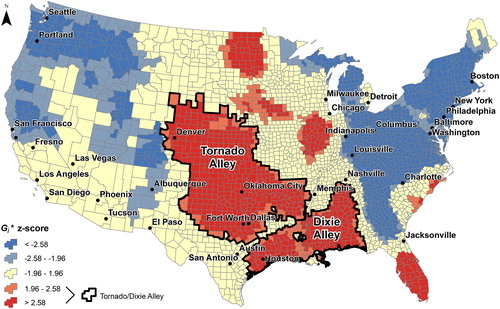
Mapping results show a large cluster of highly significant (z-score ≥ 1.96) counties stretching from Denver across eastern Colorado, north into Wyoming, through Nebraska, Kansas, Oklahoma, Arkansas, and down into northern Texas (). This cluster, which we define as ‘Tornado Alley’, is visually distinct from the clusters of high values in Illinois and Iowa/South Dakota/Minnesota but is connected to the cluster of high values along the southeast border of Arkansas and northeast border of Louisiana. Prior research has suggested the two regions are connected (Dixon et al. Citation2011; Concannon et al. Citation2000), but, in order to undertake separate analyses of Tornado Alley and Dixie Alley, we split the two regions at this point (). The cluster detection analysis also identified clusters of high tornadic activity in Illinois, Iowa, North Dakota/northwestern Minnesota, Florida, and the Carolina coast, which may be useful for future studies but were not analyzed in this study. Counties that appear as ‘donut holes’ in Tornado and Dixie Alley () had statistically fewer tornadoes than the surrounding counties and therefore were not part of the cluster. It should be noted that our delineation generates spatially explicit boundaries for each region that permit systematic statistical comparisons; any definitive areas referenced in this article are the authors’ interpretation based on the statistical analyses performed here.
Figure 2. Getis-Ord hotspot results and z-scores for tornado occurrences at the county level. Tornado Alley and Dixie Alley are delineated based on 95% confidence bounds. Source: Author.
2.2. Severe weather data
Logistic regression – which is the statistical technique we employ to investigate the relationships between land surface heterogeneity characteristics and tornado occurrences (discussed below) – uses a nonlinear function to explain the probability of tornado occurrence where the dependent variable takes on the value of either 0 or 1 based on whether or not a severe storm produced a tornado. The dependent variable includes severe weather events that occurred between 2001 and 2015, obtained from the NWS Storm Prediction Centre in GIS file format. We separate those storms into tornado-producing events (coded 1) and severe storms that produced wind/hail but did not produce a tornado (coded 0). We only examined storms during the 15-year period from 2001 to 2015 to align with the land cover explanatory variables (discussed below). To ensure independence between the two sets of storms comprising the dependent variable, we removed any duplicate entries. We further divided the subset of tornado-producing storms into weakly tornadic supercells (EF0 and EF1) and significantly tornadic supercells (EF2 or greater) based on other studies using a similar typology (Concannon et al. Citation2000; Thompson et al. Citation2003, Citation2007; Coleman and Dixon Citation2014). In the analysis portion (discussed below), we run two, separate logistic regression analyses. The first analysis includes weakly tornadic storms (1) and non-tornado producing storms (0) as the dependent variable. The second analysis includes significantly tornadic storms (1) and all non-tornado producing storms (0) as the dependent variable. Independent variables are discussed in the following section. A summary of the number of storms per region is shown in .
Table 1. Observation totals for severe storms in Tornado Alley and Dixie Alley (2001–2015).
2.3. Land surface heterogeneity data
We test the explanatory power of five different land surface heterogeneity variables on tornado occurrence across Tornado Alley and Dixie Alley and examine the relationships of these variables with tornado occurrence across the two regions. The five variables include three topographic variables (elevation, slope, and aspect) as well as distance to rivers and land cover. These variables are discussed below. In all cases, the raster values for each explanatory variable were extracted to each storm point – both tornadic and non-tornadic wind/hail – to produce a database of storm locations with accompanying land cover variables. We isolated the starting point for each storm as the location of interest.
2.3.1. Topographic variables
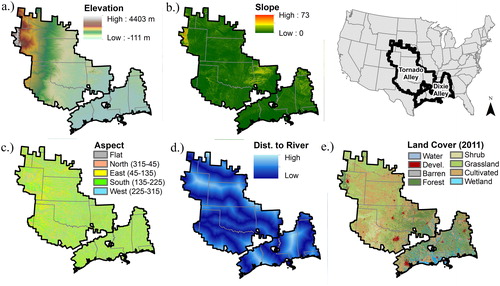
We included three topographic variables for analysis: elevation, slope, and aspect (). Previous studies have included elevation and slope in tornado land surface heterogeneity studies (e.g. Kellner and Niyogi Citation2014), but the role of aspect (i.e. slope direction) has not yet been investigated. Since tornadoes typically have path directions oriented in a southwest-northeast direction (Thom Citation1963), we hypothesize that slope direction may be related to tornado occurrence, with greater occurrences on east-facing slopes. All three topographic variables were derived from a digital elevation model (DEM) obtained from the United States Geologic Survey (USGS) 3 D Elevation Program (3DEP) at a spatial resolution of 1 arc second (). The DEM was resampled to 90 m to improve processing, but this resampling is not expected to have a large impact on overall results. Slope and aspect are derivatives of elevation and were computed directly from the DEM using the spatial analysis tools in ArcGIS. Slope is the maximum rate of change (i.e. steepest downhill direction) and is reported in degrees. Aspect is the direction of maximum slope measured clockwise from 0 degrees (due north) to 360 degrees (also due north) with flat areas given a value of –1. Aspect data were reclassified into five categories for analysis: Flat, North (315-45 degrees), East (45-135 degrees), South (135-225 degrees), and West (225-315 degrees).
Figure 3. Land surface heterogeneity variables for Tornado Alley and Dixie Alley: (a) elevation, (b) slope, (c) aspect, (d) distance to major rivers, and (e) land cover (Devel. = Developed). Source: Author
2.3.2. Distance to major Rivers
Research has suggested that the channelling of wind through valleys may increase wind speeds, thereby supporting tornadogenesis (Bosart et al. Citation2004; Coleman Citation2010). Since rivers are often located in valleys, we hypothesize that tornado probabilities will be higher in areas closer to major rivers. Major rivers were acquired from the USGS’s National Hydrography Dataset (NHD), and the distance of each storm point to the nearest major river was computed based on Euclidean distance ().
2.3.3. Land cover
Early tornado studies (Finley Citation1884) noted the importance of ground cover on tornado paths, and studies continue to link land cover with tornado formation (Dessens Citation1972; Diamond and Wilkins Citation1984; Clark and Arritt Citation1995; Kellner and Niyogi Citation2014). Land cover investigations present a challenge for tornado-related research since detailed land cover maps have only become available in recent decades. In the U.S., land cover datasets are available from the Multi-Resolution Land Cover Consortium (MRLC) starting in 1992. However, data prior to 2001 are not compatible for direct comparison with more recent products, so we limited our study to the period 2001–2015 in order to utilize the three most recent national land cover database (NLCD) datasets from 2001, 2006, to 2011. NLCD land cover categories were reclassified into the eight parent classes: Water, Developed (Urban), Barren, Forest, Shrubland, Grassland, Agriculture, and Wetlands (). Because land covers can change with time, we assigned storms occurring between 2001 and 2005 land cover values according to the 2001 version of the NLCD, storms occurring between 2006 and 2011 values according to the 2006 version, and storms occurring between 2011 and 2015 values according to the 2011 version.
3. Analytical methods
We implement binary logistic regression to analyze the impact of each land surface heterogeneity variable on tornado occurrence. Logistic regression uses a nonlinear function to explain the probability of tornado occurrence where the dependent variable is whether or not a severe storm formed a tornado (1 or 0, respectively, for the storm dataset), and this outcome is influenced by a vector of the five land surface heterogeneity variables. The dependent variable takes the value 1 if the storm produced a tornado (EF0-EF1 or EF2-EF5, depending on the dataset) and 0 if the severe storm did not produce a tornado. In logistic regression, the statistical significance of the coefficients indicates whether the corresponding explanatory variable is significantly related to the dependent variable. The odds ratio can be interpreted in the context of the impact of each variable on the probability of tornado occurrence. When the odds ratio for a particular variable is greater than 1, an increase in the variable of one unit will increase the odds of tornado occurrence by the amount of the odds ratio. When the odds ratio for a variable is less than one, an increase in the explanatory variable by one unit leads to a decrease in the odds of tornado occurrence. If the odds ratio is exactly one, the odds of tornado occurrence do not change as that particular variable changes. The exponent of a coefficient is the odds ratio; therefore, the probability of tornado formation can be determined through the following equation:
(2)
(2)
Logistic regression has been used extensively for predicting hazards (Ohlmacher and Davis Citation2003; Gascón et al. Citation2015) due to its ability to identify the degree of influence of all independent variables. It has also recently been used to investigate the influence of the El Nino/Southern Oscillation on tornado and hail frequency in the U.S. (Allen et al. Citation2015). Here, we use the binary case of logistic regression to investigate the influence of land surface heterogeneity on tornado occurrence. Since logistic regression investigates the impact of one unit change in the independent variable on the probability of encountering the dependent variable, we scaled the elevation variable by 100 so that we can assess the impact of every 100 m change in elevation. We scaled the distance to river variable by 1000 m to create similarly meaningful units for interpretation, and we rounded slope to the nearest degree so every degree equals a one-unit change. Additionally, the two categorical variables (aspect and land cover) must identify a reference category for comparison. In this case, we selected cultivated land (e.g. agricultural areas) as the reference land cover category and west-facing slopes as the reference category for aspect. All other categories will be compared against these values, respectively, for determining the odds ratios. The odds ratios represent the change in odds of the outcome being a particular category versus the reference category.
4. Results and discussion
4.1. Weakly tornadic storms
Based on the logistic regression results, the following variables were found to be significant predictors of weakly tornadic storms (EF0-EF1) in both regions: elevation and distance to rivers along with three land covers – developed, forest, and wetlands. However, the directionality of these relationships was not consistent across the two regions. In Tornado Alley, an increase in elevation of one unit (100 m) led to a small yet significant increase in tornado occurrence of 1.8%, as shown by the odds ratio value of 1.018 (). In contrast, a one-unit increase in elevation in Dixie Alley significantly decreased weak tornado occurrence by 25.8% (odds ratio = 0.742). This finding that weakly tornadic storms are more likely to occur in higher elevations in Tornado Alley but lower elevations in Dixie Alley demonstrates that land surface heterogeneity can have differential effects in different regions, supporting the need for local/regional analyses and comparisons.
Table 2. Logistic regression results for weakly tornadic supercells (EF0-EF1) in Tornado Alley versus Dixie Alley.
Distance to river was also a significant predictor in both regions, but again the directionality of the relationship was different in the two regions. In Tornado Alley, the odds of tornado occurrence decreased by about 1% as distance from a major river increased by one unit (), which supports prior hypotheses that tornadoes are more likely to form in riverbeds where winds can be channelled. However, in Dixie Alley, the odds of tornado occurrence increased by 3.5% as distance from a major river increased (). Aspect did not show any strong trends; however, south-facing slopes were associated with a small but significant decrease in tornadoes in Tornado Alley. To summarize, in Tornado Alley, where there is greater topographic heterogeneity (), tornado odds are greater for areas with high elevations, steep slopes, and near rivers. Contrary, in the less topographically heterogeneous Dixie Alley, tornado odds are greater in low elevations and further from rivers. Thus, any effects due to wind channelling on tornadogenesis (Bosart et al. Citation2004; Coleman Citation2010) appear to be more pronounced in Tornado Alley.
Regarding the influence of land covers, results were consistent across the two regions. In both regions, the probability of tornado occurrence significantly decreased in developed areas, forests, and wetlands when compared to the reference category (cultivated). The extremely low odds ratios for developed areas in both regions (0.225 and 0.454, for Tornado and Dixie alleys, respectively) is particularly notable since prior studies have suggested that tornado frequencies may be greater in urban areas (Aguirre et al. Citation1993; Kellner and Niyogi Citation2014). Urban and developed land covers are known to increase the direct heating of the lower atmosphere (Pielke et al. Citation2011) and have been linked to enhanced thunderstorm activity (Chen et al. Citation2007). However, our analysis using NLCD land cover data indicated there was no increase in tornado formation for weakly tornadic supercells in developed areas compared to the reference land cover. These results may partially be explained by Niyogi et al. (Citation2011) who found that storms may diverge, or split, when passing over urban areas, which may lead to fewer relative tornado touchdown events in the actual developed areas. Similar research has also found that hotter areas over cities suppressed development of tornadoes (Changnon Citation1978; Elsom and Meaden Citation1982). Our results show a clear negative relationship between developed land and tornado occurrences. However, it should be noted that there may be indirect or spatial lag effects occurring that are not captured through this analysis. In other words, the effects of land cover may affect tornado occurrence at a distance from the measured area.
Forested areas were associated with a decreased probability of tornadoes in both regions. Forests have a darker albedo and increased surface roughness (i.e. texture) compared to cultivated land, and therefore reflect less electromagnetic radiation. This reduction in reflectance results in a higher atmospheric boundary layer and higher sensible heat flux (lower latent heat flux) over wooded areas compared to cultivated lands (Lyons et al. Citation1993). Hence, with these conditions, tornadoes are less likely to form, resulting in a decreased likelihood of tornado occurrence over forested areas, which is supported by our regression findings in both regions. The significant decrease in tornado probabilities over wetland areas for both regions may also warrant a similar explanation with vegetated areas absorbing more of the incoming radiation and decreasing the likelihood for tornadoes.
In summary, the results of the logistic regression analysis for weakly tornadic storms (EF0-EF1) highlight several key findings. First, elevation and distance to rivers were significant predictors in both regions, but the magnitude and directionality of the relationships was not consistent. These disparities suggest that while these aspects of land surface heterogeneity may play a role in tornado formation, impacts may need to be measured locally. With respect to land cover, the low odds ratios for developed areas, forests, and wetlands suggest these land covers may contribute to a decreased likelihood for tornadoes compared to cultivated areas (the reference class). The consistency in terms of directionality of the relationship across both regions provides evidence that there may be a link between land surface heterogeneity and tornado occurrence for weakly tornadic storms.
4.2. Significantly tornadic storms
For the significantly tornadic storms (EF2-EF5), the results are also interesting in terms of the magnitude and direction of the significant predictors between regions. While elevation was no longer a significant predictor in Dixie Alley, it remained significant in Tornado Alley. However, the directionality of the relationship was opposite the relationship found for the EF0-EF1 tornadoes: increasing elevation decreased the probability of significantly tornadic storms in Tornado Alley (). The highest elevations in Tornado Alley are located along the western edge of the region in the Colorado Plateau. This area experiences many weakly tornadic supercells (see ) but not as many significantly tornadic supercells, which may be driving this relationship.
Table 3. Logistic regression results for significantly tornadic supercells (EF2-EF5).
For the significantly tornadic storms, steeper slopes increased the probability of tornadoes in both regions, which might suggest that less steep areas would be more prone to tornado occurrence. However, we found an increase in slope increased the probability of tornado occurrence for weaker storms in Tornado Alley () and for significantly tornadic storms in both Tornado and Dixie Alleys (). Since slopes can play a role in creating updrafts through lifting of the air, it is possible there is a mechanistic explanation for the increase in tornado occurrences over steeper terrain.
Distance to river remained a significant predictor in Dixie Alley with the probability of tornado formation decreasing with distance from a major river. In Dixie Alley, the relationship between slopes and tornado odds may indirectly also support the formation of valleys through which wind may be channelled, possibly leading to increased probabilities of significant tornado formation closer to rivers. In Tornado Alley, distance to river was insignificant for significantly tornadic storm.
Once again, the probability of tornado occurrence significantly decreased in developed areas in both regions compared to the reference category (cultivated). However, forested lands were no longer a significant predictor in either region. Wetlands were only a significant predictor in Tornado Alley, and the directionality of the relationship was opposite that for the weakly tornadic storms, with wetlands increasing the probability of strong tornado formation.
Several relationships that were not significant in the model are nonetheless interesting for understanding differences between Tornado Alley and Dixie Alley as some have been mentioned in prior studies. First, our hypothesis that flat areas (with respect to aspect) would experience an increased probability of tornadoes was true in Tornado Alley (odds ratio = 2.488) but not in Dixie Alley. The high standard error in Dixie Alley (253.0) suggests that the mean is not reliable, which may be due to a lack of truly flat areas in this region as there were only 55 total instances of storms in flat areas (out of 28,906 total storms). The low numbers bias may also be causing the high standard error for the Barren land cover in Dixie Alley where there were only 102 instances (). Water also showed contrasting (but not significant) relationships between the two regions with an odds ratio below one in Tornado Alley and above one in Dixie Alley. This dichotomy may be due to the presence of more water in Dixie Alley compared to Tornado Alley.
More generally though, the findings from the regression analyses provide some key insights into the role of land surface heterogeneity on tornado formation. First, several relationships were consistent and significant across both regions and all storm types. Specifically, the ratio of storms forming in urban areas was significantly reduced compared to cultivated land in all instances; but as stated previously, this analysis did not analyze indirect influences or spatial lags, which is an area for future consideration. Despite the strong northeasterly directional inclinations of tornado paths, aspect (as compared to the west-facing reference class) was not a significant predictor. Lastly, several variables showed contrasting relationships between the two regions, which suggests that land surface heterogeneity may have local impacts that need to be investigated at finer scales.
4.3. Probability maps
To visualize the results, tornado probabilities for each cell in the landscape (90 m resolution) were computed using the β coefficients computed from EquationEq. 2(2)
(2) ( and ) applied to explanatory variable rasters. The set of variables was then combined using map algebra (Esri 2011) to produce a prediction surface of both weakly tornadic and significantly tornadic storms across the two study areas (). Several interesting patterns emerge. In Tornado Alley, the highest probabilities of weakly tornadic storms are found in the western part of the region, with probabilities decreasing from west to east. However, for the significantly tornadic storms (), probabilities are highest in the eastern part of the region, notably in Arkansas and southeastern Oklahoma. These patterns correlate with the elevation gradient, which decreases from west to east across the region. For Dixie Alley, the trends are not as visually obvious as in Tornado Alley, but there are clear differences in the spatial distribution of probabilities for weak versus significantly tornadic storms. Probabilities of weak storms () are slightly higher in the western portion of the region, with several small pockets of very high probabilities along the Gulf Coast (areas in red). The probability surfaces for significantly tornadic storms () show a slight gradient of increasing probability from west to east, but the patterns are not as clear as those in Tornado Alley ().
Figure 4. Tornado probability surfaces based on logistic regression coefficients. Please note scales are different between maps to allow visualization of variation. Source: Author
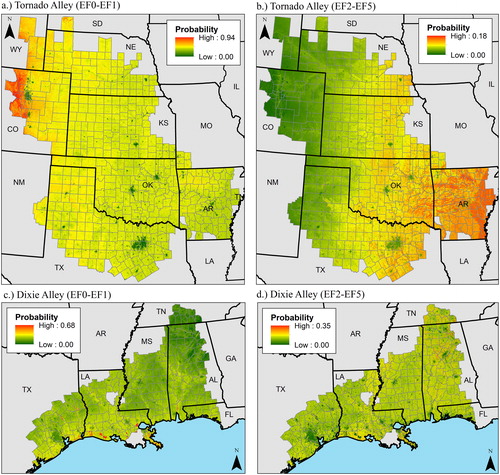
These mapped results help explicate the differential challenges of tornado forecasting and prediction between the two regions. For example, Gagan et al. (Citation2010) noted diurnal differences between the two regions, with strong tornadoes more likely to form during the afternoon and early evening hours in Tornado Alley versus the late night and early morning hours in Dixie Alley. These differences complicate warning for tornadoes in the southeastern U.S. where they occur more often after dark and cannot be as easily spotted. Similarly, the probability patterns show much clearer patterns resulting from land surface heterogeneity in Tornado Alley compared to Dixie Alley. While more research is needed to identify a full set of locally significant predictor variables in each region, these initial results suggest that land surface heterogeneity influences may be more complex in Dixie Alley, which is why it is important to understand local effects prior to implementing any results into forecasting and warning systems.
4.4. Considerations for ongoing and future studies
This study presents several considerations for future research. First, some uncertainty and error exist in the spatial locations of tornado data provided by the NWS. The 90 m spatial resolution of the four terrain variables (elevation, slope, aspect, distance to rivers) minimizes some of this uncertainty, but the land cover datasets from MRLC are generated at a nominal 30 m spatial resolution, and since land cover is categorical, it cannot easily be aggregated to coarser resolutions. However, moderately high spatial and temporal resolution satellite imagery have been available since well before the start date of this study, and these ancillary datasets are frequently used to verify touchdown locations, which can increase positional accuracy.
Second, the Getis-Ord statistical test for the detection of clusters identified counties in the United States with high tornado activity surrounded by other counties with high activity. Sampling biases can occur when the probability of observing a particular phenomenon (in this case, tornadoes) depends on the shape and size of the geographic area (counties). These biases were reduced by ensuring that every county was analyzed with at least one neighbour, and larger counties primarily occur in western states where tornado activity is reduced. Edge effects can also occur for areas that do not have physical neighbours (e.g. counties along the coast), but since most of the tornado activity in the United States occurs inland (Goliger and Milford Citation1998), edge effects are limited.
Lastly, the Fujita and Enhanced Fujita scales used to assign magnitude values to tornadoes are damage-rating systems, not intensity-rating systems (Farney and Dixon Citation2015). While damage and intensity are highly correlated, there can be differences in magnitude depending on the environment through which the tornado passed. For example, tornadoes in urban areas are more likely to obtain higher F-scale (or EF-scale) ratings than rural areas because the potential for damage is greater (Doswell and Burgess Citation1988). Aside from the lowest magnitude tornadoes, we did not find significant differences between different magnitudes for the environmental and land cover variables, so this discrepancy is not likely impacting our analysis disproportionately.
5. Conclusions
In this study, we investigated the relationships between severe storm occurrence and land surface heterogeneity across two tornado-prone regions of the U.S. – Tornado Alley and Dixie Alley – to determine (1) if there is a statistically significant relationship between tornado occurrence and land heterogeneity variables, and (2) whether those relationships vary across the two regions and also according to the strength of the storm. We first delineated the spatial extent of Tornado Alley and Dixie Alley based on tornadic activity using a statistical test for the detection of significant clusters of spatial association and then used binary logistic regression to investigate how land surface heterogeneity factors were related to tornado formation of weakly tornadic storms (EF0-EF1) and significantly tornadic storms (EF2-EF5).
The only variable that consistently predicted tornado occurrence across regions and storm types was the developed land cover class. This variable was consistently related to a decrease in the probability of tornadoes. Other variables that showed significant relationships with tornado occurrence included elevation, slope, and the land covers forest and wetlands. However, the directionality and magnitude of these relationships varied by region and storm type, which highlights the need for local investigations of land surface heterogeneity influences on tornado probabilities. The results of this study are not intended to pinpoint locations where tornadoes will form but are meant to contribute to the growing body of research seeking to improve our understanding of when and where tornadoes form. Ultimately, this information can aid scientists in developing more accurate warning systems with increased information to reduce false alarms and provide adequate lead times for sheltering.
Acknowledgments
The authors would like to thank the editor and anonymous reviewers for providing thorough and helpful comments that improved the manuscript.
Disclosure statement
No potential conflict of interest was reported by the authors.
Additional information
Funding
Related Research Data
References
- Aguirre BE, Saenz R, Edmiston J, Yang N, Agramonte E, Stuart DL. 1993. The human ecology of tornadoes. Demography. 30:623–633.
- Allen JT, Tippett MK, Sobel AH. 2015. Influence of the El nino/southern oscillation on tornado and hail frequency in the United States. Nat Geosci. 8(4):278–283.
- Ashley WS. 2007. Spatial and temporal analysis of tornado facilities in the United States: 1880–2005. Wea Forecasting. 22(6):1214–1228.
- Besag J, Newell J. 1991. The detection of clusters in rare diseases. J Roy Stat Soc A. 154(1):143–155.
- Betts AK, Ball JH, Beljaars ACM, Miller MJ, Viterbo P. 1996. The land-surface-atmosphere interaction: a review based on observational and global modeling perspectives. J Geophys Res. 101:7208–7225.
- Boruff BJ, Easoz JA, Jones SD, Landry HR, Mitchem JD, Cutter SL. 2003. Tornado hazards in the United States. Clim Res. 24:103–117.
- Bosart LF, LaPenta K, Seimon A, Dickinson M, Galarneau TG Jr. 2004. Terrain-influenced tornadogenesis in the northeastern United States. Preprints, 11th Conference on Mountain Meteorology and the Annual Mesoscale Alpine Program (MAP), Bartlett, NH, Amer Meteorol Soc P17.3. [Available online at https://ams.confex.com/ams/pdfpapers/77126.pdf.]
- Bozeman ML, Niyogi D, Gopalakrishnan S, Marks FD Jr, Zhang X, Tallapragada V. 2012. An HWRF-based ensemble assessment of the land surface feedback on the post-landfall intensification of Tropical Storm Fay (2008). Nat Hazards. 63:1543–1571.
- Brooks HE, Dotzek N. 2008. The spatial distribution of severe convective storms and an analysis of their secular changes. Climate Extremes Soc. 35:53.
- Brooks HE, Doswell CA. 2001. Normalized damage from major tornadoes in the United States: 1890–1999. Wea Forecasting. 16(1):168–176.
- Brooks HE, Lee JW, Craven JP. 2003. The spatial distribution of severe thunderstorm and tornado environments from global reanalysis data. Atmos Res. 67:73–94.
- Brotzge J, Erickson S, Brooks H. 2011. A 5-yr climatology of tornado false alarms. Wea Forecasting. 26(4):534–544.
- Changnon SA. 1978. Urban effects on severe local storms. J Appl Meteorol. 17(5):578–586.
- Chen TC, Wang SY, Yen MC. 2007. Enhancement of afternoon thunderstorm activity by urbanization in a valley: Taipei. J Appl Meteorol Climatol. 46(9):1324–1340.
- Cheresnick DR, Basara JB. 2005. The impact of land-atmosphere interactions on the Benson, MN tornado of 11 June 2011. Bull Amer Meteorol Soc. 86(5):637–642.
- Clark C, Arritt R. 1995. Numerical simulations of the effect of soil moisture and vegetation cover on the development of deep convection. J Appl Meteorol. 34(9):2029–2045.
- Coleman TA. 2010. The effects of topography and friction on mesocyclones and tornadoes. Preprints, 25th Conference on Severe Local Storms; Denver, CO: Amer Meteorol Soc. P8.12.
- Coleman TA, Dixon PG. 2014. An objective analysis of tornado risk in the United States. Wea Forecasting. 29(2):366–376.
- Concannon PR, Brooks HE, Doswell Iii CA. 2000. Climatological risk of strong and violent tornadoes in the United States. Preprints, Second Symposium on Env App; Long Beach, CA: Amer Meterol Soc. 9.4.
- Dixon GP, Mercer AE, Choi J, Allen JS. 2011. Tornado risk analysis: is Dixie Alley an extension of Tornado Alley?. Bull Amer Meteorol Soc. 92(4):433–441.
- Dessens J. Jr 1972. Influence of ground roughness on tornadoes: a laboratory simulation. J Appl Meteorol. 11(1):72–75.
- Diamond CJ, Wilkins EM. 1984. Translation effects on simulation tornadoes. J Atmos Sci. 41(17):2574–2580.
- Doswell CA, III, Burgess DW. 1988. On some issues of United States tornado climatology. Mon Wea Rev . 116(2):495–501.
- Elsom DM, Meaden GT. 1982. Suppression and dissipation of weak tornadoes in metropolitan areas: A case study of greater London. Mon Wea Rev. 110(7):745–756.
- Esri 2011. ArcGIS Desktop: Release 10. Readlands, CA: Environmental Systems Research Institute.
- Farney TJ, Dixon PG. 2015. Variability of tornado climatology across the continental United States. Int J Climatol. 35(10):2993–3006.
- Finley JP. 1884. Report on the character of six hundred tornadoes. Prof Papers Sig Serv No VII; Washington, DC: US Signal Service.
- Gagan JP, Gerard A, Gordon J. 2010. A historical and statistical comparison of “Tornado Alley” to “Dixie Alley. Natl Wea Dig. 34(2):145–155.
- Gascón E, Merino A, Sánchez JL, Fernández-González S, García-Ortega E, López L, et al. 2015. Spatial distribution of thermodynamic conditions of severe storms in southwestern Europe. Atmos Res. 164:194–209.
- Getis A. and Ord J. K., 2010. The analysis of spatial association by use of distance statistics. In Perspectives on Spatial Data Analysis (pp. 127–145). Springer, Berlin, Heidelberg.
- Goliger AM, Milford RV. 1998. A review of worldwide occurrence of tornadoes. J Wind Eng Ind Aerodyn. 74–76:111–121.
- Holt T, Niyogi D, Chen F, LeMone MA, Manning K, Qureshi AL. 2006. Effect of land–atmosphere interactions on the IHOP 24–25 May 2002 convection case. Mon Wea Rev. 134(1):113–133.
- Kellner O, Niyogi D. 2014. Land surface heterogeneity signature in tornado climatology? An illustrative analysis over Indiana, 1950–2012. Earth Interact. 18(10):1–32.
- Lyons TJ, Schwerdtfeger P, Hacker JM, Foster IJ, Smith RCG, Huang X. 1993. Land–atmosphere interaction in a semiarid region: the bunny fence experiment. Bull Amer Meteorol Soc. 74(7):1327–1334.
- National Climatic Data Center 2017. U.S. Tornado Climatology. National Oceanic and Amospheric Association (NOAA) Available online at: https://www.ncdc.noaa.gov/climate-information/extreme-events/us-tornado-climatology
- Niyogi D, Holt T, Zhong S, Pyle PC, Basara J. 2006. Urban and land surface effects on the 30 July 2003 mesoscale convective system event observed in the southern Great Plains. J Geophys Res. 111:D19107.
- Niyogi D, Pyle P, Lei M, Arya SP, Kishtawal CM, Shepherd M, Chen F, Wolfe B. 2011. Urban modification of thunderstorms: an observational storm climatology and model case study for the Indianapolis urban region. J Appl Meteorol Climatol. 50(5):1129–1144.
- Ohlmacher GC, Davis JC. 2003. Using multiple logistic regression and GIS technology to predict landslide hazard in northeast Kansas, USA. Eng Geol. 69(3–4):331–343.
- Ord J. K. and Getis A. 1995. Local spatial autocorrelation statistics: distributional issues and an application. Geographical analysis, 27(4), pp. 286–306.
- Pielke RA, SrPitman A, Niyogi D, Mahmood R, McAlpine C, et al. 2011. Land use/land cover changes and climate: modeling analysis and observational evidence. Wires Clim Change. 2:828–850.
- Pielke RA Sr, Mahmood R, McAlpine C. 2016. Land’s complex role in climate change. Phys Today. 69(11):40–46.
- Pitman AJ, de Noblet-Decoudre N, Cruz FT, Davin EL, Bonan GB, Brovkin V, Claussen M, Delire C, Ganzeveld L, Gayler V, et al. 2009. Uncertainties in climate responses to past land cover change: first results from the LUCID intercomparision study. Geophys Res Lett. 36:L14814.
- Rogerson P, Yamada I. 2008. Statistical detection and surveillance of geographic clusters. Boca Raton, FL: CRC Press.
- Sutter D, Simmons KM. 2010. Tornado fatalities and mobile homes in the United States. Nat Hazards. 53(1):125–137.
- Thom HCS. 1963. Tornado probabilities. Mon Wea Rev. 91(10):730–736.
- Thompson RL, Edwards R, Hart JA, Elmore KL, Markowski P. 2003. Close proximity soundings within supercell environments obtained from the rapid update cycle. Wea Forecasting. 18(6):1243–1261.
- Thompson RL, Mead CM, Edwards R. 2007. Effective storm-relative helicity and bulk shear in supercell thunderstorm environments. Wea Forecasting. 22(1):102–115.
- Wright JD, Rossi PH, Wright SR, Weber-Burdin E. 1979. After the clean-up: long range effects of natural disasters. Beverly Hills: Sage.
- Wu Y, Nair US, Pielke RA, McNider RT, Christopher SA, Anantharaj VG. 2009. Impact of land surface heterogeneity on mesoscale atmospheric dispersion. Boundary-Layer Meteorol. 133(3):367–389.
- Yuan M. 2005. Beyond mapping in GIS applications to environmental analysis. Bull Amer Meteorol Soc. 86(2):169–170.