
 ?Mathematical formulae have been encoded as MathML and are displayed in this HTML version using MathJax in order to improve their display. Uncheck the box to turn MathJax off. This feature requires Javascript. Click on a formula to zoom.
Abstract
This paper quantitatively examines the effects of slope height and slope gradient on landslide size distributions. We developed a loess slide inventory by using field survey data. Statistical analysis shows that most landslides are concentrated in areas with slope heights less than 60 m, and approximately 30% of the loess slides occurred on slopes with a gradient between 30° and 40°. However, high and steep slopes are rare in nature. We calculated the relative density of landslides, and the results showed that the relative density of landslides is greater on higher slopes with steeper slope gradients. Moreover, landslide size is correlated with slope height and slope gradient. The results demonstrate that landslide size increases as slope height increases and decreases as slope gradient increases. Furthermore, we determined the probability density of landslide area using kernel density estimation. The results showed that the landslide size distribution exhibits power law scaling above a certain size threshold, and the size threshold differs for different slope heights and slope gradients. The exponential scalings are influenced by slope height and slope gradient. Our results indicate that the exponential scaling decreases with increasing slope height and increases with increasing slope gradient. Large landslides are more frequent with a higher slope height and gentler slope gradient.
1. Introduction
Loess is an aeolian sediment widely distributed in arid and semiarid areas (Liu Citation1985). Loess has well-developed vertical joints, loose structures, large pores and collapsibility (Derbyshire Citation2001; Xu et al. Citation2012). These characteristics of loess make loess terrain highly landslide-prone (Zhang et al. Citation2017; Qiu et al. Citation2018). In particular, the unique geological, geomorphological and climate variations on the Loess Plateau make this area highly vulnerable to exogenous slope processes (Derbyshire and Mellors Citation1988; Shi et al. Citation2016; Peng et al. Citation2019). Loess slides represent one of most widespread natural hazards in the loess terrain and have significant impacts on local environments and society (Qiu et al. Citation2017; Zhang et al. Citation2017).
The size distribution of landslides plays an important role in determining landslide hazards, understanding the fundamental processes of landslide dynamics, and estimating erosion and sediment yield (Stark and Hovius Citation2001; Korup Citation2005; Guthrie et al. Citation2008; Guzzetti et al. Citation2008). Many authors have proposed that the landslide size-frequency distribution follows a negative power law relationship for larger landslides within a given area and shows a deflection from the power law for small landslide size, i.e., a rollover effect (Hovius et al. Citation1997; Turcotte et al. Citation2002; Malamud et al. Citation2004; Van Den Eeckhaut et al. Citation2007; Hungr et al. Citation2008). The scaling exponents of the power law vary with material properties, geological conditions, topography, physiographic variables of the landscape, and failure event types (Pelletier et al. Citation1997; Stark and Hovius Citation2001; Katz and Aharonov Citation2006; Guzzetti et al. Citation2008; Stark and Guzzetti Citation2009; Frattini and Crosta Citation2013; Gallen et al. Citation2015). Some authors interpreted the change of the power law exponent as resulting from trigger properties (Marc et al. Citation2018; Valagussa et al. Citation2019). Although landslide size distribution has been researched by many authors, how the slope height and slope gradient influence the landslide size and size distribution, the rollover effect of landslide size distribution and its scaling exponents of the power law remain poorly understood. In particular, there exists controversy in the previous literature regarding the relationship between landslide size and slope gradient (Frattini and Crosta Citation2013; Katz et al. Citation2014; Chen et al. Citation2016). Therefore, it is necessary to quantitatively examine the effects of topography on the size distribution and size of landslides.
The scope of this work was to determine how topographic features, such as slope height and slope gradient, influence the size and size distribution of loess slides based on field survey data. To this end, we developed a landslide inventory based on a field survey, quantified the relationship between landslide volume and area, analyzed the number and relative density of landslides according to slope height and slope gradient, investigated the effects of slope height and slope gradient on landslide size, determined the probability density of landslides by using kernel density estimation, and compared the landslide size distribution within different slope heights and slope gradients.
2. Materials and methods
2.1. Study area
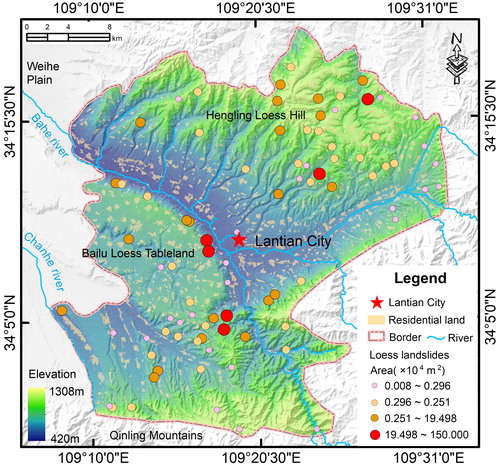
The study area is located in the Xi’an region of Shaanxi Province on the humid southern edge of the Loess Plateau (). Steep topography and frequent extreme weather events make this area prone to loess slides. shows the distribution of landslides in this area. This area is characterized by a typical temperate continental monsoon climate with a mean annual rainfall of 720 mm and a mean air temperature of 13.1 °C. Precipitation is mainly governed by a monsoon climate. Most of the precipitation is concentrated in the rainy season (July to September), which accounts for 55% of the total annual precipitation. Many landslides and severe water erosion events occur during this period. The altitude in the area ranges from 388 to 1310 m above sea level. The Bahe River is the major river system in the study area, while the Chanhe River is the major tributary in the study area ().
Figure 1. Location of the study area with elevation and drainage network information. Dots show the locations and sizes of the identified loess slides. Source: Haijun Qiu
This area has been uplifting since the early Quaternary and is covered by a thick loess-paleosol sequence. Stratigraphically, the loess in this study area can be divided into 4 formations from bottom to top: Late Pliocene Red Clay Formation, Wucheng Loess, Lishi Loess and Malan Loess. Loess is a clastic, homogeneous and predominantly silt-sized sediment formed by the accumulation of wind-blown silt, and it covers approximately 10% of the Earth's surface (Liu Citation1985). Loess has a loose and porous structure with a large difference between its wet and dry strength (Xu et al. Citation2012). Loess is a collapsible soil and instantaneously collapses, softens and distorts in the presence of water (Liu Citation1985; Derbyshire Citation2001). In contrast to other rock and soil types, vertical jointing in loess is particularly well developed, which influences the hydrological process in loess soil (Liu Citation1985; Derbyshire Citation2001). These distinctive properties make the loess area highly susceptible to erosion and landslides (Derbyshire et al. Citation1991; Zhang et al. Citation2014).
2.2. Landslide data
A detailed landslide inventory map, as the fundamental component of landslide studies, can provide basic information about the landslides that have occurred in the past (Guzzetti et al. Citation1999). A landslide inventory can be prepared by using different techniques depending on the purpose of the investigation, the scale of the maps, the resolution of the available imagery and the experience of the investigators (van Westen et al. Citation2006; Guzzetti et al. Citation2012). Despite the great advances in and convenience of remote sensing technology (Cheng et al. Citation2018; Wang et al. Citation2018; Cui et al. Citation2019), its application is limited by the presence of vegetation canopies, erosion and plowing (Brardinoni and Church Citation2004). Moreover, some important parameters, such as the slope gradient and slope height, cannot be measured accurately due to many errors. Therefore, in this work, we conducted a series of intensive field surveys from 2015 to 2017 to obtain and measure the loess slide information in the study area. We collected previously published and unpublished landslide reports from the study area and located additional landslides by interpretation of remote sensing images and Google Earth images before the field surveys. These surveys were aided by recent advances in mobile technologies and unmanned aerial vehicles (UAVs) (). We acquired high-resolution image and terrain data of landslides from a UAV named DJI Mavic Pro. Subsequent data processing was performed using a practical commercial photogrammetry software named Agisoft PhotoScan Professional Edition. shows 3D models, digital elevation models (DEMs) and digital orthophoto maps (DOMs) of typical loess slides in the study area. shows the characteristic parameters of Fenpo landslide, Mawan landslide and Huijiazui landslide. In total, 91 loess slides were mapped and stored in the landslide inventory. Most of the landslide information was mapped and transformed into a GIS database. The information in this inventory includes the landslide locations, size and related topographic parameters. Although the field survey is an efficient tool with which to obtain certain important parameters, our field trip was concentrated on the areas along major and minor accessible roads.
Figure 2. Field survey photos. (a) Loess landslides from the UAV perspective; (b) UAV field investigation in the orthographic view; (c) UAV in flight; (d) a field measurement of geometric parameters; (e) a geological compass measurement; (f) operators performing a UAV investigation mission in situ. Source: Haijun Qiu
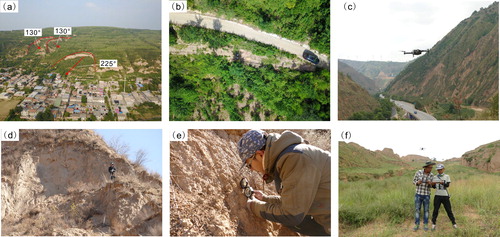
Figure 3. 3D reconstruction models, DEMs and DOMs of typical loess slides in the study area. Source: Haijun Qiu
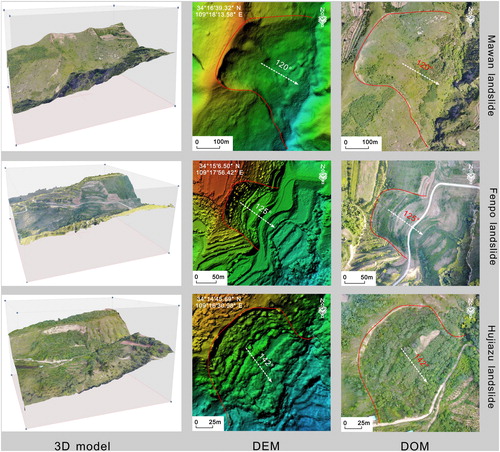
Table 1. The characteristic parameters of Fenpo landslide, Mawan landslide and Huijiazui landslide from field investigation.
2.3. Methods
2.3.1. Relative density of landslides
The relative density of landslides (RD) can be expressed as follows:
(1)
(1)
where, RD is relative density, S is the total area of the study area, N is the total number of landslides, Si is the area in each class of slope gradient, and Ni is the number of landslides in each class of slope gradient. An RD is equal to 1 indicates an average landslide relative density. An RD is less than 1 implies that the relative density is below average density, while an RD of greater than 1 suggests that the relative density is higher than average density.
2.3.2. Probability density distribution of landslides
There is accumulating evidence showing that the probability density of landslides obeys a power law function for landslide size greater than a given minimum area (Guzzetti et al. Citation2002). In this work, we used the power law relation to fit the probability density of landslides for loess slides that exceed a minimum area:
(2)
(2)
where A is the landslide area; c is a constant; and α, a useful parameter to determine the abundance of small and large landslides, is the scaling exponent representing the slope of probability density curve in a log-log plot. Lower scaling exponents of α are associated with a higher frequency of large landslides.
3. Results
3.1. Size distribution of loess slides
The empirical relationship between volume and area of loess slides is shown in based on data of 91 landslides in the field investigation. shows that there exists an obvious linear relationship between volumes and areas of loess slides for multiple orders of magnitude in the log-log coordinates. This result in the following relationship:
(3)
(3)
where VL is the volume of loess slides and AL is the area of loess slides.
Figure 4. Empirical relationship between volume and area of loess slides. The thick red line is the best fit obtained by a linear least-square methods. The dashed red lines show 95% prediction intervals. Contours shows the point density obtained through bivariate kernel density estimation. The box plot shows descriptive statistics of the volume of loess slides. The purple dots and line show the data and its Weibull distribution curve.
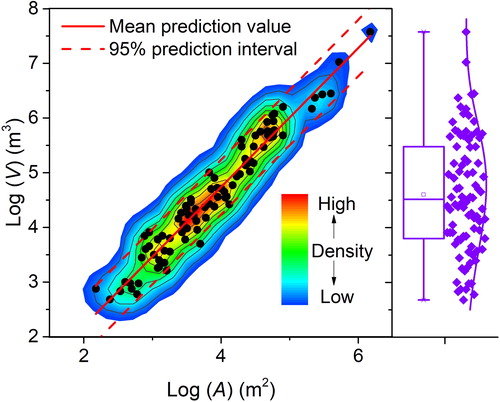
To determine the uncertainty of this empirical equation, we adopted two empirical relationships to ascertain the bounds of landslide volume. shows the upper and lower 95% prediction intervals.
The volumes and areas of individual loess slides cover 5 and 4 orders of magnitude respectively. The corresponding coefficient of variation is 5.18. The mean volume of all loess slides in the study area is approximately 790,000 m3. Furthermore, we calculated the density of points through bivariate kernel density estimation and found most loess slides had volumes ranging from 104 to 105 m3. Approximately 80% of loess slides with thickness less than 10 m were shallow landslides.
3.2. Relationships between slope height and size distribution of loess slides
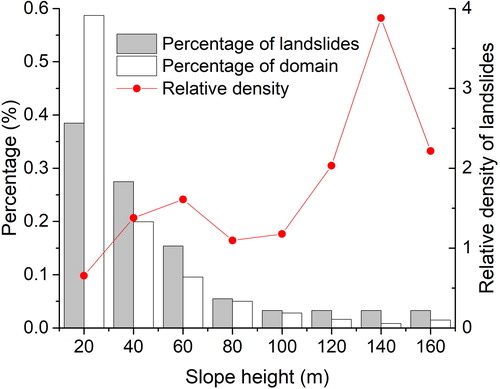
We derived the slope height using SAGA GIS (Module library: terrain analysis). shows the distribution of slope height in the study area. The number of loess slides decreased highly with increasing slope height (). The mean slope height of loess slides is approximately 39 m. Approximately 80% of all loess slides are concentrated in slope heights less than 60 m. However, higher slopes are rare in nature. As shown in (white bar), the percentage of domain decreased with increasing of slope height. Moreover, we used EquationEquation (1)(1)
(1) to compute the relative density of landslides with respect to slope height. The graph shows that the relative density of landslides is higher with higher slope height. The highest relative density of landslides is on slopes with heights exceeding 120 m ().
Figure 5. Slope height map of the study area. Source: Haijun Qiu
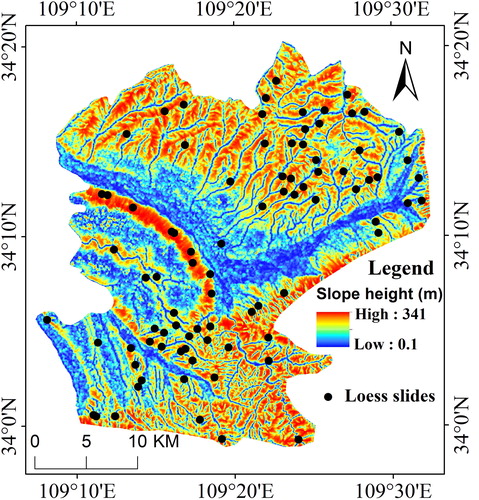
Figure 6. The relationship between landslides and slope height.
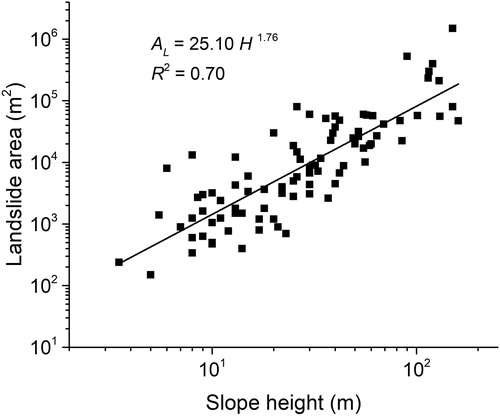
Furthermore, as illustrated in , the landslide size increased with increasing slope height. Although there is still little theoretical basis for choosing a particular functional form, the significant increase in loess slide area with slope height is well described by a simple power-law regression ():
where AL is the loess slide area, and H is the slope height.
Figure 7. Landslide area vs. slope height. The solid line is the best fit regression line, which has a power-law form.
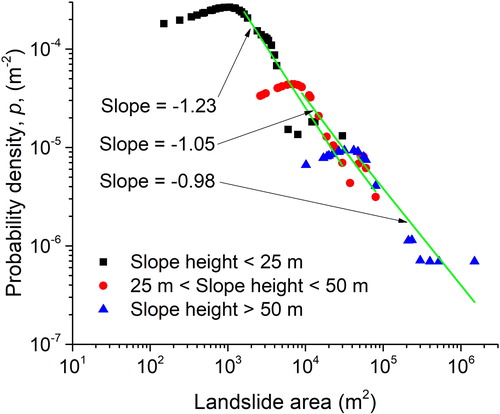
Furthermore, we calculated the probability densities of loess slide areas using kernel density estimation to analyze the size distribution of landslides for slope heights of <25 m, 25–50 m and >50 m () and found that there were obvious rollover effects in the noncumulative distributions of loess slide areas in log-log coordinates. The frequency-size distribution of loess slides departs from the linear fractal relationship when the loess slide size is smaller than a certain area. The probability density distribution of landslides consistently satisfies negative power-law statistics for larger loess slide areas, with scaling exponent α of 1.23, 1.05 and 0.98 for slope heights of <25 m, 25–50 m and >50 m, respectively (). The scaling exponents of the power-law functions were clearly influenced by slope height. The scaling exponents decreased with increasing slope height. This pattern suggests that there are more frequent small landslides at lower slope heights.
Figure 8. Probability density of landslide area for different slope heights. Dots show the kernel density landslide area estimates; green lines indicate that the probability densities of landslides that are larger than a certain area can be approximated by a power-law relationship.
3.3. Relationships between the slope gradient and size distribution of loess slides
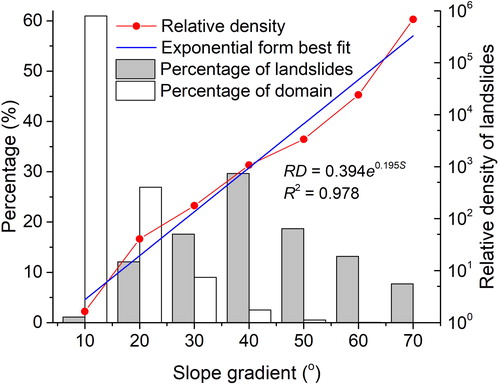
We obtained the slope gradient using ArcGIS software 10.0. shows the distribution of slope gradient in the study area. To obtain greater insight into the relationship between landslide size distribution and slope gradient, the slope gradient was divided into seven classes: <10°, 10°–20°, 20°–30°, 30°–40°, 40°–50°, 50°–60°, >60°. With the increase of slope gradient, the number of landslides increases at first and then decreases (grey bars, ). The mean slope gradient of the loess slides was 37°. Approximately 30% of the loess slides occurred within a slope gradient between 30° and 40°. Moreover, the steeper slopes are rare in nature. As shown in (white bar), the percentage of domain decreased with increasing of slope gradient. Furthermore, we used EquationEquation (1)(1)
(1) to compute the relative density of landslides with respect to slope gradient. The graph shows that the relative density of landslides increases significantly with the increase in slope gradient, with the highest values occurring at a slope gradient >60° (solid line, ).
Figure 9. Slope gradient map of the study area. Source: Haijun Qiu
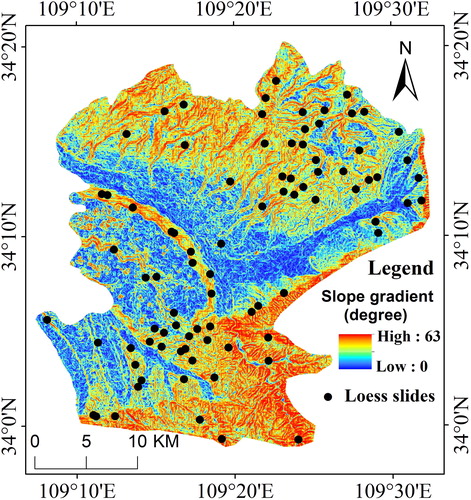
Figure 10. The relationship between landslides and slope gradient.
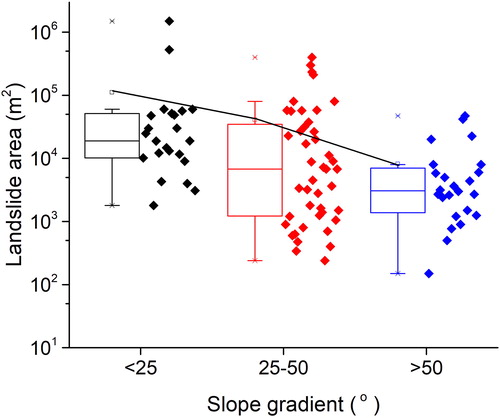
To quantify the size distribution and size of loess slides with different slope gradients, we further grouped slope gradient into three classes: <25°, 25°–50° and >50°. As illustrated in , the slope gradient shows a clear influence on the landslide size. The mean loess slide areas for slope gradients <25°, 25°–50° and >50° were 1.10 × 10⁵ m2, 4.09 × 10⁴ m2 and 8.13 × 10³ m2, respectively. The mean loess slide area for a slope gradient <25° is approximately 14 times larger than that for a slope gradient >50°. It is difficult for steep slopes to support large loess slides.
Figure 11. Box plots showing landslide areas within different slope gradients. Mean areas are indicated by the small diamonds, and median areas are indicated by the black line.
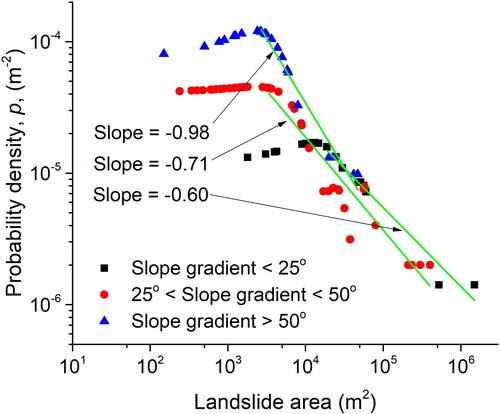
In addition, we calculated the landslide area probability density using a kernel density estimation for slope gradients of <25°, 25°–50° and >50° and found that the probability density distributions of loess slides are influenced by the slope gradient (). The probability density of landslides also satisfies power-law statistics at larger loess slide areas, with scaling exponent α of 0.60, 0.71 and 0.98 for loess slides with slope gradients of <25°, 25°–50° and >50°, respectively (). The scaling exponents increase with increasing slope gradient. This suggests that there are more frequent small landslides with larger slope gradients.
Figure 12. Probability density of landslide area for different slope gradients. Dots show the kernel density landslide area estimates; green lines indicate that the probability densities of landslides that are larger than a certain area can be approximated by a power-law relationship.
4. Discussion
4.1. The role of slope height on landslide size and size distribution
We analyzed the coupling between slope height and landslide number distribution and found that the majority of loess slides occur in areas with relatively small slope heights because of the very large proportion of the study area with small slope heights. The number of loess slides significantly decreases with increasing slope height. Our results here differ from previous findings observed in the loess ridge and hilly region from Qiu et al. (Citation2016), who found that the loess slide number distribution versus slope height is unimodal. This result may be because the study area is a typical loess tableland region, and most of the study area is covered by slopes with low slope heights. These low slopes are always eroded by rivers and are susceptible to human activities (Zhang and Liu Citation2009).
In addition, landslide size controls the power of landslides (Lari et al. Citation2014; Valagussa et al. Citation2019). Previous studies have shown that the topography modulates landslide size and land that slide size increases with increasing slope height (Korup et al. Citation2007; Frattini and Crosta Citation2013; Gallen et al. Citation2015; Qiu et al. Citation2016). Most giant landslides occur in areas with high local relief and deeply incised valleys (Montgomery and Brandon Citation2002). This is because slope height limits landslide size, and large landslides rarely occur on slopes with low slope heights (Korup et al. Citation2007; Qiu et al. Citation2016). In this work, we found that landslide size increases with slope height. Our results are similar to findings from previous studies (Montgomery and Brandon Citation2002; Korup et al. Citation2007; Qiu et al. Citation2016).
4.2. The role of slope gradient on landslide size and size distribution
Slope gradients play an important role in landslides, and the relationship between landslide frequency and slope gradient has been researched by many authors (Dai and Lee Citation2002; Qiu et al. Citation2019). Based on field survey data, we found that most landslides occurred within a slope gradient between 30° and 40°.
There are some arguments about the role of slope gradient on landslide size. Frattini and Crosta (Citation2013) found that small landslides are usually associated with high slope angles. Moreover, by using the limit equilibrium simulation method, Chen et al. (Citation2016) reported that landslide size decreases with increasing slope gradient. However, by using the numerical discrete element method, Katz et al. (Citation2014) showed that landslide size increases with increasing slope gradient. In this work, we found a relationship between the landslide size and slope gradient, with larger landslides associated with gentler slope gradients. In the case of the relationship between landslide size and slope gradient, our finding is similar to the result of Chen et al. (Citation2016), who found that the landslide size decreases as the slope gradient increases, but differs from the result of Katz et al. (Citation2014), who found that the landslide size increases as the slope gradient increases.
4.3. Rollover effect of landslide size distribution and its influencing factors
It is well known that large landslides are often very hazardous, and small landslides occur the most frequently (Hurst et al. Citation2013). Thus, analysis of landslide size distribution is essential for landslide hazard assessment (Valagussa et al. Citation2019). Many studies have observed that the landslide size distribution generally exhibits power-law scaling over a certain scale range and often departs from the power-law relationship below a certain landslide size (Hungr et al. Citation1999; Stark and Hovius Citation2001; Martin et al. Citation2002). The rollover effect of landslide size distributions is well known. Some authors attribute the reason for this rollover effect and scaling exponents to undersampling, soil moisture, topography, slope geometry and physiographic variables of landscapes (Pelletier et al. Citation1997; Stark and Hovius Citation2001; Turcotte et al. Citation2002; Malamud et al. Citation2004; Hungr et al. Citation2008). However, determining how to provide a quantitative relationship between the influencing factors and scaling exponents of landslide size distribution has been severely neglected. Here, we found that the landslide size distribution curve can be well described by a negative power law for landslides larger than a particular size. We fitted the landslide size distribution curves with a power-law function and obtained the scaling exponents of the curves. Moreover, the scaling exponents of the power law are influenced by slope height and slope gradient. The scaling exponents decreased with increasing slope height and increased with increasing slope gradient. Furthermore, Van Den Eeckhaut et al. (Citation2007) found that the smaller the scaling exponent, the greater the contribution of large landslides to the total landslide inventory is, and vice versa. The above discussion indicates that larger landslides are commonly distributed in larger slope heights and smaller slope gradients. Therefore, our results here are similar to findings from Van Den Eeckhaut et al. (Citation2007).
5. Conclusions
This study developed a loess slide inventory based on field investigations. The analysis of this landslide inventory elucidates the controls on landslide size and size distribution in loess terrain. Analysis of the landslide size distribution with respect to slope height demonstrated that loess slides are more frequent on slope heights less than 60 m, while the statistical analysis of landslide number and slope gradient suggests that loess slides are abundant on slope gradients between 30° and 40°. However, high and steep slopes are rare in nature. The relative density of landslides is obviously high on slopes with high slope height and steep slope gradient. Moreover, the results show that both slope height and slope gradient control landslide size; landslide size increases with increasing slope height and decreases with increasing slope gradient. Furthermore, the frequency-size distribution exhibits a power-law scaling for large landslides. The power-law exponent depends on slope height and slope gradient. This exponent decreases as the slope height increases and increases as the slope gradient increases. Small landslides are more frequent with lower slope height and larger slope gradient. This finding may have profound implications for landslide hazard assessment and long-term erosion dynamics.
Disclosure statement
No potential conflict of interest was reported by the authors.
Additional information
Funding
Related Research Data
References
- Brardinoni F, Church M. 2004. Representing the landslide magnitude–frequency relation: Capilano River Basin, British Columbia. Earth Surf Process Landforms. 29(1):115–124.
- Chen XL, Liu CG, Chang ZF, Zhou Q. 2016. The relationship between the slope angle and the landslide size derived from limit equilibrium simulations. Geomorphology. 253:547–550.
- Cheng D, Cui Y, Su F, Jia Y. 2018. The characteristics of the Mocoa compound disaster event,Colombia. Landslides. 15:1223–1232.
- Cui Y, Cheng D, Chan D. 2019. Investigation of post-fire debris flows in Montecito. ISPRS International Journal of Geo-Information. 8(1): 5.
- Dai FC, Lee CF. 2002. Landslide characteristics and slope instability modeling using GIS, Lantau Island, Hong Kong. Geomorphology. 42(3–4):213–228.
- Derbyshire E. 2001. Geological hazards in loess terrain, with particular reference to the loess regions of China. Earth-Sci Rev. 54(1–3):231–260.
- Derbyshire E, Mellors TW. 1988. Geological and geotechnical characteristics of some loess and loessic soils from China and Britain: a comparison. Eng Geol. 25(2–4):135–175.
- Derbyshire E, Wang J, Jin Z, Billard A, Egels Y, Kasser M, Jones DKC, Muxart T, Owen L 1991. Landslides in the Gansu loess of China. Catena Suppl. 20:119–145.
- Frattini P, Crosta GB. 2013. The role of material properties and landscape morphology on landslide size distributions. Earth Planet Sci Lett. 361:310–319.
- Gallen SF, Clark MK, Godt JW. 2015. Coseismic landslides reveal near-surface rock strength in a high-relief, tectonically active setting. Geology. 43(1):11–14.
- Guthrie RH, Deadman PJ, Cabrera AR, Evans SG. 2008. Exploring the magnitude–frequency distribution: a cellular automata model for landslides. Landslides. 5(1):151–159.
- Guzzetti F, Ardizzone F, Cardinali M, Galli M, Reichenbach P, Rossi M. 2008. Distribution of landslides in the Upper Tiber River basin, central Italy. Geomorphology. 96(1–2):105–122.
- Guzzetti F, Carrara A, Cardinali M, Reichenbach P. 1999. Landslide hazard evaluation: a review of current techniques and their application in a multi-scale study, Central Italy. Geomorphology. 31(1–4):181–216.
- Guzzetti F, Malamud BD, Turcotte DL, Reichenbach P. 2002. Power law correlations of landslide areas in central Italy. Earth Planet Sci Lett. 195(3–4):169–183.
- Guzzetti F, Mondini AC, Cardinali M, Fiorucci F, Santangelo M, Chang KT. 2012. Landslide inventory maps: New tools for an old problem. Earth-Sci Rev. 112(1–2):42–66.
- Hovius N, Stark CP, Allen PA. 1997. Sediment flux from a mountain belt derived by landslide mapping. Geology. 25(3):231–234.
- Hungr O, Evans SG, Hazzard J. 1999. Magnitude and frequency of rock falls and rock slides along the main transportation corridors of southwestern British Columbia. Can Geotech J. 36(2):224–238.
- Hungr O, McDougall S, Wise M, Cullen M. 2008. Magnitude–frequency relationships of debris flow sand debris avalanches in relation to slope relief. Geomorphology. 96(3–4):355–365.
- Hurst MD, Ellis MA, Royse KR, Lee KA, Freeborough K. 2013. Controls on the magnitude-frequency scaling of an inventory of secular landslides. Earth Surf Dynam. 1(1):67–78.
- Katz O, Aharonov E. 2006. Landslides in vibrating sand box: what controls types of slope failure and frequency magnitude relations? Earth Planet Sci Lett. 247(3–4):280–294.
- Katz O, Morgan JK, Aharonov E, Dugan B. 2014. Controls on the size and geometry of landslides: insights from discrete element numerical simulations. Geomorphology. 220:104–113.
- Korup O. 2005. Distribution of landslides in southwest New Zealand. Landslides. 2(1):43–51.
- Korup O, Clague JJ, Hermanns RL, Hewitt K, Strom AL, Weidinger JT. 2007. Giant landslides, topography, and erosion. Earth Planet Sci Lett. 261(3–4):578–589.
- Lari S, Frattini P, Crosta GB. 2014. A probabilistic approach for landslide hazard analysis. Eng Geol. 182:3–14.
- Liu TS. 1985. Loess and environment. Beijing: China Ocean Press; p. 1–237.
- Malamud BD, Turcotte DL, Guzzetti F, Reichenbach P. 2004. Landslide inventories and their statistical properties. Earth Surf Process Landforms. 29(6):687–711.
- Marc O, Stumpf A, Malet JP, Gosset M, Uchida T, Chiang SH. 2018. Initial in-sights from a global database of rainfall-induced landslide inventories: the weak influence of slope and strong influence of total storm rainfall. Earth Surf Dynam. 6(4):903–922.
- Martin Y, Rood K, Schwab JW, Church M. 2002. Sediment transfer by shallow landsliding in the Queen Charlotte Islands, British Columbia. Can J Earth Sci. 39(2):189–205.
- Montgomery DR, Brandon MT. 2002. Topographic controls on erosion rates in tectonically active mountain ranges. Earth Planet Sci Lett. 201(3–4):481–489.
- Pelletier JD, Malamud BD, Blodgett T, Turcotte DL. 1997. Scaleinvariance of soil moisture variability and its implications for the frequency-size distribution of landslides. Eng Geol. 48(3–4):255–268.
- Peng J, Wang S, Wang Q, Zhuang J, Huang W, Zhu X, Leng Y, Ma P. 2019. Distribution and genetic types of loess landslides in China. J Asian Earth Sci. 170:329–350.
- Qiu H, Cui P, Regmi AD, Hu S, Hao J. 2019. Loess slide susceptibility assessment using frequency ratio model and artificial neural network. Q J Eng Geol Hydrogeol. 52(1):38–45.
- Qiu H, Cui P, Regmi AD, Hu S, Wang X, Zhang Y. 2018. The effects of slope length and slope gradient on the size distributions of loess slides: field observations and simulations. Geomorphology. 300:69–76.
- Qiu H, Cui P, Regmi AD, Hu S, Wang X, Zhang Y, He Y. 2017. Influence of topography and volume on mobility of loess slides within different slip surfaces. Catena. 157:180–188.
- Qiu H, Regmi AD, Cui P, Cao M, Lee J, Zhu X. 2016. Size distribution of loess slides in relation to local slope height within different slope morphologies. Catena. 145:155–163.
- Shi JS, Wu LZ, Wu SR, Li B, Wang T, Xin P. 2016. Analysis of the causes of largescale loess landslides in Baoji, China. Geomorphology. 264:109–117.
- Stark CP, Guzzetti F. 2009. Landslide rupture and the probability distribution of mobilized debris volumes. J Geophys Res Earth Surf. 114(F2):2003–2012.
- Stark CP, Hovius N. 2001. The characterization of landslide size distributions. Geophys Res Lett. 28(6):1091–1094.
- Turcotte DL, Malamud BD, Guzzetti F, Reichenbach P. 2002. Selforganization, the cascade model, and natural hazards. Proc Natl Acad Sci USA. 99(Supplement 1):2530–2537.
- Valagussa A, Marc O, Frattini P, Crosta GB. 2019. Seismic and geological controls on earthquake-induced landslide size. Earth Planet Sci Lett. 506:268–281.
- Van Den Eeckhaut M, Poesen J, Govers G, Verstraeten G, Demoulin A. 2007. Characteristics of the size distribution of recent and historical landslides in a populated hilly region. Earth Planet Sci Lett. 256(3–4):588–603.
- Van Westen CJ, Van Asch TW, Soeters R. 2006. Landslide hazard and risk zonation—why is it still so difficult? Bull Eng Geol Environ. 65(2):167–184.
- Wang J, Jin W, Cui YF, Zhang WF, Wu CH, Alessandro P. 2018. Earthquake-triggered landslides affecting a UNESCO Natural Site: the 2017 Jiuzhaigou Earthquake in the World National Park, China. Journal of Mountain Science. 15(7): 1412–1428.
- Xu L, Dai FC, Tham LG, Zhou YF, Wu CX. 2012. Investigating landslide-related cracks along the edge of two loess platforms in northwest China. Earth Surf Process Landforms. 37(10):1023–1033.
- Zhang F, Kang C, Chan D, Zhang X, Pei X, Peng J. 2017. A study of a flowslide with significant entrainment in loess areas in China. Earth Surf Process Landforms. 42(14):2295–2305.
- Zhang F, Pei X, Chen W, Liu G, Liang S. 2014. Spatial variation in geotechnical properties and topographic attributes on the different types of shallow landslides in a loess catchment, China. Eur J Environ Civ Eng. 18:470–488.
- Zhang M, Liu J. 2009. Controlling factors of loess landslides in western China. Environ Earth Sci. 69:1671–1680.