
 ?Mathematical formulae have been encoded as MathML and are displayed in this HTML version using MathJax in order to improve their display. Uncheck the box to turn MathJax off. This feature requires Javascript. Click on a formula to zoom.
Abstract
The sea-land telluric current vector and its continuity during two geomagnetic storms are discussed using observation data of 13 geoelectric field stations within 100 km of the coastline in China and 5 similar stations in Canada. The results show that the amplitude of the geoelectric field varies up to 300–2600 mV/km at high latitudes and in the range 100–300 mV/km at low latitudes, below 100 mV/km at the middle latitudes, when the two geoelectric storms loading. The energy spectra of geoelectric field at RES in Canada is found to be concentrated in 16–48 min, and at CHL in China concentrated in 64–128 min. The telluric current flows directly to sea from the coastal land, except the two land-type stations with particular electrical structures. The sea-land current continuity model which was set up based on geological and geophysical data to deduce vertical circulation of current channels in continental and marginal seas area, which can explain the different current orientations in different regions. Our detailed analysis show that the direction of telluric current of Island stations is related to the deposition and river erosion and controlled by ocean currents during monsoon, are also included by the model. At last, the sea-land telluric current continuity model provides well understanding for the constraints of conductivity on the sea-land interface.
1. Introduction
The geoelectric field arises from the existence of telluric currents flowing in the solid earth medium. In recent decades, global observations have suggested that the telluric current is as active as the geomagnetic-inducted current (GIC) (Medford et al. Citation1981), especially within 10–200 s periods, possibly because the induced current adds to the primary horizontal components rather than subtracts from the vertical components (Jones et al. Citation1969). The shorter- and longer-period groups are related to the ionospheric current system and the induction phenomena inside the earth, respectively. As discussed by Chave et al. (Citation1992) and Berguig et al. (Citation2013), the telluric current generated from the following several sources: one is fluctuations of the geomagnetic field at the earth’s surface caused by time-varying electric current systems in the ionosphere and magnetosphere; the other is dynamo processes within the earth's core and the motional induction caused by the flow of conducting seawater across the earth's geomagnetic field. The significance of these sources depends on the frequency and spatial scale of the source. For example, source one is a purely inductive phenomenon (Lanzerotti et al. Citation1990), while the other source is believed to be unimportant in short periods due to shielding by the highly conductive lower mantle (LeMouël et al. Citation1974). The stray current that can arise from motional induction, have become more recognized in recent years, another possible source of systematic errors of telluric current is potential measurements.
Correspondingly, there are three sources of oceanic telluric currents, such as the induction of the space current system, the periodic variation of the tidal response/oceanic current potential and the circulation component of deep earth currents. According to Serson (Citation1973) and William (Citation2005), the oceanic telluric current originates from the induction of the disturbance of the space current system in the earth medium and has different responses at different latitudes (longitudes) on the earth. In recent years, the observations of space-to-earth have further contributed to the development of deep ocean current at the global scale (Schnepf et al. Citation2014, Citation2015). In addition, deep conductivity information is detected by the magnetotelluric method, and the water content in the upper mantle is estimated by petrological experiments and heat flow structure detection (Yoshino et al. Citation2008; Zhang et al. Citation2012), which may provide the evidence that deep currents can affect near-surface telluric currents. The basic characteristic of the telluric current is that the current path tends to be a good conductive medium, and the energy flow concentrates in this good conductor. Moreover, GIC is an important source that may cause negative effects even disasters by man-made noise such as power grid, pipelines and railways, which is faster part of the current source if power networks contact to land (Liu et al. Citation2016, Citation2017). Therefore, the direction of long-period telluric current vector reflects the electrical inhomogeneity of deep medium (Zhang et al. Citation2017a, Citation2017b), which is a key to understand the differentiation of deep conductivity.
The electromagnetic field observations on the earth's surface can reflect the information of the earth’s deep conductor structure and provide a direct record of the electromagnetic disturbance outside the solid earth. The observation data can be used to study the deep earth's electromagnetic dynamics, especially the crust–mantle activity, and also a basis for studying the energy exchange between the earth and space. Therefore, based on the geoelectric field data collected from 19 coastal stations (i.e. within 100 km to the coast) in China and Canada, two extraordinary storms in 2015 are compared and analyzed in this paper. The direction, amplitude and time-varying characteristics of the telluric current in the inshore areas are also discussed. Furthermore, we developed the current circulation model of the continental coast based on geological and GIC results, and found that the current has a low stopband loop current channel on the vertical section. From that we inferred a preliminary response relationship of seasonal characteristics between the telluric and ocean current circulation.
2. Data and methods
2.1. Data and background
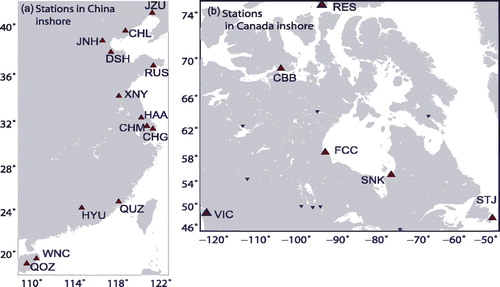
We selected 13 stations from the China Geoelectric Field Network. Nine of these 13 stations are located less than 100 km from the coastline of China like CHL (Changli), JZU (Jinzhou) and so on, even most of them are located within 50 km from the coastline, so we named these “coast-type” stations. On the contrary, CHM (Chongming), QOZ (Qiongzhong), WNC (Wenchang) and CHG (Changjiang) represent “island-type stations”, which are located on Chongming Island and Hainan Island, respectively. In addition, monitoring of the geoelectric field is important for validation of models and used to predict potentially damaging GIC in the power grid (Liu et al. Citation2018). We also processed the geoelectric field data from RES (http://www.geomag.nrcan.gc.ca/plot-tracee/geo-en.php) with high latitude (74°N) and STJ with middle latitude (47.6°N) in Canada.
The electrodes of these stations are arranged in the two horizontal orthogonal directions of North-South (NS) and East-West (EW), but the horizontal oblique direction at each station is added to lay in China along North-West (NW) or North-East (NE) direction respectively. It is stipulated that the north and east directions are positive (>0). The sampling rates of instruments in two countries are different, 1 data pre-minute (1/60 Hz) in China and 1 data pre 1 Hz in Canada. All of the data in this paper are converted to minute data to calculate the current vector during the two GES period (17 March 17 2015 and 22–23 June 2015). According to the Space Environment Prediction Center of the Chinese Academy of Sciences (SEPC-CAS), the geomagnetic field will occur strong disturbance when it 3 hours reach the level of large magnetic storms (Kp = 8, Dst < –200 nT) and 6 hours reach the level of small magnetic storms. Affected by the combined action of coronal mass ejections on 19 and 21 June 2015, the maximum solar wind speed reached about 730 km/s, the southward component of the interplanetary magnetic field was at least –39 nT, and the Ap index reached 75. The magnetic storm on March 17, 2015 had the same background characteristics as mentioned above, with a minimum Dst < –227 and Kp = 8. Further, the data of XNY (Xinyi), HAA (Hai’an), CHM, QOZ and WNC stations from 2013 to 2018 are selected to discuss the seasonal changes in the direction of telluric current.
2.2. Data processing
At some geoelectric field observation stations, the polarization drift of electrodes there may be occurred, which will affect the data quality of these stations at certain time. In contrast, electromagnetic disturbances and thunderstorms will affect the base value of telluric current. Therefore, we mainly studied the changes in the spatial distribution and direction of the telluric current. With the destination of comparing the data samples under different situations, it is proposed to analyze the distribution characteristics and time variations of the near-shore telluric current from two aspects. One is the change in the direction and amplitude of the telluric current during the magnetic storm loading, the other is the spatial distribution characteristics of the stable telluric current and seasonal variation of the telluric current in time scale of several years.
The geoelectric field vector E is synthesized by two orthogonal components (the north component Ex and the east component Ey) at a certain time. The current density vector is obtained by the Ohm Law:
(1)
(1)
In the formula, σ is the conductivity of surface medium of station, which is the reciprocal of the resistivity ρ. J represents the telluric current density vector (referred to as the “telluric current”). At present, the surface geoelectric field is defined by plane vector observations, so we only consider the two-dimensional telluric current. Based on the time series data of the geoelectric field and formula Equation(1)(1)
(1) , the telluric current vector can be synthesized based on two orthogonal current components for a given station. Usually, the unit of the geoelectric field value is mV/km, and the sounding resistivity at approximately 5 m is Ω·m, so the calculated current density vector unit is 1000 mA/km2 = 1 A/km2.
The variation composition of the telluric current is related to the GIC in the conductor earth that arisen from the space current system. The reason for choosing the time data of the GES is that a consistent signal source appears in the geoelectric field observations at most stations in the world when a geoelectric storm occurs. It is helpful for discussing the spatial distribution of the large-scale telluric current and its controlling factors.
The variation part of the geoelectric field belongs to the space electromagnetic induction according to the field source. The amplitude M refers to the change of the observed values of geoelectric field in a certain period of time. In calculation, the difference between the mean of maximum k values and that of minimum k values is taken as M after removing individual jump points and low pass filtering.
(2)
(2)
In formula Equation(2)(2)
(2) , S represents the time series of geoelectric field data, k is the number of the majority of values in the time series, and m–n is the calculation interval. M is used to replace the variation of geoelectric field, and thus J is obtained by formula Equation(1)
(1)
(1) . The amplitude of variation of the geoelectric field (in dimensions of mV/km) is converted into the change of the telluric current, which is actually the variation of the telluric current density vector, so the current is still continuous and closed. For the observation data during a non-storm time, the mean value of the daily variation of the geoelectric field is directly taken as mean of E, and the telluric current along two orthogonal directions is obtained through EquationEquation (1)
(1)
(1) , then the magnitude and direction of the telluric current are synthesized.
3. Telluric current of coastal area
3.1. Latitudinal effect of GES current
shows the original curve of 22–23 June during the magnetic storm at CHL and RES. The disturbance quantity of the RES in Canada is greater than 2000 mV/km, which is more violent than CHL with ∼100 mV/km. It can be seen that the GES has relatively consistent variation trends at the two stations, which further indicates that the GES has the same global synchronization as the geomagnetic storms. During the GES, the initial disturbances of the two components in different directions at CHL appear ascending in the NS and descending in the EW, and both them last for 30 min (). After about 800 min, there is a sharp drop in the EW and a sharp spike pulse in the NS and a small drop or rise in the opposite direction after the pulse. Perhaps due to high altitude, these characteristics are not obvious at the RES, but the variation during the GES period reflects the risk caused by high-altitude severe geomagnetic storms.
Figure 1. Storm curves of RES (a) and CHL (b), as well as their respective NS-directional wavelet energy spectra (c) and (d). In (c, d), red line on the right shows the comprehensive distribution of the energy spectrum in the period range; the blue curve is the amplitude of the selected time series; and the purple line is the average value of its amplitude.
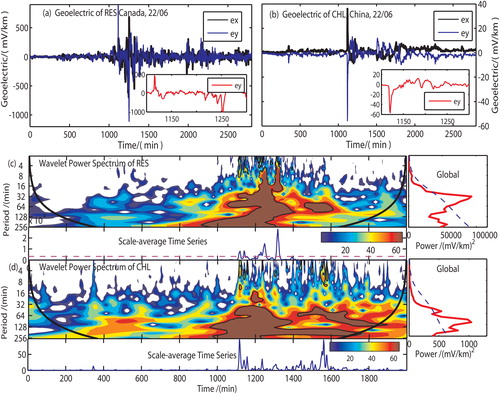
Figure 2. Variations of the geoelectric storm disturbance with latitude.
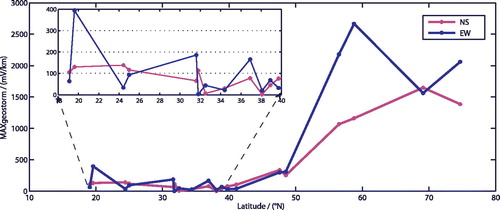
We noticed that the pulse amplitudes of the GES signal recorded by various stations along the coast are quite different. The fluctuation amplitude of the WNC’s EW component reached approximately 400 mV/km and the same component at CHL was only approximately 60 mV/km, while it was 2260 mV/km at RES. The NS component also presents roughly the same trend. These variations seem to reflect the phenomenon of being weak at mid-latitude (30–60°N) and strong at low latitudes (<30°N). Compared with the RES, the disturbance volume in the high-latitude (>60°N) region is so large to exceed 1000 mV/km. In latitude range 47.5°N–75°N, the GES disturbance amplitude also increases from ∼300–2600 mV/km.
With the initial phase appearing, the wavelet energy spectra shows the same strong response. When the main phase arrived at 1100 min in Figure1(a, b), the energy spectrum () show raise in high-frequency components with a period of nearly 32 min. Taking RES and CHL into consideration the energy distribution is available in the range 16–256 min (), however, the energy spectrum of the main phase at CHL seems to be enhanced in high-frequency components compared to the RES. Furthermore, both show obvious energy enhancement, especially in shorter periods (1–16 min), the increase of energy observed at RES is more dramatic and manifest than at CHL.
In another perspective, the comprehensive distribution of energy spectrum of RES is one order of magnitude larger than CHL, reaching 104 (mV/km)2, and the peak of energy is concentrated in the period of 32–64 min. There is no significant difference in peak time between the two stations. The energy is concentrated in 64–128 min at CHL and RES is two orders of magnitude larger than CHL.
To explore whether there is a linear relationship between disturbance and latitude, a lot of variations in disturbance with latitudinal effect is considered at several stations. In , 6 coastal stations in Canada and 13 coastal stations in China have the same disturbance quantity in the same GES, and the trend basically remains consistently increasing with latitude. In the NS direction, the trend is relatively stable, basically fluctuates within the range of less than 200 mV/km. It is seen that the disturbances are smaller at lower latitudes (<20°N) and increase relative uniformly with the latitude. While the trend of EW direction varies larger at lower latitudes, which is partially opposite to the general curve trend.
3.2. Distribution of the current vector in two GESs
The observed response to the local electromagnetic interference is suppressed to the minimum when a GES is loaded. The amplitude value of geoelectric field during the storm is processed, and the telluric current density vector is derived from the differential expression of Ohm's Law, which can be used to measure the variation of telluric current direction in the period of a GES. Comparing to GES on March 17, it is seen that most of 13 stations along the coast of China show a stable direction and their current vectors point to the sea. In particularly, current vector’s amplitude of CHM is larger than others. However, the current vector’s directions during the two storms at all four island-type stations (CHM, CHG, WNC and QOZ) are steady. On the other hands, since the shallow resistivity at the QUZ station is very large (∼500 Ω·m), resulting in a relatively small current vector amplitude of approximately 0.15 A/km2, while other stations are greater than 0.5 A/km2. Similar to QUZ, XNY and HAA exhibit opposite directions of current vectors. In addition, the current vector’s direction of CHM and QOZ also change slightly. Based on the instability of the direction of the island current vector, we divide the current vector into two kinds for further discussion.
(1) Land-type stations
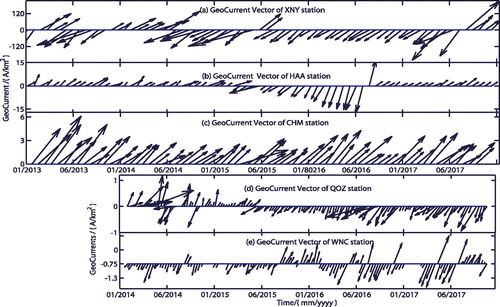
The telluric current directions of three land-type stations (), XNY, HAA and QUZ, have changed greatly. XNY and HAA are located between the Tan-Lu fault zone and coastline, where lakes are widely distributed. Furthermore, show the variations of current vectors in XNY and HAA from 2013 to 2017, in which the time interval of amplitude values is 25 days. The distribution of current vectors is related to the location of faults. XNY station is located near the southern section of the Tan-Lu fault zone which is more than 80 km from the coastline. The purely purpose of XNY is to monitor the activity of the fault zone. However, due to the severe aging of the measuring electrodes in 2013–2014, large-scale steps are often caused by the unstable polarization of electrodes, so the reliability of these data is relatively low. The data of HAA which is located approximately 50 km from the coastline is extremely stable prior to April 2015, meanwhile, the direction of current vector is the northeast, but its direction drops to negative after May 2015 (). The main reason of direction changing is possibly driven by the high potential of the high-conductivity layer (Liu et al. Citation2018). Since the groundwater is distributed and transported along the fault zone, the direction of telluric current may follow the low-resistance zone to attract current. For example, the fault zones near HAA are all oriented in the northeast direction, which is consistent with the direction of telluric current. There are no more observations closer to the coastline, but it can be inferred from the current directions observed at XNY (northwest of HAA) and RUS (northeast of HAA) () that the telluric current is northeast near HAA and the deflection of current near the shoreline may be oriented to the northwest.
Figure 3. Direction of the Earth’s current during the two magnetic storms. (a) The time on March 17, 2015. (b) The time of the electric storm on June 22. The different color arrows indicate the telluric current vector at different stages of the geoelectric storm, and the length of the arrow roughly indicates the magnitude.
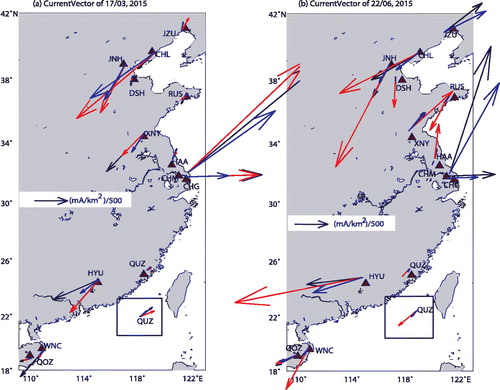
Figure 4. Changes of current vectors in XNY (a), HAA (b), CHM (c), QOZ (d) and WNC (e) stations from 2013 to 2017.
That presence of high shallow resistivities affect low current density is sensitive to external environment. The resistivity of shallow layer (∼5 m) along two directions of QUZ is 590.69 Ω·m and 506.5 Ω·m, respectively, which are extremely higher compared to the shallow-layer resistivities of most stations. This causes the telluric current amplitude of QUZ to be very small, and this may also make the natural polarization potential to be small and easily changed by the interference of external current. In addition, since QUZ is very close to the coastline, other possible factors are the influence of ocean currents or ocean monsoons.
GIC is a kind of induced currents, which is superimposed on the conductive current inside the earth to form the telluric current. In another word, GIC may lead to a change in the direction of telluric current if the magnetic storm is strong, and the baseline potential is low. The calculation results for the telluric current vectors during the two storms indicate that the telluric currents of the terrestrial stations almost point to inland. That means they flow from the high-potential area to low-potential areas. In particular, there are short-term directional changes at the XNY and HAA stations. The telluric current indirectly reflects both space geomagnetic disturbances and the electrical structure inside the earth (Lanzerotti et al. Citation1993; Shimizu and Utada Citation2004). Therefore, the reason for the change in current direction is that the observed value of geoelectric field is still very small (<10 mV/km). The current direction at XNY is repetitive due to its electrode instability. But, HAA station maintained a NE-trending current direction in 2015, which is consistent with the strike of the fault zone near the station site, and rotates northwest near the coast.
(2) Island-type stations
There are four island-type stations, CHM and CHG are located in alluvial island stations at Chongming Island, while WNC and QOZ are located at Hainan Island. The influence factor of telluric current for island-type stations may be different from that of land-type. The telluric current of land-type is greatly affected by the surrounding ocean circulation or the surrounding river flow. On the one hand, shows that the current direction of CHM has been relatively stable pointing to the NE since 2013 and its amplitude does not change much. CHG station on Chongming Island is in a similar condition, but its current vector direction points to a NW direction. On the other hand, QOZ is located in the middle of the Hainan Island, relatively far from the ocean (∼60 km), and WNC is located only ∼3 km from the coastline. The QOZ’s current vectors, which may be affected by ocean currents, are also different. The WNC’s current vector exhibits a reverse change in the middle of 2014 () and changes more frequently after mid-2015, which shows a seasonal characteristic relating to sea current around the Hainan Island.
4. Model of current continuity
4.1. Current continuity from sea to land
On the earth's surface, the telluric currents from ocean to land should be continuous. Generally, the resistivity between sea and land are different, which may lead the existence of current channels to make it continuous. Because it is difficult to measure the telluric current, which makes it difficult to accumulate long-term observation data. There is instability in observing the telluric current especially in coastal and island areas. Therefore, the directions of telluric current are less concerned, particularly in coastal areas.
Generally, the resistivity in the crustal shallow layer is not very high for the non-bedrock platform beds along the coastline (<50 km) due to transgression, but it is still relatively high compared to that of seawater. Since current flows from high potential to low potential, the phenomenon of the ocean current pointing inland can be explained by Ohm's Law. The seawater is a low-resistivity body relative to land (101–103 Ω·m), so the current intensity in seawater is much higher than that in land when loading by the same GES. Moreover, with a large permittivity the ocean itself, a large amount of accumulated electric charge enables its potential higher than that of coastal land. The coastal land is also infiltrated by seawater, resulting the phenomenon that the telluric current flows from ocean to land. Based on previously published geological and geophysical results, a ground current closure model () is established through the stability analysis for the flow direction of telluric current in order to explain the cause of the direction of near-shore telluric current. In a variable geomagnetic field, the telluric current is formed by the high-conductivity formation of ocean and land. shows the pattern of telluric current circulation from land to sea. To satisfy the continuity of telluric current and achieve consistency with observations, the circulation patterns are defined as follows: (1) the telluric current flows from the ocean in the inland direction, parts of which flow underground in the low-resistance zone of the fault, and the high-conductivity layer between the lower crust and the upper mantle is circulated to the ocean. (2) Because the ocean is a good conductor that can attract current relative to the oceanic crust, the rise of deep magma may be the channel through which the current flows from deep layers to upper layers, so that the telluric current completes its circulation in the vertical direction. In addition, lines of ocean’s current are divergent, which include the tidal current that come from ocean tide and deep earth (Kuvshinov Citation2008; Schnepf et al. Citation2014). Telluric currents are dissipated as they circulate in the deep earth, and there is also a large amount of dissipation in the lateral flow of the ground surface (inside ocean) with only a small part of this circulation reaching the land.
Figure 5. A general circulation model for continental and ocean currents.
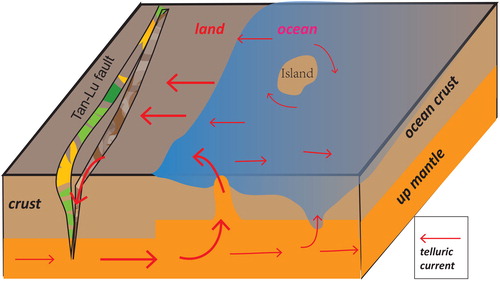
This model also discusses the existence of such low resistance channels in the eastern coastal land of China. First, the Tanlu fault zone in eastern China is a deep fault of orthonormal structure with depth of nearly 80–100 km, at least it is a lithospheric fault below the crystallization base. It is the basis of the low resistance channel of the model. Secondly, according to the estimation of magnetotelluric and heat flow data, the depth of the high conductivity layer considered in the model is only 45–50 km, which is far less than the cutting depth of the fault. Therefore, the high conductivity layer is reasonable as a low resistance current channel (Baba et al. Citation2013). Thirdly, for the Western Pacific, the Hawaiian Islands, the Japanese Islands and the Philippine Islands are all back-arc volcanic islands (Uyeda et al. Citation2000; Zheng et al. Citation2013), so the lava channel may be the path where the current rises to the surface in the model.
4.2. Island current direction
Island current is not pointed toward the mainland, but it is in highly variation. In this work, seasonal variation of current direction exists on Hainan Island of China, but it does not reach the frequencies which change several times a day, as observed on some islands in the Pacific Ocean where the direction of telluric currents change very frequent according to the results across the ocean between America and eastern islands of Japan (Orihara et al. Citation2012; Schnepf et al. Citation2014, Citation2015) and between the Aleutian Islands and New Zealand (Mather and Wescott Citation1962).
On the Hainan Island, the current direction of WNC is seasonally variable, which is caused by ocean fluctuations. Here, the seawater circulation is the fundamental reason for the seasonal change of the telluric current direction. Meanwhile, the eastern part of the Hainan island is the estuary of the Pearl River, while the differences in salinity and temperature between the freshwater river and the Beibu Gulf seawater will also cause variations in the direction of telluric current (Fang et al. Citation2003). Therefore, the main inferences of Hainan Island current may be the ocean currents (Gao et al. Citation2015; ). The cold water carried by ocean currents has low salinity and high resistance compared to ordinary seawater, consequently, it will change the normal potential distribution of seawater. The WNC station is located in the Pearl River Estuary where cold water is injected and influenced by the gulf circulation on the west side. In winter and summer, the circulation with different directions forms near Hainan Island, which drives the cold water in the Pearl River Estuary to follow the opposite direction.
Figure 6. Directions of the telluric current in the islands. (a)–(e) Seasonal sea currents around Hainan Island (Gao et al. Citation2015) and telluric current vector, (f) Geomagnetic storm-induced currents observed in the England Island Power Grid (Mckay Citation2004), (g) current vector and peripheral potential on Chongming Island.
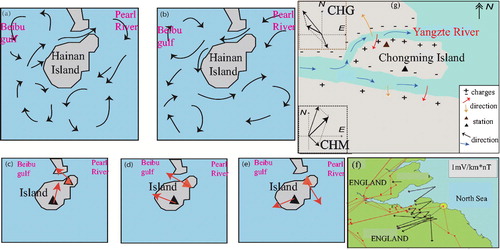
However, the direction of telluric current on Chongming Island is not time-varying characteristics. The CHM located in the southeastern region of Chongming Island is mainly affected by island and river current, the island current is toward the NE direction and the river current is toward the NNE, and the calculated current direction is in the NE direction after vector synthesis as showed. Station CHG in the middle of Chongming Island is mainly affected by two current directions, one is the island current toward the NNE direction, and the other is the river sedimentary current toward the NW direction (Wang et al. Citation2005). shows a schematic diagram of the potential generated near the Chongming Island (Anikiev et al. Citation2009), and it is seen that this Island divides the Yangtze River into two parts at its entrance to the sea. The northern part of the island has a smaller water flow and higher curved radians, and under the action of strong centrifugal force, the water flow and suspended matter in the water erode the concave bank (north bank) and accumulate on the convex bank. At this time, the suspended solids and other colloids in the water are positively charged relative to the flow zone, while those in the northern part of Chongming Island are positively charged. For the tributaries in the southern region of Chongming Island, due to the straightness and slow flow of the river, the sediments with positive charges are deposited on the south bank. The beaches on the south bank are positively charged, and the southern region of the north bank is negatively charged. So, the local current across the river points to the north, while the current on the island is toward the south.
Previous analysis so far has shown that the current caused by the centrifugal force of the river water is much larger after vectors synthesizing, the total direction of current is along the NWW direction. However, why their current vectors directions do not change greatly with the seasons? Reasons are as follows. If the reference value of the natural current is sufficiently large, the direction of the telluric current can be changed. For instance, the telluric current in the NS direction is −100 mV/km and the amplitude of the induced current excited by the storm is ±10 mV/km, then the direction of the telluric current at this site is NS. When a magnetic storm -occurs, not only its GIC of the island of England has a certain directionality (Mckay Citation2004), but also it may indicate that the loading of electromagnetic storms will cause the telluric current to reverse because of the electrodes polarizing.
5. Discussion
Studies on telluric current in the zone between land and sea are limited. Generally speaking, the current superimposed on any DC currents are induced by other processes in the geophysical environment, such as ocean tides (Lanzerotti et al. Citation1985). This may affect the deposition of heavy metal ions in still water and the stability of coastal power grids and coastal high-speed railway traction grids under geomagnetic storms, even it can destroy the cathodic protection for submarine pipelines and the steel frames of drilling platforms (Thomson et al. Citation2005; Degiorgi and Wimmer Citation2005; Liu et al. Citation2010, Citation2011, Citation2016). The present study mainly considers two GES recording by 19 stations near the coast line during storms as well as long-term data observed by XNY, HAA and CHM from 2013 to 2017. Due to the lack of electrical structure data in the inshore region of Canada, we only use data of 13 stations () along the coast of China to calculate current vectors and discuss their directivities. Furthermore, according to the location of two types of stations, the current continuity interpretation model of island and continental coastal types stations are established.
Figure 7. Position of the coastal stations in China and Canada.
The GES is a known source of global synchronization similar to geomagnetic storm. Their records can show two aspects, such as the reliability of observations and the differences related to the locations of stations. In this work, the responses of China and Canada are quite different during the two storms in 2015. Especially in RES stations (∼74°N), the amplitude of the same main phase of GES is more than 1000 mV/km, which is different in CHL station. Moreover, the wavelet energy spectra of GES can reflect the spectral recorded at different latitudes (). High-latitude stations are subject to large disturbances, wide frequency bandwidths and the main distribution of energy in a small period (16–64 min). The variations of the telluric current and geomagnetic field in low-latitude regions are mainly controlled by the current in the equatorial ring. On the contrary, these variations in high-latitude regions are controlled by the Sq current, the Sd current and part of the equatorial current collection (Thomson et al. Citation2005; William Citation2005). However, most magnetic storms occur in the Sd current, which has a weak influence on the equatorial current collection, and range of influence is mainly concentrated in high-latitude areas. In addition, the Dst index makes an obvious correlation with the proton flux and the electron flux with energies of greater than 2 MeV in the geosynchronous orbit. In contrast, the horizontal component of stable geomagnetism gradually decreases in the high-latitude region.
It can be concluded that the mid-latitude region is the least affected by electromagnetic storms, the disturbance in high-latitude regions, especially the Arctic Circle, is much greater than those in mid-latitude regions, and even those in low-latitude regions are greater than those in mid-latitude regions. This latitudinal effect is similar to the observation results of the variable magnetic field. It should be emphasized specially that the latitudinal effects of GES are not as obvious as those of geomagnetic field observations. It is mainly because observations of the geoelectric field also carry information about the secondary induction field inside the Earth. Zhang et al. (Citation2017a, Citation2017b) reported the GES statistics of more than 20 stations in mainland China, and their results presented that the storm amplitude ratio could better reflect the latitudinal effect, as the amplitude ratio method actually circumvented the influence of the differences in baseline values among stations. This further indicates that the magnitude of a GES is related to the electrical structure beneath a station; thus, it is necessary to consider the telluric current that can establish a connection with the underground electrical structure.
Here we make efforts to explain how the terrestrial telluric current is continuous with the ocean telluric current through the model. There are two kinds of influences source: land–ocean current and island current. The telluric current flows from land to ocean through the channel in depth of earth, then circulates back sea water. As shown in , there is a depth fault in eastern China, which is a channel of telluric current from surface to inner. The conducting layer in the depth of upper mantle makes telluric current flow freely. On the one hand, if the condition of attracting current is satisfied, such as a channel of lava flows and deep trenches, the inner telluric current would flow to ocean partially. But, only a little part of the ocean's telluric current flows back to land since the ocean's potential is higher than that of land. On the other hand, the directions of current on islands are different. For instance, the current vector is stable at CHM and QOZ, while it reveals quasi-seasonal variation characteristics at WNC (on Hainan Island). On the contrary, the telluric current of Chongming Island is related to the current of the Yangtze River on both sides of the island and the ion action of the sedimentary layer, as shown in .
In addition, seasonal variations of telluric current are clearly presented on Hainan Island. Currents induced by ocean tides are superimposed on GIC (Chave et al. Citation1992; Kuvshinov and Olsen Citation2006), however, Fejer et al. (Citation2007) showed that GIC was less than 30 mV/km, which was calculated by an extraordinary geomagnetic storm and ocean water conductivity data. It is difficult to change the direction of current when GIC loading. The fundamental cause of seasonal variation of telluric current is ocean current rather than GIC. For example, QOZ’s current values are all greater than 60 mV/km, which more over GIC (30 mV/km).
6. Conclusion
In this paper the differences of geoelectric storms recorded at 19 coastal stations are mainly considered at first. Then, the characteristics of both spatial distribution and time-varying of telluric current direction at 13 stations in China are analyzed. Finally, the corresponding explanatory models are established for the directional differences between island-type and coastal-type currents.
For the same GES phase, the variation range of geoelectric field in the middle latitude is small (∼100–101 mV/km), followed by the low latitude (∼101–102 mV/km), and the maximum in the high latitude (>103 mV/km). Furthermore, we find that the recorded phases and wavelet energy spectra of the stations at different latitudes are consistent, but their frequency bands of energy peak at different latitudes are different. The low-latitude regions are in low-frequency bands (64–128 min), and high-latitude regions are in high-frequency bands (32–64 min).
The current continuity between land and sea may depend on current channels, and vertical circulation occurs in some areas with deep-cutting faults. In this model, the telluric current directions of island may be affected by changes in the ocean current around island, such as the current direction of CHM, CHG and QOZ tend to be stable, whereas the direction of WNC which is located in Hainan Island manifests itself in seasonal variations.
Acknowledgments
The site resistivity and geological background data are provided by China’s geoelectric stations. The Canadian data are downloaded from http://www.geomag.nrcan.gc.ca/plot-tracee/geo-en.php. We are grateful to three anonymous referees for their comments which helped us to improve earlier version of the paper.
Disclosure statement
No potential conflict of interest was reported by the authors.
Additional information
Funding
References
- Anikiev VV, Rusakov VY, Kolesov GM. 2009. Estimation of the scale of spatiotemporal variability in the lithological and geochemical characteristics of suspended particulate matter and bottom sediments at the mouth of the Volga River and the adjacent zone of the northern Caspian. Geochem Int. 47(5):485–503.
- Baba K, Tada N, Utada H, Siripunvaraporn W. 2013. Practical incorporation of local and regional topography in three-dimensional inversion of deep ocean magnetotelluric data. Geophys J Int. 194(1):348–361.
- Berguig SM, Hamoudi M, Lemouël JL, Cohen Y. 2013. Validate global mapping of internal lunar magnetic field. Arab J Geosci. 6(4):1063–1072.
- Chave AD, Luther DS, Lanzerotti LJ, Medford LV. 1992. Geoelectric field measurements on a planetary scale: oceanographic and geophysical applications. Geophys Res Lett. 19(13):1411–1414.
- Degiorgi VG, Wimmer SA. 2005. Geometric details and modeling accuracy requirements for shipboard impressed current cathodic protection system modeling. Eng Anal Bound Elem. 29(1):15–28.
- Fang GH, Wei ZX, Cui BH, Wang K, Fang Y, Li W. 2003. Interbasin freshwater, heat and salt transport through the boundaries of the East and South China Sea from a variable-grid global ocean circulation model. Sci China Ser D. 46(2):149–161.
- Fejer BG, Jensen JW, Kikuchi T, Abdu MA, Chau JL. 2007. Equatorial ionospheric electric fields during the November 2004 magnetic storm. J Geophys Res. 112:A10304.
- Gao JS, Chen B, Shi MC. 2015. Summer circulation structure and formation mechanism in the Beibu Gulf. Sci China Earth Sci. 58(2):1–14.
- Jones FW, Ku CC, Geldart LP. 1969. Earth currents and magnetic field variations in the period range 10–200s. Geophys J Int. 17(1):15–38.
- Kuvshinov AV. 2008. 3-D global induction in the oceans and solid earth: recent progress in modeling magnetic and electric fields from sources of magnetospheric, ionospheric and oceanic origin. Surv Geophys. 29(2):139–186.
- Kuvshinov AV, Olsen N. 2006. A global model of mantle conductivity derived from 5 years of CHAMP, Ørsted and SAC-C magnetic data. Geophys Res Lett. 33:L18301.
- Lanzerotti LJ, Wolfe A, Trivedi N, Maclennan CG, Medford LV. 1990. Magnetic impulse events at high latitudes: magnetopause and boundary layer plasma processes. J Geophys Res. 95(A1):97–107.
- Lanzerotti LJ, Chave AD, Sayres CH, Medford LV, Maclennan CG. 1993. Large-scale electric field measurements on the Earth's surface: a review. J Geophys Res. 98(E12):23525–23534.
- Lanzerotti LJ, Medford LV, Maclennan CG, Thomson DJ. 1985. Measurements of the large-scale direct-current earth potential and possible implications for the geomagnetic dynamo. Science. 229(4708):47–49.
- LeMouël JL, Courtillot VE, Galdeano A. 1974. A simple formalism for the study of transformed aeromagnetic profiles and source location problems. J Geophys Res. 79(2):324–331.
- Liu CM, Wang X, Wang HM, Zhao HL. 2018. Quantitative influence of coast effect on geomagnetically induced currents in power grids: a case study. J Space Weather Space Clim. 8:A60.
- Liu CM, Lin CX, Wang X, Liu LG, Huang Cai CC. 2016. Evaluating the influence of lateral change of conductivity on the “H Polarization” of induced geoelectric field and geomagnetically induced currents. Trans China Electrotechn Soc. 31(24):113–119.
- Liu CM, Lin CX, Wang XN, Li X, Li W. 2017. Influence of coast effect on geomagnetically induced currents in power grid. Power Syst Technol. 41(8):2716–2722.
- Liu J, Saito Y, Kong X, Wang H, Xiang L, Wen C, Nakashima R. 2010. Sedimentary record of environmental evolution off the Yangtze River estuary, East China Sea, during the last 13,000 years, with special reference to the influence of the Yellow River on the Yangtze River delta during the last 600 years. Quat Sci Rev. 29(17–18):2424–2438.
- Liu LG, Ge XM, Wei Z, Zhou Y, Liu MG. 2016. Analysis of the monitoring data of geomagnetic storm interference in the electrification system of a high-speed railway. Space Weather. 14(10):754–763.
- Liu LG, Yuan L, Wang ZD, Zheng K, Feng XS. 2011. Study on the impact of magnetic storm on security of transformers in coastal nuclear plants. China Saf Sci J. 21(5):104–108.
- Mather KB, Wescott EM. 1962. Telluric currents at geomagnetically conjugate stations in the Aleutian Islands and New Zealand. J Geophys Res. 67(12):4825–4831.
- Mckay AJ. 2004. Geoelectric fields and geomagnetically induced currents in the United Kingdom. Nondestructive Test. 86(A10):8429–8434.
- Medford LV, Meloni A, Lanzerotti LJ, Gregori GP. 1981. Geomagnetic induction on a transatlantic communications cable. Nature. 290(5805):392–393.
- Orihara Y, Kamogawa M, Nagao T, Uyeda S. 2012. Preseismic anomalous telluric current signals observed in Kozu-shima Island, Japan. Proc Natl Acad Sci USA. 109(47):19125–19128.
- Serson PH. 1973. Instrumentation for induction studies on land. Phys Earth Planet Inter. 7(3):313–322.
- Shimizu H, Utada H. 2004. The feasibility of using decadal changes in the geoelectric field to probe Earth’s core. Phys Earth Planet Inter. 142(3):297–319.
- Schnepf NR, Manoj C, Kuvshinov A, Kuvshinov A, Toh H, Maus S. 2014. Tidal signals in ocean-bottom magnetic measurements of the Northwestern Pacific: observation versus prediction. Geophys J Int. 198(2):1096–1110.
- Schnepf NR, Kuvshinov A, Sabaka T. 2015. Can we probe the conductivity of the lithosphere and upper mantle using satellite tidal magnetic signals? Geophys Res Lett. 42(9):3233–3239.
- Thomson AW, McKay AJ, Clarke EReay SJ. 2005. Surface electric fields and geomagnetically induced currents in the Scottish Power grid during the 30 October 2003 geomagnetic storm. Space Weather. 3(S11002).
- Uyeda S, Nagao T, Orihara Y, Yamaguchi T, Takahashi I. 2000. Geoelectric potential changes: possible precursors to earthquakes in Japan. Proc Natl Acad Sci USA. 97(9):4561–4566.
- Wang JS, Chen L, Liu L, Deng XL. 2005. Experimental study on effect of positively charged ion in river on the velocity of sediment particles. Adv Water Sci. 16(2):169–173.
- William L. 2005. Fundamentals of geophysics. 2nd ed. England: Cambridge University Press. p. 252–276.
- Yoshino T, Manthilake G, Matsuzaki T, Katsura T. 2008. Dry mantle transition zone inferred from the conductivity of wadsleyite and ringwoodite. Nature. 451(7176):326–329.
- Zheng YF, Zhao ZF, Chen YX. 2013. Continental subduction channel processes: plate interface interaction during continental collision. Chin Sci Bull. 58(35):4371–4377.
- Zhang B, Yoshino T, Wu XP, Matsuzaki T, Shan SM, Katsura T. 2012. Electrical conductivity of enstatite as a function of water content: implications for the electrical structure in the upper mantle. Earth Planet Sci Lett. 357–358(4):11–20.
- Zhang X, Liu J, Du XB. 2017a. A model of the telluric current eddy: a case from eastern China. J Geophys Eng. 14(3):478–486.
- Zhang X, Du XB, Liu J. 2017b. Analysis of GIC and vortex current responses in Huabei region during geoelectric storms. Chin J Geophys. 60(5):1800–1810. (in Chinese)