
 ?Mathematical formulae have been encoded as MathML and are displayed in this HTML version using MathJax in order to improve their display. Uncheck the box to turn MathJax off. This feature requires Javascript. Click on a formula to zoom.
Abstract
A series of shaking table tests were conducted on unreinforced and micropiles-reinforced soil landslides to investigate the seismic response of micropiles-reinforced landslide and the dynamic mechanical behaviour of micropiles in landslide under earthquake. The test results indicate that: (1) The micropiles can raise the anti-seismic performance of landslide, and it can efficiently delay the development of earthquake landslide hazards. (2) After earthquake, the flexural failure of micropile mainly occurs in the area that 1.4–4 times pile diameter above the sliding surface and the area that 1.4–3.4 times pile diameter below the sliding surface. (3) After reinforced by micropiles, the acceleration response on the slope surface of landslide can be decreased, especially the slope toe. (4) Both thrust of sliding mass and resistance of sliding bed are mainly concentrated near the sliding surface. The dynamic bending moment distributions of the three rows of micropiles present as reverse ‘S’. The maximum bending moment of the pile above sliding surface is located at the point that 3.7 times pile diameter above sliding surface, and the maximum bending moment of the pile below sliding surface is located to the point that 1.43 times pile diameter below sliding surface.
1. Introduction
Micropiles are new type retaining structure in slope engineering, and they are defined as small-diameter (typically less than 300 mm [12 in.]), drilled and grouted replacement piles that are typically reinforced (Bruce and Juran Citation1997; Shahrour and Juran Citation2004; Sun et al. Citation2013a), and they are always designed as a group. Micropiles were first used in the 1950s in response to the demand for building foundation reinforcement (Hooshmand and Asakereh Citation2015). With the drilling equipment and technology, the applicability of micropiles has grown significantly since the mid-1980s. Because micropiles can be readily installed where access is restrictive and in all soil types and ground conditions (William and Howe Citation2010), they get a more and more extensive application in slope and landslide engineering in recent years. Such as, bruce et al. (Citation2005) described the successful use of micropiles in a slope of a dump in southern Ontario, Canada. Cullen et al. (Citation2004) successfully applied micropiles in the temporary support project near Las, Colorado, USA.
With the application of micropiles in slope and landslide projects, the research on micropiles is proceeding all along, especially for the retaining effect and mechanic characteristic of micropiles. Kazuo et al. (Citation2003) analyzed the working behaviour of the micropile group with hard caps under transverse loading through model tests. It was found that when pile spacing was large enough, the mechanic behaviour of the pile group can be studied based on the single micropile. Andrew and Boeckmann (Citation2006) conducted large-scale model tests to investigate the load transfer in micropiles, and concluded that micropiles with cap beams can greatly improve the stability of slopes. Yan et al. (Citation2011) carried out a series of model tests on the interaction between micropile and loess landslide, and studied the bearing mechanism, stress condition and failure mode of micropile in landslide. Bai et al. (Citation2016) studied the reinforcement effect on slopes reinforced with intensive micropile groups based on in situ test, and observed that the lateral soil pressures were consistent throughout each pile row in a micropile group. In addition to model test and in situ test, some design methods of micropiles have also been put forward. Reese et al. (Citation1992) described a procedure for the design of slopes reinforced with micropiles. Based on the conventional beam-column equation and existing P–y curve method, Sun et al. (Citation2013b) proposed an analytical model, which includes details about selecting micropile cross-section, estimating the length of the micropile, determining the shear capacity of micropiles, calculating pile spacing and so on.
The previous research about micropiles thus provides important guidance for studying the anti-sliding characteristic of micropiles retaining slopes and allows micropiles can be used in slope engineering more efficiently, safely and economically. However, the above-mentioned studies are mainly limited to that under static condition, and there are few researches on dynamic performance of micropiles retaining slope or landslide subjected to seismic waves. Although it is demonstrated that micropiles behave well under seismic loadings due to their high flexibility, ductility and capacity to withstand extension forces (Shahrour and Juran Citation2004; Sadek and Shahrour Citation2006; Sandra Citation2012; Wang and Mei Citation2012), these studies were mostly involved in piled foundations. Differing from pile foundation, stabilizing micropiles in slope or landslide would be essentially affected by the lateral spreading of slope (Yu et al. Citation2010). Currently, the seismic mechanism of micropiles retaining slope, dynamic behaviour and failure characteristic of micropiles are still not fully understood. Despite some valuable studies being carried out on micropiles retaining slopes under earthquake (Noorzad and Saghaee Citation2009; Wang Citation2014), the research method mainly relies on numerical simulation. Up to now, few accurate experimental data about the seismic behaviour of micropiles-slopes are available. Therefore, research on the dynamic behaviour of micropiles-reinforced slope and failure mechanism of micropiles by conducting dynamic tests is urgently required.
In response to these facts, by using similar large-scale shaking table tests, we present a series of tests on unreinforced landslide model and the micropiles-reinforced landslide model to explore the seismic performance of stabilizing micropiles in landslide under earthquake. Based on the measurements obtained from tests, seismic phenomenon, natural frequency and acceleration response of the two landslides were contrasted and analyzed, and the dynamic performance of micropiles including failure characteristic and bending moment distribution were studied, respectively.
2. Shaking table test
2.1. Shaking table test equipment and similitude law
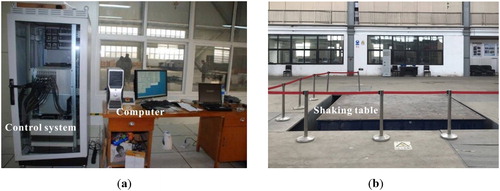
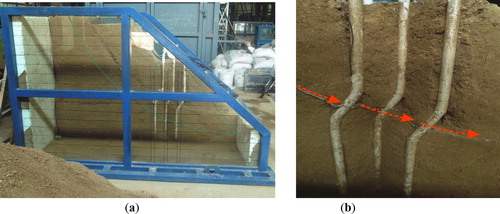
The earthquake loading was applied with the help of the large-scale shaking table established at Xi’an University of Architecture and Technology, China. presents the main equipments of the shaking table test. The carrying capacity of the table was 20,000 kg, and the input frequency range was 0.1–50 Hz. The dimensions of the table were 4.1 m × 4.1 m. The maximum input acceleration amplitudes at full load were ±1.5, ±1.0 and ±1.0 g in the X, Y and Z directions. The maximum displacements at full load were ±15, ±25 and ±10 cm in the X, Y and Z directions, respectively.
Figure 1. Shaking table apparatus: (a) control equipment; (b) shaking table.
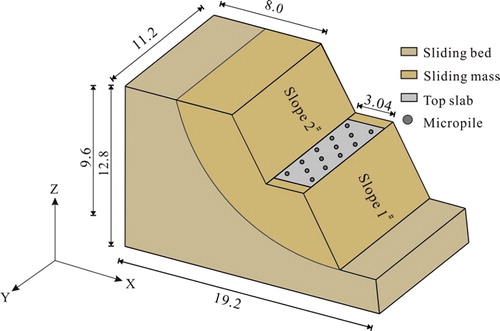
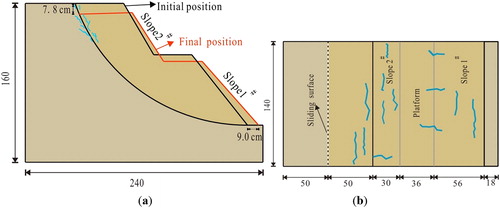
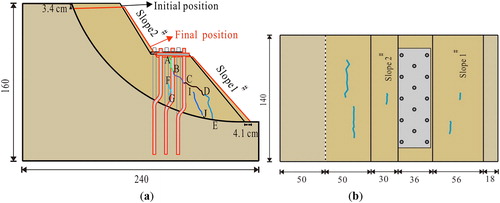
Shaking table test model was designed based on a typical homogeneous soil landslide, which was supported by three rows of micropiles (shown in ). The landslide mainly has three parts: slope 1# (slope ratio: 1:0.59), slope 2# (slope ratio: 1:0.75) and platform. The micropiles were driven vertically into the platform, and arranged as a quincunx. The micropile length and micropile diameter were 8.4 m and 28 cm, respectively. The micropile spacing and row spacing were designed to be 1.96 m (seven times pile diameter) and 1.12 m (four times pile diameter), respectively. In addition, to improve the integrity of micropiles supporting structure, the tops of each micropile were connected by top slab.
Figure 2. The prototype landslide reinforced by micropiles.
According to the dimensions and carrying capacity of the shaking table apparatus as well as the geometry size of the prototype micropile, the dimension of the model landslide was reduced by 1/8. Accordingly, the model pile length and model pile diameter were 1.05 m and 3.5 cm, respectively. The model pile spacing and row spacing were designed to be 0.245 m (seven times pile diameter) and 0.14 m (four times pile diameter) respectively. In the test, the parameters including geometry, elasticity modulus and acceleration were taken as control variables. Subsequently, the similarity laws and similarity constants for landslide can be derived based on the Buckingham π theory. According to the similarity criterion, the similarity ratios of the physical parameters between the prototype and model were deduced, as shown in .
Table 1. The similarity law and similarity ratios of the test model.
2.2. Preparation of the model landslide
In this work, two typical soil landslide models (unreinforced landslide model and micropiles-reinforced landslide model) were made. The unreinforced landslide model is a reference model, which aims to study the seismic response difference between micropiles-reinforced landslide and unreinforced landslide, and to explore how micropiles affect the seismic response of landslide.
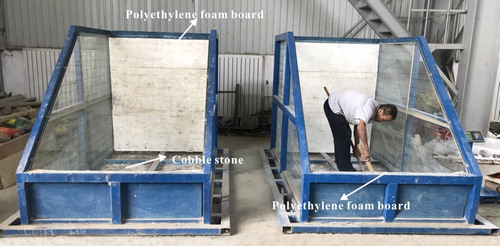
The two models were of the same size, and they were constructed independently in two identical rigid model boxes (the inner size of the model box was 2.6 m long, 1.4 m wide and 1.67 m high). The model box was supported by steel frame to improve the stiffness. To observe the dynamic deformation of the landslide, the model box was installed with transparent tempered glass on two lateral sides. Before preparation of the model landslides, an absorber made of polyethylene foam board (10 cm thick) was attached to both the front and back of the inner wall of the box to eliminate the reflection of waves and as a consequence, eliminate the boundary effect (Li et al. Citation2019), as illustrates. Additionally, to reduce the relative displacement between the soil and the box, small cobble stones were fixed on the bottom of the box.
Figure 3. Boundary condition processing.
The landslide soil used in the test was homogeneous soil, which was mainly formed of clay, barite powder, fine sand and bentonite powder at ratios of 0.5:0.3:0.06:0.14. The sliding bed and sliding mass were constructed by filling soil to the model box layer upon layer. Conventional soil mechanics tests including direct shear test, stoving test and consolidation test were performed on the soil specimens obtained from the model landslide. Main mechanical indexes of the soil specimens are listed in . The sliding zone in landslide was simulated by duplex plastic paper. The cohesive force and internal friction angle of the sliding band were 3.5 kPa and 16°, respectively.
Table 2. Main mechanical indexes of soil specimens.
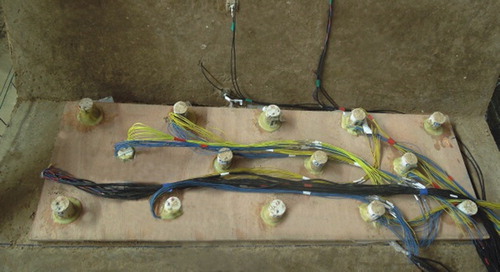
The model micropile was prefabricated pile that prepared before the test. The longitudinal steel in model micropile is aluminium material (reinforcement form: 4Φ6). The casting material of model micropile was gypsum (mwater:mgypsum = 0.7:1, and the compressive strength of casting gypsum was approximately 11.1 MPa). After 18 days of natural maintenance, marine glue was evenly smeared on the surface of micropile to improve the waterproofing quality. Furthermore, in order to simulate the interaction between micropile and soil, fine quartz was pasted on the surface of micropile, as shown in . Top slab of micropiles was simulated by the wood board with 1.8 cm thick, as shown in .
Figure 4. Test micropile.
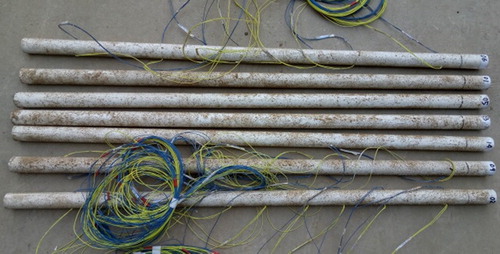
Figure 5. Top slab in test.
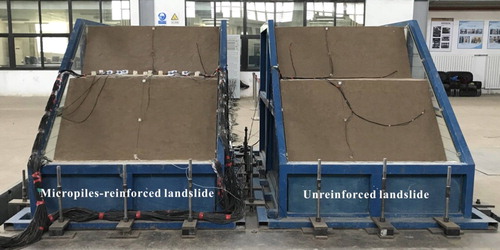
Working process of the landslide model is following: fixing test micropiles to the predesigned position → making sliding bed by ramming soil layer upon layer → making sliding surface based on sliding surface shape → placing duplex plastic paper on the sliding surface → making sliding mass → installing top slab to the tops of each micropile → fixing landslide models to the shaking table. A photograph of landslide models is displayed in .
Figure 6. Photograph of landslide models.
2.3. Measuring scheme
During the process of compaction, accelerometers (accelerometer type: PCB-33B40) were laid horizontally along two measurement directions to monitor the acceleration response of landslides at different positions. For the sake of comparing the response difference between the micropiles-reinforced landslide and the unreinforced landslide, the accelerometer layouts of the two models were exactly the same. As shown in , accelerometers A01–A06 and NA01–NA06 were laid on slope surface. Accelerometers A07–A11 and NA07–NA11 were embedded in landslide body along the vertical direction. Additionally, one accelerometer was arranged at the base of the shaking table to monitor the input acceleration.
Figure 7. Distribution of measuring points in landslide: (a) unreinforced landslide; (b) micropiles-reinforced landslide; (c) layout of micropiles (unit: cm).
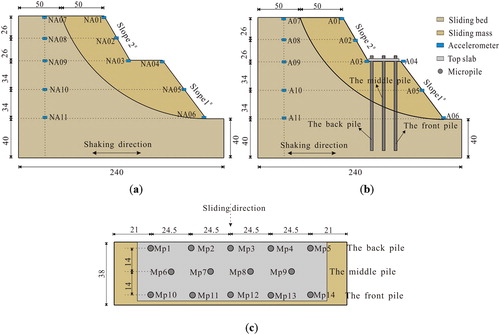
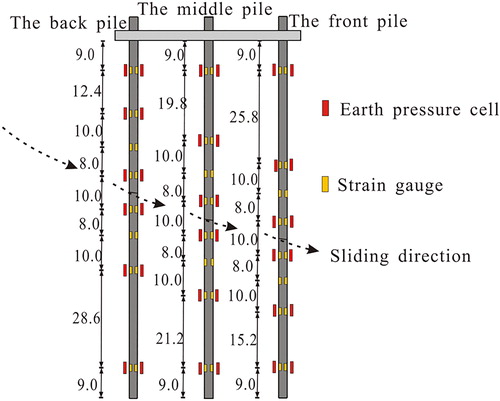
In order to study the mechanical characteristic of micropiles, two piles were selected as measuring piles in each row. Micropile Mp2 and Mp4 () were selected for the back row of piles, Mp6 and Mp9 for the middle row of piles and Mp11 and Mp13 for the front row of piles. Eight strain gauge couples (strain gauge type: BE-120) were glued on each measuring pile to monitor the dynamic bending moment distribution of micropile. Six earth pressure cell couples (earth pressure cell type: ZF380) were fixed on each measuring pile to obtain the earth pressure distribution after and before the micropile, as shown in .
Figure 8. Layout of strain gauges and cells on micropiles (unit: cm).
2.4. Loading scheme
Because horizontal earthquake is the major cause of structure destruction and it can significantly reduce the landslide stability, all seismic waves were loaded in the horizontal X direction (Li et al. Citation2019).
Seismic waves, including El Centro earthquake waves (collected from California, in 1964), Wenchuan earthquake waves (recorded in the Wolong station during the Wenchuan earthquake in China, 2008), Kobe seismic waves (obtained from Kobe earthquake in Japan, 1995) and Sinusoidal waves were simulated in the shaking table test. According to the similarity criterion and similarity constant (shown in ), input seismic waves were compressed in time axis at a compression ratio of 4. The duration of sinusoidal waves was set to 12 s. Acceleration time history curves and Fourier spectrums of the compressed El Centro wave, Wenchuan wave and Kobe wave in test are displayed in . In order to study the seismic response of landslides under different loading amplitudes, the acceleration amplitude of input wave was adjusted to 0.1, 0.2, 0.3, 0.4, 0.6 and 0.8 g (1 g = 9.80665 m/s2), respectively. Furthermore, to obtain the natural frequency of the landslide model, white noises were loaded after the acceleration loading amplitude was changed. The test loading sequence is listed in .
Figure 9. Acceleration time history and Fourier spectrum of El Centro wave: (a) acceleration time history; (b) Fourier spectrum.
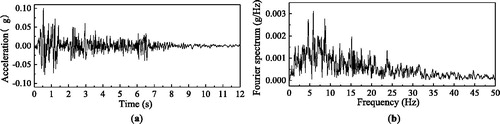
Figure 10. Acceleration time history and Fourier spectrum of Wenchuan wave: (a) acceleration time history; (b) Fourier spectrum.
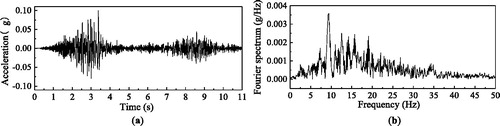
Figure 11. Acceleration time history and Fourier spectrum of Kobe wave: (a) acceleration time history; (b) Fourier spectrum.
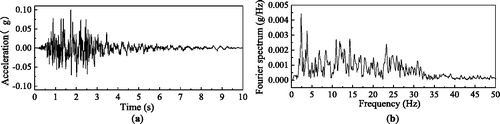
Table 3. The test loading sequence.
3. Results and discussion
3.1. Test phenomenon and failure characteristic
3.1.1. Unreinforced landslide
After the loading amplitude of 0.1 g, the unreinforced landslide model was almost nothing changed. After 0.2 g Kobe wave (the shaking event of Ko-2), there were some hairline cracks along the sliding surface at the top part (. After 0.2 g 12 Hz sinusoidal wave (S-12-2), the sliding mass slid quickly along the sliding surface, and the slope toe moved 8.0 cm horizontally. Meanwhile, many cracks appeared on slope surface (. After 0.3 g Wenchuan wave (Wen-3), the slope toe moved 9.0 cm horizontally in total and the settlement of slope crest up to 7.8 cm. After 0.4 g El Centro wave (El-4), the sliding mass was blocked by the front baffle of the model box, and the observation of the unreinforced landslide was stopped.
Figure 12. Test phenomenon of the unreinforced landslide model: (a) side view; (b) top view (unit: cm).
3.1.2. Micropile-reinforced landslide
During the loading amplitudes of 0.1–0.2 g, the reinforced landslide had no obvious damage phenomenon. After 0.3 g Kobe wave (Ko-3), a tension crack A–B (about 4 cm long) was observed between piles (see . After 0.4 g El Centro wave (El-4), the crack A–B extended to point C. Meanwhile, the reinforced landslide started to slide. The slope toe moved 0.6 cm horizontally and the settlement of the crest was 0.4 cm. Under 0.4 g Wenchuan wave (Wen-4), the crack A–B–C continued to wide and extended downwards to point D. Meanwhile, new cracks E–F and I–J appeared, and a few cracks were found on slope surface (. The accumulative total displacement of slope toe was 3 cm and the cumulative settlement of the crest was 2.3 cm. After 0.6 g El Centro wave (El-5), the sliding mass continued to slide slowly. After 0.8 g Kobe wave (Ko-6), the accumulative total displacement of slope toe was 4.1 cm, and the settlement of crest reached to 3.4 cm.
Figure 13. Test phenomenon of the micropile-reinforced landslide model (a) Side view; (b) Top view (unit: cm).
Comparing the time when sliding mass started to slide and the sliding distance of the two landslides: the unreinforced landslide slid after 0.2 g, however, the micropiles-reinforced landslide slid at 0.4 g. The slope toe of the unreinforced landslide moved 9 cm ultimately, whereas the reinforced landslide moved 4.1 cm. In addition, the sliding velocity of the micropiles-reinforced landslide was much smaller than that of the unreinforced landslide. Therefore, the micropiles structure can raise the anti-seismic performance of the landslide, and it can efficiently delay the development of landslide hazards in earthquake-prone zones.
In order to observe the dynamic failure characteristic of micropiles after earthquake, the reinforced landslide model was excavated after test. shows the damaged landslide and micropiles. It can be seen that the failure modes of all three rows of micropiles present reverse ‘S’-type, and they have two flexural shear failure zones near sliding surface. Concretely speaking, the flexural failure area above the sliding surface mainly occurred in the range of 1.4–4 times pile diameter above the sliding surface, and the damage part of pile is convex toward the slope toe. There is no obvious damage phenomenon above the flexural failure area to the pile top. The flexural failure area below the sliding surface mainly occurred in the range of 1.4–3.4 times pile diameter below the sliding surface, and the damage part of pile is convex backward the slope toe. There is no obvious damage phenomenon below the flexural failure area to the pile bottom. Such kind of failure characteristic of the micropiles is mainly due to that the micropile is a small diameter pile which belongs to a flexible structure. When the sliding mass slides, shear movement between sliding mass and sliding bed occurs near the sliding surface, and the micropile above the sliding surface moves forward along with sliding mass. Consequently, there are two flexural deflections near the sliding surface.
Figure 14. Photographs of the damaged micropiles-reinforced landslide and micropiles: (a) profile of the damaged reinforced landslide; (b) the damaged micropile.
3.2. Natural frequency of the landslide
The change of natural frequency of the landslide model can sensitively reflect the effect of seismic excitation on landslide. In this test, based on the acceleration response of landslide under white noises, the natural frequency can be calculated by Transfer Function Method. The transfer function is shown in EquationEquation (1)
(1)
(1)
(1)
(1)
where
is the cross-power spectral density function between the acceleration response in landslide and the acceleration response on shaking table;
is the self-power spectral density function of acceleration response on shaking table. The natural frequency can be identified by amplitude analysis method based on the results of transfer function
(Lin et al. Citation2015; Li et al. Citation2019). shows the change of natural frequency of the two landslide models during shaking.
Figure 15. Natural frequency of the landslide.
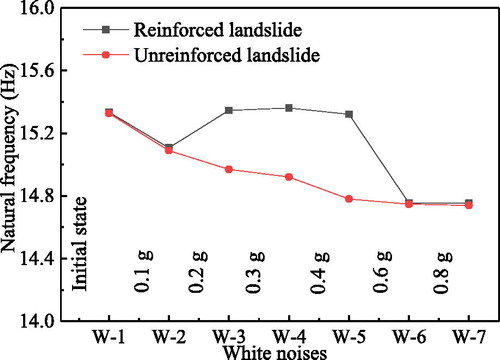
Unreinforced landslide: the natural frequency of the unreinforced landslide decreases from 15.32 to 14.75 Hz with the increase of loading amplitude. The natural frequency of the landslide at the final state is nearly 3.72% smaller than that at the initial condition. Such phenomenon is mainly caused by the fact that the dynamic shear modulus of landslide decreases, and the landslide soil becomes looser than the initial soil. The change of natural frequency of the unreinforced landslide agrees well with most unreinforced slopes researched by many scholars (Lin and Yang Citation2013; Liu et al. Citation2014).
Micropiles-reinforced landslide: similar to unreinforced landslide, after the loading of 0.1 g seismic waves, the natural frequency of the reinforced landslide decreases from 15.32 to 15.08 Hz, and the natural frequency of the two landslides is almost the same at the initial state (W-1) and at the condition after 0.1 g (W-2). It is because that the rigidity of micropiles is fairly small, it has no effect on improving the rigidity of landslide as other retaining structures with high rigid. However, after 0.2 g (W-3), the natural frequency of the reinforced landslide suddenly increases to 15.32 Hz, which is due to the fact that the interaction between pile and soil is strengthened, and the integrity of the landslide is improved compared to unreinforced landside. During 0.3–0.4 g (W-4–W-5), the existence of micropiles restrains the decrease of the natural frequency, as a consequence, the natural frequency remains stable. After 0.6 g, although the landslide is supported by micropiles, cracks in landslide and the damage of micropiles are increasingly prominent under high intensity seismic waves. Consequently, the natural frequency of the reinforced landslide decreases again, and it reaches to 14.72 Hz, which is close to the natural frequency value of the unreinforced landslide. After 0.8 g, the natural frequency stabilizes at 14.72 Hz.
By comparing the natural frequency of the two landslides, it can be seen that micropiles structure cannot increase the natural frequency of landslide immediately like the anchoring structure or other retaining structures (Yu et al. Citation2010; Lin et al. Citation2015). However, as the loading amplitude increases, the anti-seismic action of micropiles is gradually strengthened, and the natural frequency of the landslide can also be improved like other retaining structures unless the pile is damaged completely.
3.3. Acceleration response analysis
Intense acceleration amplification is closely related with slope deformation and regarded as an intrinsic factor inducing landslide failure under earthquake (Yang et al. Citation2017). In this study, the Peak Ground Acceleration (PGA) amplification factor here is defined by the ratio of the peak acceleration amplitude measured at any monitoring point to that monitored at the shaking table.
Because the sliding mass of the unreinforced landslide accumulated on the front baffle of the model box at 0.4 g, and the front baffle might have an influence on the seismic response of the unreinforced landslide, this paper does not study the acceleration response of the unreinforced landslide during 0.4–0.8 g. To analyze the acceleration response of two landslides, the acceleration response of the landslide under Wenchuan waves is typically studied. and , respectively, show the PGA amplification factor distribution of the unreinforced landslide and the micropiles-reinforced landslide under Wenchuan waves.
Figure 16. PGA amplification factor distribution of the unreinforced landslide: (a) on slope surface; (b) in landslide body.
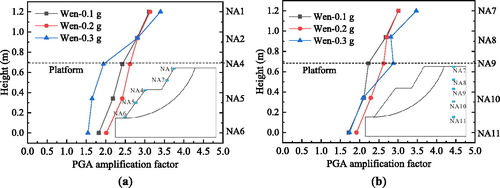
Figure 17. PGA amplification factor distribution of the micropiles-reinforced landslide: (a) on slope surface; (b) in landslide body.
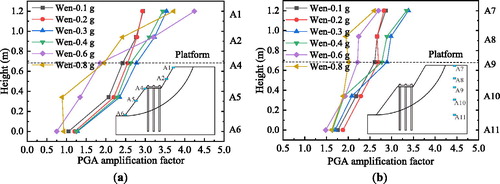
As observed from and , whether in the unreinforced landslide or in the micropiles-reinforced landslide, whether on the slope surface or in the landslide body, even no matter how much the loading amplitude, the PGA amplification factors of the two landslides are greater than 1.0. This indicates that the landslide presents obvious amplification effect on input seismic waves. Moreover, the PGA amplification factor increases along the height of landslide, and it reaches a maximum at the top of the landslide, which is similar to the observations in other slopes studied by previous researchers (Meunier et al. Citation2008; Fan et al. Citation2016; Srilatha et al. Citation2016).
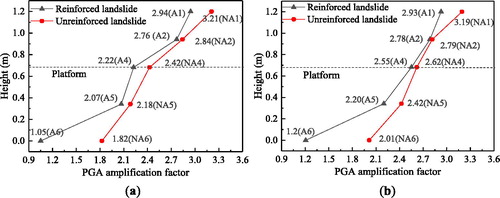
In order to investigate the acceleration response differences between the two landslides, and explore how micropiles affect the acceleration response of landslide, the acceleration response of the landslide under Wenchuan waves is typically studied. As mentioned above, at 0.3 g, the sliding mass of the unreinforced landslide was already sliding, while the micropiles-reinforced landslide was stable. As a result, the acceleration measuring points in sliding mass of the two landslides are not at the same elevation at 0.3 g and later, so in the study, only the acceleration response of the two landslides at 0.1 and 0.2 g are compared.
compares the PGA amplification factors on slope surface of the two landslides. At 0.1 g, from the slope crest to the slope toe, the PGA amplification factor of the measuring point in the micropiles-reinforced landslide is decreased by 8.4%, 2.8%, 8.3%, 5.0% and 42.3% compared to that of the unreinforced landslide (. At 0.2 g, from the slope crest to the slope toe, the PGA amplification factor of the measuring point on slope surface of the reinforced landslide is decreased by 8.2%, 0.4%, 2.7%, 9.1% and 40.3% compared to that of the unreinforced landslide (. Therefore, it is concluded that the acceleration response at the slope surface can be decreased after reinforced by micropiles, especially at slope toe. The primary reason may be that: when the seismic wave transmits into landslide, the interface friction function between micropiles and soil can partly dissipate the seismic energy.
Figure 18. Comparison of PGA amplification factor on slope surface between unreinforced landslide and micropiles-reinforced landslide: (a) at 0.1 g; (b) at 0.2 g.
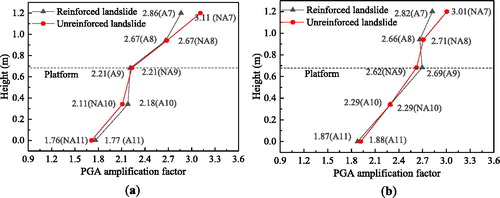
Meanwhile, the PGA amplification factors inside the two landslide bodies are also compared, as depicted in . Inside the landslide body, apparently, the PGA amplification factor at the top of sliding bed in the micropiles-reinforced landslide is smaller than that of the unreinforced landslide. After reinforced by micropiles, the PGA amplification factor at the top part is decreased by 8.4% and 8.2% at 0.1 and 0.2 g, respectively. However, there is not much difference at other parts. It means that the acceleration response at the top part of landslide body can be decreased to some extent after reinforced by micropiles, while the acceleration response at other parts cannot be decreased.
Figure 19. Comparison of PGA amplification factor in landslide body between unreinforced landslide and micropiles-reinforced landslide: (a) at 0.1 g; (b) at 0.2 g.
3.4. Dynamic earth pressure difference of micropiles
Earth pressure difference applied to micropiles is of special importance to the design and safety evaluation of piles. To understand the distribution of earth pressure difference of micropiles, the dynamic maximum earth pressure difference of the three rows of piles under Wenchuan waves are typically illustrated and compared, as shown in . Note that, in this test, the previous earth pressure produced before was removed by data acquisition device after each excitation in order to consider only the dynamic components of the pressure, and earth pressure difference is defined as the difference of the pressure after micropile minus the pressure before micropile.
Figure 20. Dynamic earth pressure difference under Wenchuan waves with different acceleration amplitudes: (a) the back pile Mp2; (b) the middle pile Mp6; (c) the front pile Mp11.
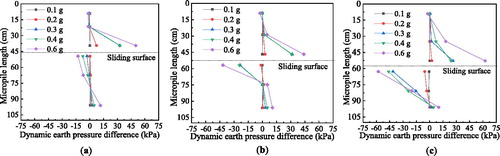
As for the pile above the sliding surface, it can be observed that the distribution of earth pressure difference of the three rows of piles follows a triangle shape with a very small value at the top. The earth pressure difference of the upper two measuring points is very small, while the earth pressure difference near the sliding surface shows a larger positive value, which indicates that the thrust of sliding mass is mainly concentrated near the sliding surface. During 0.1–0.2 g, since the landslide is in a stable state, the soil integrity of the landslide is good, and the earth pressure difference values of the three rows of piles are relatively small, the earth pressure difference of the back pile slightly greater than that of the front two piles. During 0.3–0.4 g, the landslide enters the limit equilibrium state and the instability state successively, and the earth pressure difference suddenly increased, especially the back two rows. The earth pressure difference ratio of the back pile, middle pile and front pile is about 1:1:0.75. So it can be seen that the thrust of sliding mass applied to the back two piles is greater than that of the front pile when landslide is in stable state and the limit equilibrium state. At 0.6 g, the landslide slides rapidly, the earth pressure of the three rows of piles is readjusted, and the earth pressure difference of the back pile and the front pile increases rapidly, while the middle pile has a little change. It may be related to the formation of soil cracks near the front pile (see ), as above described in Section 3.1, during 0.6 g, the crack A–B–C–D–E and I–J develop rapidly. The formation of soil cracks destroyed the integrality and continuity of the soil. When seismic wave propagates to the crack, it would be reflected repeatedly, and then, the dynamic response of soil around the cracks was increased. So the front pile is in a stronger dynamic response environment. As a result, at 0.6 g, the earth pressure difference ratio of the back pile, middle pile and front pile is about 1:0.86:1.24.
As for the pile below the sliding surface, although the distribution of earth pressure difference of the three rows of piles is slightly different, the earth pressure difference of the bottom two measuring points is small, and the earth pressure difference near the sliding surface shows a larger negative value. It indicates that the resistance of sliding bed is also mainly concentrated near the sliding surface. In fact, the change of earth pressure value of pile below sliding surface is greatly affected by the deformation of the pile above sliding surface. When landslide slides, the deformation of the upper pile leaves the pile below sliding surface having a tendency of deforming in the opposite direction. During 0.1–0.2 g, the distribution of earth pressure difference values of the three rows of piles are all small and basically equal. However, after 0.3 g, the front pile bears the largest resistance of sliding bed, and the middle pile is second. While the front pile bears the smallest resistance.
Overall, by analyzing the distribution of earth pressure difference of all the three rows of micropiles under earthquake, it is concluded that both the thrust of sliding mass and the resistance of sliding bed is mainly concentrated near the sliding surface.
3.5. Dynamic bending moment of micropiles
The dynamic bending moment is employed to investigate the deformation behaviour of the micropiles in landslide subjected to seismic waves. Note that the initial offsets of bending moment caused by soil self-weight were removed in order to obtain pure dynamic moments. In this test, the bending moment could be calculated as EquationEquation (2)(2)
(2)
(2)
(2)
In which, M is bending moment, Es denotes elasticity modulus of micropile, W is the section modulus in bending. ε1 is the strain of test point on the front surface of the micropile (in order for easy analysis, the front surface of the micropile is defined as the surface towards to the slope toe, and the rear surface is defined as the surface backwards to the slope toe). ε2 is the strain of test point on the rear surface of the micropile.
In order to study the dynamic bending moment properties of the three rows of piles, the maximum bending moment distribution of the back pile Mp2, the middle pile Mp6 and the front pile Mp11 (shown in ) under Wenchuan waves at 0.1–0.6 g are typically analyzed and compared (note that at 0.8 g, the bending moment of micropile dramatically increases, and some strain gauges were inoperative), as shown in .
Figure 21. The dynamic maximum bending moment distribution of the micropile. (a) The back pile Mp2; (b) the middle pile Mp6; (c) the front pile Mp11.
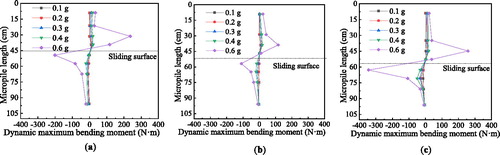
As seen in , from top to bottom, the dynamic bending moments distribution of the three rows of piles follows a reverse ‘S’-type approximatively. The pile above the sliding surface mainly produces positive bending moment, and the maximum bending moment is observed at the point that 13 cm (approximately 3.7 times pile diameter) above the sliding surface. The pile below the sliding surface mainly produces negative bending moment, and the maximum bending moment is observed at the point that 5 cm (approximately 1.43 times pile diameter) below the sliding surface. During 0.1–0.2 g, because the micropiles subject to minor loads, they deforms in the elastic range. Whether above or below the sliding surface, the bending moment values of micropiles are rather small. During 0.3–0.4 g, the landslide enters the limit equilibrium state and the instability state successively, the bending moments piles are increased only slightly. However, at 0.6 g, because the landslide slides rapidly, the earth pressure of the three rows of piles is increased quickly, the bending moment values of the three rows of piles are greatly increased. In this condition, the maximum positive bending moment ratio of the back pile, middle pile and the front pile is 1:0.49:1.1, and the maximum negative bending moment ratio is 1:0.55:1.72. It can be seen that both the front pile and the back pile bear the greater bending moment at higher loading amplitude.
Based on the dynamic earth pressure difference distribution, dynamic bending moment response, and dynamic failure mode of micropiles described above, it can be concluded that the stress of micropile is relatively large in a certain range near the sliding surface. In the seismic design of the micropiles in landslide, it is very necessary to strengthen the reinforcement ratio of the flexural failure area that 1.4–4 times pile diameter above the sliding surface and the area that 1.4–3.4 times pile diameter below the sliding surface. In addition, the back pile and the front pile should be particularly paid attention in high-intensity earthquake area.
4. Conclusions
To reveal the seismic response of the micropiles-reinforced landslide and the dynamic mechanical characteristic of micropiles under earthquake, a series of shaking table model tests were performed on two soil landslide models: unreinforced landslide and micropiles-reinforced landslide. The test phenomenon during excitation, the change of the natural frequency and the acceleration response of the two landslides were compared. Moreover, the failure characteristic, dynamic earth pressure difference distribution and dynamic bending moment of micropiles were discussed respectively. Based on the previous analysis, several main conclusions are drawn as follows:
Micropiles structure can raise anti-seismic performance of the landslide, and it can efficiently delay the development of landslide hazards. After earthquake, all three rows of micropiles produce flexural failure near the sliding surface, and the flexural failure of micropile mainly occurs in the area that 1.4–4 times pile diameter above the sliding surface and the area that 1.4–3.4 times pile diameter below the sliding surface. There is no significant damage in other part of the micropile.
No matter whether in unreinforced landslide or in micropiles-reinforced landslide, whether on slope surface or in sliding bed, even no matter how much the loading amplitude, the landslide presents obvious amplification effect on seismic waves, and the PGA amplification factor increases along the height of landslide. Additionally, it is found that the acceleration response on the slope surface can be decreased after reinforced by micropiles, especially at the slope toe. However, in sliding bed, the micropiles have no obvious reducing effect on the acceleration response except the top part.
By analyzing the distribution of earth pressure difference of the three rows of micropiles under earthquake, it is concluded that both the thrust of sliding mass and the resistance of sliding bed is mainly concentrated near the sliding surface. Because of this characteristic, the dynamic bending moments of all the three rows of micropiles present as reverse ‘S’-type from top to bottom. More specifically, the pile above the sliding surface mainly produces positive bending moment, and the maximum bending moment is observed at the point that 13 cm (approximately 3.7 times pile diameter) above the sliding surface. The pile below the sliding surface mainly produces negative bending moment, and the maximum bending moment below the sliding surface is located at the point that 5 cm (approximately 1.43 times pile diameter) below the sliding surface.
In the seismic design of the micropiles, it is very necessary to strengthen the reinforcement ratio of the area that 1.4–4 times pile diameter above the sliding surface and the area that 1.4–3.4 times pile diameter below the sliding surface. In addition, the front pile and the back pile should be particularly paid attention in high-intensity earthquake area.
Disclosure statement
No potential conflict of interest was reported by the authors.
Additional information
Funding
Related Research Data
References
- Andrew Z, Boeckmann. 2006. Load transfer in micropiles for slope stabilization from test of large-scale physical models. Columbia: University of Missouri-Columbia.
- Bai MZ, Du YQ, Wang XQ, Qiu SM, Tian G. 2016. In situ study on the combined strengthening effects of intensive micropile groups and anchor-cable ground beam on subgrade slopes of existing roads. Int J Earth Sci Eng. 9:1038–1048.
- Bruce DA, Juran I. 1997. Drilled and grouted micropiles: State-of-practice review. Washington, DC: US Federal Highway Administration. Publication FHWA-RD-96-017.
- Bruce DA, Cadden AW, Sabatini PJ. 2005. Practical advice for foundation design-micropiles for structural support. GSP 131 Contemporary Issues in Foundation Engineering. ASCE. 1–25.
- Cullen J, Herring W, Zietlow W, Berger D, Macklin PR. 2004. Case history: micropile use for temporary excavation support. Proceedings of Sessions of the Geosupport Conference: Innovation and Cooperation in Geo. Reston: Geotechnical Special Publication, ASCE.
- Fan G, Zhang JJ, Wu JB, Yan KM. 2016. Dynamic response and dynamic failure mode of a weak intercalated rock slope using a shaking table. Rock Mech Rock Eng. 49(8):3243–3256.
- Hooshmand H, Asakereh A. 2015. Analyzing the behavior of micro-pile in sandy soils using numerical method. Int J Sci Eng Invest. 4:47–49.
- Kazuo K, Yin YB, Yoshitaka M. 2003. Single beam analogy for describing soil-pile group interaction. Soil Dyn Earthq Eng. 23:31–39.
- Li N, Wang BQ, Men YM, Liu NN, Liu XL, Gao O. 2019. Dynamic behavior of soil anchorage landslide at different frequencies. Geomat Nat Hazards Risk. 10(1):271–286.
- Lin YL, Leng WM, Yang GL, Li L, Yang JS. 2015. Seismic response of embankment slopes with different reinforcing measures in shaking table tests. Nat Hazards. 76(2):791–810.
- Lin YL, Yang GL. 2013. Dynamic behavior of railway embankment slope subjected to seismic excitation. Nat Hazards. 69(1):219–235.
- Liu HX, Xu Q, Li YT. 2014. Effect of lithology and structure on seismic response of steep slope in a shaking table test. J Mt Sci. 11(2):371–383.
- Meunier P, Hovius N, Haines JA. 2008. Topographic site effects and the location of earthquake induced landslides. Earth Planet Sci Lett. 275(3–4):221–232.
- Noorzad R, Saghaee GR. 2009. Seismic analysis of inclined micropiles using numerical method. International Foundation Congress and Equipment Expo Contemporary Topics in Deep Foundations, ASCE. 406–413.
- Reese LC, Wang ST, Isenhower WM. 1992. Use of drilled shafts in stabilizing a slope. Stabil Perform Slopes Embank. 2:1318–1332.
- Shahrour I, Juran I. 2004. Seismic behaviour of micropile systems. Ground Improve. 8(3):109–120.
- Sun SW, Wang JC, Bian XL. 2013a. Design of micropiles to increase earth slopes stability. J Cent South Univ. 20(5):1361–1367.
- Sun SW, Zhu BZ, Wang JC. 2013b. Design method for stabilization of earth slopes with micropiles. Soil Found. 53(4):487–497.
- Sadek M, Shahrour I. 2006. Influence of the head and tip connection on the seismic performance of micropiles. Dyn Earthq Eng. 26(5):461–468.
- Sandra E. 2012. Experimental study of the effect of inclined pile on the seismic behavior of pile group. Soil Dyn Earthq Eng. 42:275–291.
- Srilatha N, Madhavi LG, Puttappa GG. 2016. Seismic response of soil slopes in shaking table tests: effect of type and quantity of reinforcement. Int J Geosynth Ground Eng. 2(4):33.
- Wang ZY, Mei GX. 2012. Numerical analysis of seismic performance of embankment supported by micropiles. Marine Georesour Geotechnol. 30:52–62.
- Wang D. 2014. Research on micropiles to earthquake load. Chengdu: Southwest Jiaotong University. (in Chinese).
- William K, Howe SM. 2010. Micropiles for Slope Stabilization. Biennial Geotechnical Seminar ASCE. 78–90.
- Yan JK, Yin YP, Men YM, Liang J. 2011. Model test study of landslide reinforcement with micropile groups. China Civil Eng J. 44:120–128 (in Chinese).
- Yu YZ, Deng LJ, Sun X, Lü H. 2010. Centrifuge modeling of dynamic behavior of pile-reinforced slopes during earthquakes. J Cent South Univ Technol. 17(5):1070–1078.
- Yang GX, Qi SW, Wu FQ, Zhang ZF. 2017. Seismic amplification of the anti-dip rock slope and deformation characteristics: a large-scale shaking table test. Soil Dyn Earthq Eng. 9:1–10.