
 ?Mathematical formulae have been encoded as MathML and are displayed in this HTML version using MathJax in order to improve their display. Uncheck the box to turn MathJax off. This feature requires Javascript. Click on a formula to zoom.
Abstract
Guangdong Province is the most populous and economically developed province in southeastern China. Tropical cyclones, rainstorm waterlogging, and geohazards are the principal natural hazards in this region. Using information acquisition analysis, entropy weighting, the ArcGIS technique, the concept of hazard chains, the spatial heterogeneity of hazards, vulnerability, and ecological risk from single hazards and multi-hazards were determined for grids of 1 × 1 km2; the ecological risks for each administrative city were ranked. Jiangmen City was the top one ranking in the 21 cities with highest ecological risks for multi-hazards, tropical cyclones, and rainstorm waterlogging; Qingyuan City was the highest one for the ecological risk of geohazards. Areas with grades of very high, high, moderate, low, and very low ecological risk accounted for 1.78%, 7.10%, 18.22%, 34.39%, and 38.51% of Guangdong Province, respectively. Most areas of Guangdong Province had favorable ecological environments and low ecological risks. Natural hazard assessment greatly benefits from ArcGIS because spatial methodologies can be fully explored during the entire risk evaluation process, from data integration to risk appraisal, and finally for decision-making. This study concludes that integrated approaches to multi-hazard assessment may assist in risk management of natural hazards in Guangdong Province in southeastern China.
1. Introduction
A review by Kappes et al. (Citation2012) reported that the first use of the term “multi-hazard” was presented in Agenda 21 (UNEP Citation1992), and Kappes et al. (Citation2012) first defined “multi-hazard” in a risk reduction context as the totality of relevant hazards in a defined area. Thus, the joint investigation of two or more processes is indispensable when one event could trigger a second process. However, whether a hazardous process is relevant depends on the specific setting of the respective area and the objective of the study (Kappes et al. Citation2012). As is common for an area or territory, several coexisting hazards may potentially interact and generate a cascade or synergy effect (Barrantes Citation2018). Thus, irrespective of whether the cascade results from hazard chains (Xu et al. Citation2014) or is produced exogenously, the synergy effect can worsen the disaster.
Unfortunately, hazard assessment has generally been conducted separately by specialists in each field (Barrantes Citation2018). Consequently, single-hazard analyses are not easily commensurable because of the different scales and criteria involved. To solve this problem, a higher level of comprehensive risk assessment for multi-hazards is strongly recommended, especially for areas prone to multi-hazards.
Disaster risk is the expected loss expressed as the product of the hazard and vulnerability of the elements at risk (UNDHA Citation1992; Alexander Citation1993; Liu et al. Citation2002; Kappes et al, Citation2012). Currently, multi-hazard risk analyses are challenging because few studies and empirical evidence are associated with them, and standard approaches remain unavailable (Kappes et al. Citation2012). Although some progress was made in this domain (Zhou et al. Citation2015), complex quantification remains puzzling because multi-hazard risk analyses are not just a simple sum of single-hazard risks; however, they are based on the results of single-hazard risk assessment.
Ecological risk refers to the negative consequences of potential disastrous events on the ecosystems and their components. Ecological risk assessment is the evaluation of the possibility and degree of such negative consequences. Negative consequences may comprise adverse changes to a part of the ecosystems under external stresses or to the structure and function of the whole ecosystems. Fortunately, ecological risk assessment initiatives have received strong support on various scales by environmental agencies in many developed countries since the 1990s (Villa and McLeod Citation2002). The US Environmental Protection Agency started the first comprehensive ecological risk assessment, which has produced a number of influential results (Williams and Kapustka Citation2000). Most achievements have quantified ecological vulnerability in reference to a specific ecosystem and particular stressor.
The health of ecosystems is inevitably related to their involved natural hazards. Healthy ecosystems may attenuate the influence of natural hazards and reduce the damages they pose to ecological environments (Brang Citation2001). Thus, a stable ecosystem, as a natural buffer, is lower in cost of construction and maintenance but more effective at disaster prevention and mitigation than traditional civil engineering (Renaud et al. Citation2013). By contrast, poorly designed disaster management can harm the ecosystem health and weaken the buffer effect against extreme events, and to remedy such defective design would be enormously costly in terms of time and money (Bradshaw et al. Citation2007).
Although disaster risk and ecosystem management have distinct action modes and targeted benefits, they are both generally aimed at the safety, well-being, and sustainable development of human society. Consequently, the integration of the management of ecosystems and disaster risks, that is, integrated approaches to comprehensive ecological multi-hazard assessment, should be considered essential for disaster risk reduction to increase the common benefits brought to decision-makers charged with both types of management. Therefore, this study applied a single method to integrate techniques for assessing and ranking single-hazard and multi-hazard risks. These findings might provide practical guidelines and methodological applications for multi-hazard prevention and environmental conservation.
2. Study area and data sources
Guangdong Province, located on the coast of the South China Sea, has a tropical and subtropical monsoon climate and territorial area of 175,756 km2 covered mainly by forests, cultivated lands, and coastal wetlands. Currently, Guangdong Province has a permanent population of 113.46 million by the end of 2018 with abundant light, heat, and water resources, and it is the most populous and economically developed province in China. However, Guangdong Province also faces multiple natural hazards, such as tropical cyclones (including typhoons), rainstorm waterlogging (including floods), and geohazards (including landslides, collapses, and debris flows); specifically, typhoons pose the most prominently natural hazard in Guangdong Province (). In this work, the three principal hazards of tropical cyclones, rainstorm waterlogging, and geohazards were studied. The basic data from observation, statistics, grid, text, and vector used for this study are listed in .
Figure 1. Location of study area and routes of tropical cyclones affecting Guangdong Province during 2005–2015. Source: Author
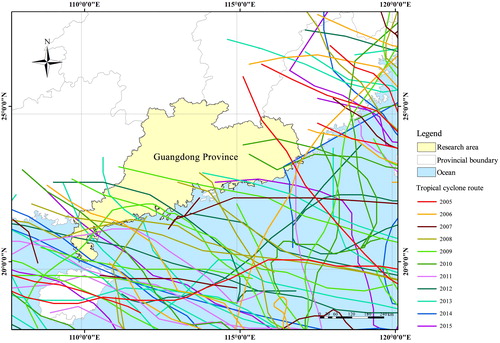
Table 1. Basic data and sources.
3. Hazard assessment methods and results
Many well-established approaches are available for single hazards, but hazard characteristics and the related assessment methods differ; thus, the assessment results are also measured differently (Kappes et al. Citation2012). However, integrated assessment of multi-hazards should be based on single-hazard assessments. Therefore, the comparability of assessments for single hazards is crucial and should be thoroughly considered when conducting integrated evaluation of multi-hazards.
3.1. Hazard assessment for tropical cyclones
Damages resulting from tropical cyclones are mainly caused by strong winds and heavy rainfall. The accompanying rainfall during tropical cyclones enhances the effects of the winds; the direct influence of rainfall from tropical cyclones may be attributed to damages from rainstorm waterlogging (Zhang and Li Citation2007). Thus, we considered two definitions for tropical cyclones based on the Beaufort scale: a central wind force greater than 7-grade, called “near gale,” with a velocity of 13.9–17.1 m/s and a central wind force of 10-grade, called “whole gale,” with a velocity of 24.5–28.4 m/s. Using these definitions and applying wind circle radius equations (Deng Citation2014), we established the effect areas of tropical cyclones through the ArcGIS buffer technique.
The wind circle radius of a 7-grade on the Beaufort scale is calculated as
(1)
(1)
The wind circle radius of a 10-grade on the Beaufort scale is calculated as
(2)
(2)
where WCR7 and WCR10 are the wind circle radii of tropical cyclones for near gale and whole gale, respectively (km), and V is the central maximum wind velocity of the tropical cyclone (m/s).
Using EquationEquations (1)(1)
(1) and Equation(2)
(2)
(2) , the wind circle radii of 7-grade and 10-grade of tropical cyclones were calculated, and the influence range of each tropical cyclone was obtained through buffer analysis. If the wind speeded above 7-grade, the wind radii of 7-grade and 10-grade should be calculated respectively.
For the effect areas of tropical cyclones, a grid of 1 × 1 km2 was chosen as the basic unit for the spatial measurement through the ArcGIS space connection technique. The 1 × 1-km2 grid numbers affected by the near gales (7-grade) and whole gales (10-grade) during 2005–2015 were counted, respectively. These were also the frequency numbers for each grid affected by the near gales and whole gales of tropical cyclones. After determining the frequency numbers, we need to assign the intensities of the tropical cyclones. Because the destruction of tropical cyclones majorly produced from their wind energy, thus based on kinetic energy theorem, wind energy is proportional to the square of wind speed. Hence the energy of 10-grade whole gales is approximately 3 times of the energy of 7-grade near gales. Therefore, we assigned the weight (intensity coefficient) of 10-grade whole gales as 3, and the weight (intensity coefficient) of 7-grade near gales as 1. The weighted sum for each grid in the extents of 10-grade and 7-grade wind radii (the area of 7-grade wind radius should subtract the overlapped area of 10-grade wind radius) was defined as the catastrophic index of tropical cyclones (EquationEquation (3)(3)
(3) ):
(3)
(3)
where CITC represents the catastrophic index of tropical cyclones in a grid, N7 and N10 represent the number of 7-grade near gales and 10-grade whole gales during 2005–2015, respectively, affecting a grid.
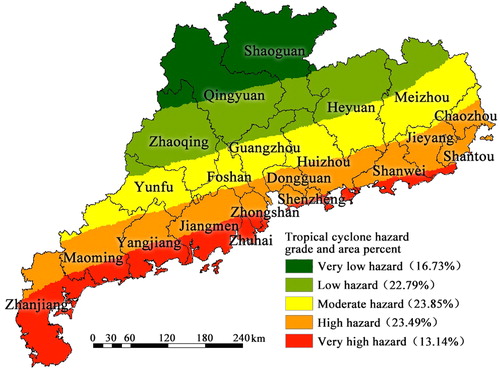
For Guangdong Province, 175,756 grids of 1 × 1 km2 were counted, and their CITC values for all tropical cyclones were recorded with the highest of 1493 and the lowest of 63. For hazard comparison, the CITC values were normalized between 0 and 1. Normalization is a mathematical method to transform the minimum value of a series of data into 0 and to transform the maximum value of the series of data into 1; the other data values are ranged 0–1. In this study, we defined the normalized CITC value as the hazard of tropical cyclones (HTC). Thus, the tropical cyclone hazard value ranged from 0 to 1. Through the ArcGIS natural breakpoint technique, hazard values were divided into five grades: very low hazard (0–0.2), low hazard (0.2–0.37), moderate hazard (0.37–0.54), high hazard (0.54–0.71), and very high hazard (0.71–1). We thus obtained a hazard map containing the information of both frequency and intensity for tropical cyclones in Guangdong Province (). The catastrophic indices and hazard grades of tropical cyclones gradually decrease from the coast to inland areas; the hazard boundaries are nearly parallel and are directly correlated with the tropical cyclone intensity and number of landfalls on the coast of Guangdong.
Figure 2. Spatial differentiation of the hazard of tropical cyclones in Guangdong Province. Source: Author
3.2. Hazard assessment for rainstorm waterlogging
Rainstorm waterlogging is commonly measured using precipitation data. Using the ordinary Kriging method to spatially interpolate daily rainfall at 37 benchmark and basic meteorological stations in Guangdong Province during 2005–2015, through the ArcGIS space analysis technique, we redistributed the rainfall data from each grid and classified rainstorm waterlogging as mild (precipitation of 50–100 mm/d), moderate (precipitation of 100–200 mm/d), and severe (precipitation of >200 mm/d) (National Science and Technology Commission Citation1998). We then counted the mild, moderate, and severe rainstorm waterlogging events in each grid, and referring to the scheme provided by the National Science and Technology Commission (Citation1998), established the catastrophic index of rainstorm waterlogging as follows:
(4)
(4)
where CIRW represents the catastrophic index of rainstorm waterlogging in each grid; NMI, NMO, and NSE represent the number of mild, moderate, and severe rainstorm waterlogging events during 2005–2015, respectively; kMI, kMO, and kSE represent the intensity coefficients for NMI, NMO, and NSE, respectively. Referring to the values and their ratios of mild rainstorm (precipitation 50–100 mm/d), moderate rainstorm (precipitation 100–200 mm/d), and severe rainstorm (precipitation >200 mm/d), we assigned kMI as 1, kMO as 2, and kSE as 4, respectively.
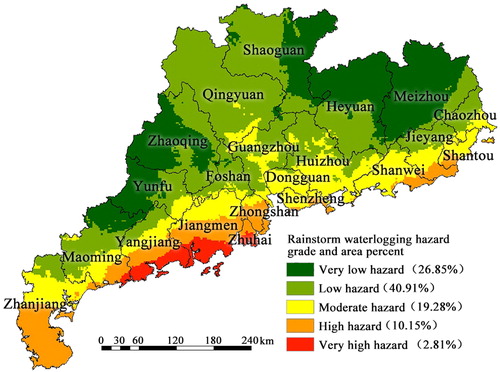
For Guangdong Province, 175,756 grids of 1 × 1 km2 were counted, and their CIRW values were recorded. For hazard comparison, the CIRW values were normalized between 0 and 1. In this study, we defined the normalized CIRW value as the hazard of rainstorm waterlogging (HRW). Thus, the rainstorm waterlogging hazard value ranged from 0 to 1. Through the ArcGIS natural breakpoint technique, the hazard value was divided into five grades: very low hazard (0–0.13), low hazard (0.13–0.23), moderate hazard (0.23–0.35), high hazard (0.35–0.54), and very high hazard (0.54–1). We thus obtained a hazard map for rainstorm waterlogging in Guangdong Province (). The overall spatial pattern of rainstorm waterlogging hazard indicates that hazard on the coast is higher than that in the interior, the hazard in the southwest of the coastal region is higher than that in the northeast of the coastal region; and the hazard in the central eastern region is higher than that in the eastern and western regions.
Figure 3. Spatial differentiation of the hazard of rainstorm waterlogging in Guangdong Province. Source: Author
3.3. Geohazard assessment
Information acquisition analysis (a statistical prediction method derived from information theory) has been widely used in spatial prediction for geohazard analysis. Observed index values derived from the geological and geographical environments are transformed into information values reflecting geological stability or instability. The information values of the indices can then be used to indicate the probability of geohazards. The information value is calculated as follows (Du et al. Citation2016):
(5)
(5)
where Ii is the information value of index i, Ni is the number of grids for index i within the geohazard area, N is the total number of grids in the geohazard area, Si is the number of grids for index i in the study area, S is the total number of grids in the study area, and i is the type of index.
For each grid, the overall information value is the sum of the information values of all indices:
(6)
(6)
where IGH is the information value in each grid; the other symbols are the same as those in EquationEquation (5)
(5)
(5) .
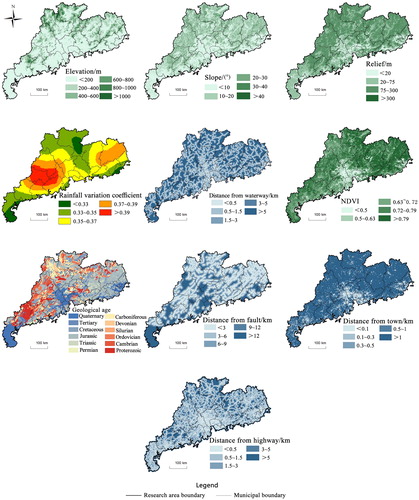
Based on the previous studies (Liu et al. Citation2002; Liu and Lei Citation2003), Evaluating the three aspects of geographical environment, geological structure, and human activities, a total of ten indices namely elevation (Tian et al. Citation2016), slope modified from Tian et al. (Citation2016), relief (Chen et al. Citation1991), rainfall variation coefficient (Equisection method), distance from waterway (Du et al. Citation2016), normalized-difference vegetation index (NDVI) (Natural breakpoint method), geological age modified from Tian et al. (Citation2016), distance from fault (Tian et al. Citation2016), distance from town (Du et al. Citation2016), and distance from highway (Du et al. Citation2016) were chosen for the assessment of geohazards ().
Figure 4. Geohazard assessment indices for Guangdong Province. Source: Author
Using EquationEquations (5)(5)
(5) and Equation(6)
(6)
(6) with the ArcGIS calculation technique, we acquired the information value for each index (). In Guangdong Province, the most geohazardous conditions for the evaluated indices are elevation of 200–400 m, slope of 10°–20°, relief of 75–300 m, rainfall variation coefficient of 0.37–0.39, distance from waterway of <0.5 km, NDVI of 0.63–0.72, Silurian stratum, distance from fault of <3 km, distance from town of 0.1–0.3 km, and distance from highway of <0.5 km.
Table 2. Information values from geohazard assessment for Guangdong province.
In total, 175,756 IGH values were recorded for Guangdong Province. For hazard comparison, IGH values were normalized between 0 and 1. In this study, we defined the normalized IGH value as the hazard of geohazards (HGH). Thus, the geohazard value ranged from 0 to 1. Through the ArcGIS natural breakpoint technique, the hazard was divided into five grades: very low hazard (0–0.36), low hazard (0.36–0.51), moderate hazard (0.51–0.62), high hazard (0.62–0.73), and very high hazard (0.73–1). We thus obtained a geohazard map of Guangdong Province (). The high-hazard areas are mainly in the northeast and south of the province, whereas the low-hazard areas are located mainly in the southwestern peninsula, the Pearl River Delta, and eastern coastal areas.
Figure 5. Spatial differentiation of the hazard of geohazards in Guangdong Province. Source: Author
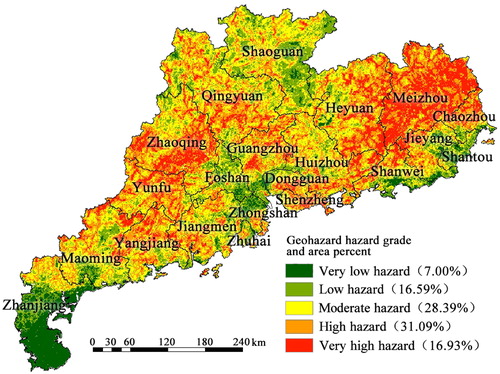
The rationality of geohazard assessment can be tested using the actual geohazard distribution with the five grades of hazard. Geohazard catalogue database in Guangdong Province comprises 1631 geohazards, including landslides, collapses, and debris flows, on different scales for 2005–2015. Through the ArcGIS subset extraction technique, 10% of the geohazards (i.e. 163 geohazards) were randomly selected as testing samples for the rationality test of geohazard assessment (). The rationality test involved calculating the (1) percentage of total area for each hazard grade (AP), (2) percentage of geohazards for each hazard grade (NP), and (3) ratio RG of the two (RG = NP/AP, G =I,II,III,IV,V). If RI < RII < RIII < RIV < RV, rationality was confirmed (Liu and Miao Citation2018). reveals that the geohazard assessment results for Guangdong Province are reasonable.
Figure 6. Geohazard distribution in Guangdong Province. Source: Author
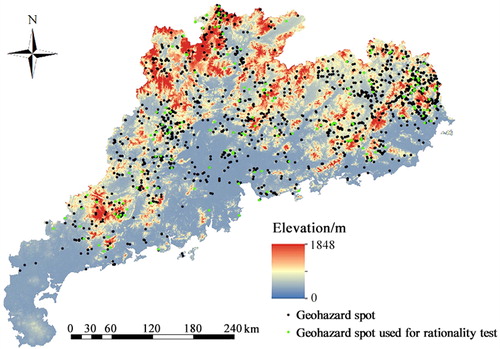
Table 3. Geohazard assessment rationality results for Guangdong province.
3.4. Integrated multi-hazard assessment
The threats of tropical cyclones, rainstorm waterlogging, and geohazards constitute a complex hazard chain. Tropical cyclone brings strong winds and heavy rainfall, torrential rainfall causes flooding and waterlogging, and rainstorm triggers geohazards. As a result, the hazard cascade produces more numerous and destructive disasters (Xu et al. Citation2014). As Barrantes (Citation2018) noted, the traditional method of map overlapping is not always reasonable, because it ignores hazard interactions. Therefore, we adopted the weighted sum of normalized hazard values for tropical cyclones, rainstorm waterlogging, and geohazards for the comprehensive quantitative assessment of multi-hazards in Guangdong Province.
During 2005–2015, the numbers and economic losses from tropical cyclones, rainstorm waterlogging, and geohazards in Guangdong Province are presented in . The average yearly economic loss for a single tropical cyclone averaged 2.704 billion RMB (approximately $389 million USD); for a single rainstorm waterlogging, the loss was 811 million RMB; and for a single geohazard, the loss was less than 1 million RMB. The disaster classification of five-level scheme in China (National Science and Technology Commission Citation1993) considers economic loss of more than 10 billion RMB as level I, 10–1 billion RMB as level II, 1 billion to 100 million RMB as level III, 100 million to 10 million RMB as level IV, and less than 10 million RMB as level V. As the aforementioned, tropical cyclone economic loss yearly averaged 2.704 billion RMB belonging to level II; rainstorm waterlogging economic loss yearly averaged 811 million RMB belonging to level III; geohazard economic loss less than 1 million RMB belonging to level V. Therefore, if we assigned 5, 4, 3, 2, and 1 to represent the disaster intensities corresponding with levels I, II, III, IV, and V, we thus may obtained 4, 3, and 1 as the weight numbers for tropical cyclones, rainstorm waterlogging, and geohazards, respectively, and their weight coefficients were 0.5, 0.375, and 0.125, correspondingly. Thus, the integrated hazard assessment for tropical cyclones, rainstorm waterlogging, and geohazards is given by
(7)
(7)
where HC is the comprehensive multi-hazard value (0–1), HTC is the hazard of tropical cyclones (normalized CITC value), HRW is the hazard of rainstorm waterlogging (normalized CIRW value), and HGH is the hazard of geohazards (normalized IGH value).
Table 4. Numbers and economic losses from natural hazards in Guangdong province during 2005–2015.
EquationEquation (7)(7)
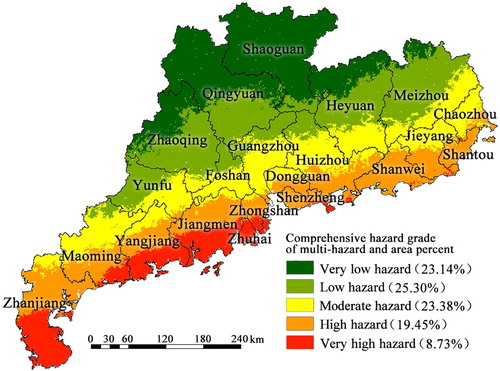
(7) was used to calculate HC for each grid of 1 × 1 km2; thus, a total of 175,756 HC values were recorded for Guangdong Province. By using the ArcGIS natural breakpoint technique, HC values were divided into five grades: very low hazard (0–0.19), low hazard (0.19–0.32), moderate hazard (0.32–0.45), high hazard (0.45–0.60), and very high hazard (0.60–1). We thus obtained the comprehensive hazard map for multi-hazards in Guangdong Province (). The spatial pattern of the comprehensive hazard was similar to the spatial distribution of the hazard of tropical cyclones, showing a trend of gradual decline from the coast to the interior, with irregular boundaries approximately parallel to the coastline.
Figure 7. Spatial differentiation of the comprehensive hazard of tropical cyclones, rainstorm waterlogging, and geohazards in Guangdong Province. Source: Author
4. Vulnerability assessment methods and results
Benefits derived from ecosystems receive increasing attention in ecological research. However, ecosystems in the many areas of the world remain vulnerable to natural hazards. Vulnerability assessment of ecosystems can provide strategic planning initiatives with valuable insight into environmental management. Because there is no deterministic relationship between vulnerability and ecosystems, an indicator-based assessment of potential vulnerability is commonly used (Villa and McLeod Citation2002).
4.1. Vulnerability indicators, weight coefficients, and ecological vulnerability
Ecological vulnerability refers to the sensitivity, fragility, and postdisaster recovery ability of ecosystems in response to external stresses. Ecological vulnerability is closely related to ecosystem characteristics and the degree of interference from natural hazards and human activities. Therefore, ecological vulnerability is usually considered the responses of ecosystems to natural hazards or human activities. Because of the spatial heterogeneity of relevant natural and human elements, different regions suffer different degrees of damages when subjected to the same intensity of external stresses.
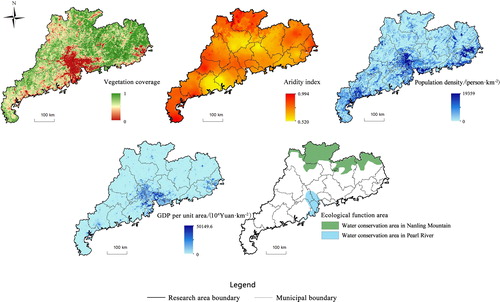
Therefore, four indicators reflecting ecosystem characteristics, water and heat conditions, and human activities were chosen for ecological vulnerability assessment: vegetation coverage, aridity index, population density, and gross domestic product (GDP) per unit area. Moreover, ecological function areas have advantages for maintaining the ecological balance and disaster reduction because of the optimized management and priority protection provided by the authorities; thus, ecological vulnerability is certainly attenuated in ecological function areas. Therefore, the vulnerability of territory covered by an ecological function area was reduced by one grade.
Data on vegetation coverage were obtained from the NDVI calculated using the binary image method (Lü et al. Citation2018). NDVIs were derived from the Geospatial Data Cloud (www.gscloud.cn) MODND1M China NDVI in 2010 and displayed with 500 × 500-m2 grids. After resampling the data, we obtained the vegetation coverage for grids of 1 × 1 km2 for Guangdong Province. Vegetation coverage was a negative indicator of ecological vulnerability. Aridity data were collected from the Resource and Environmental Science Data Cloud Platform of the Chinese Academy of Sciences (www.resdc.cn). The aridity index used average values from the past 50 years with 500 × 500-m2 grids based on 1915 meteorological stations in China in 2017; the aridity index subdataset was resampled to generate data for 1 × 1-km2 grids for Guangdong Province. The aridity index was a positive indicator of ecological vulnerability. Population density and GDP per unit area in 2010 were also collected from the Resource and Environmental Science Data Cloud Platform of the Chinese Academy of Sciences (www.resdc.cn) with 1 × 1-km2 grids, and the subdatasets of Guangdong Province were used in this study; population density and GDP per unit area were positive indicators of ecological vulnerability. Data on ecological function areas were vector data jointly published by the Ministry of Ecological Environment and Chinese Academy of Sciences in 2008. China contains 50 principal ecological function areas, including two water conservation areas in the Nanling Mountains (north of Guangdong Province) and in the Pearl River Delta (south of Guangdong Province), respectively ().
Figure 8. Vulnerability assessment indicators and ecological function areas in Guangdong Province. Source: Author
In information theory, entropy is a measure of uncertainty and is inversely proportional to the randomness and degree of system order. Entropy weighting is an objective weighting method because it depends only on the discretization of data (Liu and Duan Citation2018). Therefore, entropy weighting was used to calculate the indicator weights for assessing ecological vulnerability in our study. The calculation procedures were as follows:
Define Xij to be the value for grid i (i = 1, …, n, n = 175,756) and indicator j (j = 1, …, m, m = 4).
To compare different indicator values, normalize the Xij values (0–1) for each indicator in all grids; for positive indicators, use EquationEquation (8)
(8)
Calculate the proportions (Pij) of
Calculate the entropy value (ej) of indicator j.
Calculate the information entropy redundancy (dj) of indicator j.
Calculate the weight coefficient (wj) of indicator j.
As mentioned previously, aridity index, population density, and GDP per unit area were positive indicators, and vegetation coverage was a negative indicator. Thus, EquationEquation (8)
Calculate ecological vulnerability (V) for each indicator in all grids.
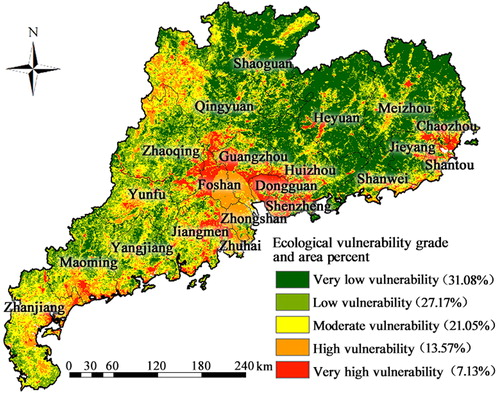
In this study, the V value was defined as the ecological vulnerability (0–1), and a total of 175,756 V values were recorded for Guangdong Province. Through the ArcGIS natural breakpoint technique, V values were divided into five grades: very low vulnerability, low vulnerability, moderate vulnerability, high vulnerability, and very high vulnerability. If a territory was covered by ecological function area, its vulnerability was lowered one grade. We thus obtained the ecological vulnerability map of Guangdong Province (). Guangdong Province was dominated by low- and very-low-vulnerability areas. The moderate- and high-vulnerability areas were distributed in mainly the northwest, northeast, and southwestern coastal areas; the Pearl River Delta and eastern coastal zones were areas with concentrated distributions of very high vulnerability.
Figure 9. Ecological vulnerability of Guangdong Province. Source: Author
4.2. Potential losses of ecosystem
The potential losses suffered by ecological risk may be considered the damages to ecosystem services. Ecosystem services usually include physical and nonphysical components, which can be aggregated into ecological assets (Xu et al. Citation2011). In our study, the ecological assets were used to represent the potential losses of the ecosystems.
Ecological assets were assigned monetary values in this study. Costanza et al. (Citation1997) first proposed the concept of ecosystem service value, and calculated the ecosystem service value for the entire biosphere to be an average of US$33 trillion (1012) per year based on the estimation of economic value for world’s 17 ecosystem services of 14 biomes. These innovative ideas and methods encouraged international scholars to do their domestic and specific studies. Xie et al. (Citation2008) calculated nine ecosystem services of six biomes incorporated with China’s terrestrial ecosystems and natural capital stocks, and obtained the equivalent value per unit area of China’s ecosystem services per year, which was higher than Costanza et al.’s (Citation1997), but this was not surprised as Costanza et al. (Citation1997) stated that their estimation must be considered a minimum estimate. Afterwards, Xie et al. (Citation2015) added two ecosystem services (a total of 11 ecosystem services) of the six ecosystem types and recalculated the total ecosystem service values of China to be CNY 38.10 trillion per year, and among them, the forest ecosystem service was the highest with a value of CNY 17.53 trillion per year, accounting for 46.00% of the total, and followed by water (21.16%), grassland (19.68%), wetland (6.75%), and arable land (6.41%).
The data of ecosystem types were derived from the GLC2000 dataset of the European Space Agency from the Geospatial Data Cloud (www.gscloud.cn), which were produced from global land cover data extracted from SPOT4 remote sensing by the GLC2000 project. Guangdong Province has 11 types of ecosystems according to Zhu et al.’s (Citation2007) classification of 22 types of ecosystems, and among them, forests form the majority accounting for 73.08% of the total area. For the sake of feasibility and applicability in this study, we adopted the scheme of Zhu et al. (Citation2007) to calculate the ecological assets associated with Guangdong’s terrestrial ecosystems. Zhu et al.’s (Citation2007) classification of 22 types of ecosystems was based on the land cover types on China’s nationwide territory, using remote sensing technique, and combined with ecological method, the ecological assets of China’s terrestrial ecosystems in 1992, 1995, and 2000 were respectively measured by their complicated ecological asset remote sensing calculation model.
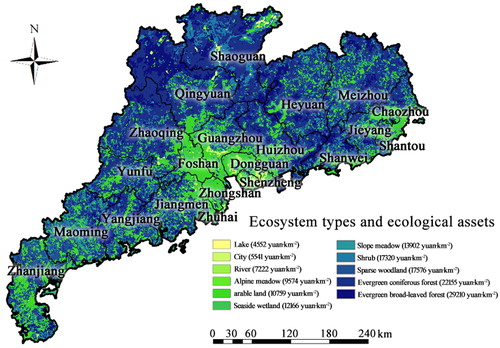
Ecological asset values include natural resource value and ecosystem service value. The former was calculated by market price value method based on the vegetation biomass; the later was obtained through shadow engineering method, market price method, and opportunity cost method (Zhu et al. Citation2007). The data used for ecological asset values were based on meteorological, remote sensing (using remote sensing image data to make ecological system type division and surface product estimation), ground observational and statistical data. For Guangdong Province, we used the mean of ecological asset values in 1992, 1995, and 2000 given in Zhu et al.’s (Citation2007) paper for China to calculate Guangdong’s ecological asset values. We thus obtained the ecological asset map of Guangdong Province (). The ecological assets exhibit a spatial distribution of low value in the south and high value in north of the province, and the low-value ecological assets are distributed mainly in the Pearl River Delta, southwestern peninsula, and eastern coastal areas.
Figure 10. Ecological assets in Guangdong Province. Source: Author
5. Integrated assessment of ecological risk
Risk results from the combination of hazard and vulnerability of the elements at risk (Alexander Citation1991; Liu et al. Citation2002; Kappes et al. Citation2012). For single hazards in each grid, the ecological risk may be expressed as the product of single hazard, ecological vulnerability, and ecological assets. For multi-hazards in each grid, the comprehensive ecological risk may be expressed as the product of comprehensive hazard, ecological vulnerability, and ecological assets.
Ecological risk from tropical cyclones (RTC) is calculated by
(15)
(15)
Ecological risk from rainstorm waterlogging (RRW) is calculated by
(16)
(16)
Ecological risk from geohazards (RGH) is calculated by
(17)
(17)
Comprehensive ecological risk from tropical cyclones, rainstorm waterlogging, and geohazards is calculated by
(18)
(18)
where RC is comprehensive ecological risk (0–1), HC is comprehensive hazard (0–1), V is ecological vulnerability (0–1), and L is the normalized value of ecological assets (0–1). The other symbols are the same as those used previously.
Using EquationEquations (15)–(18) combined with EquationEquations (7)(7)
(7) and Equation(14)
(14)
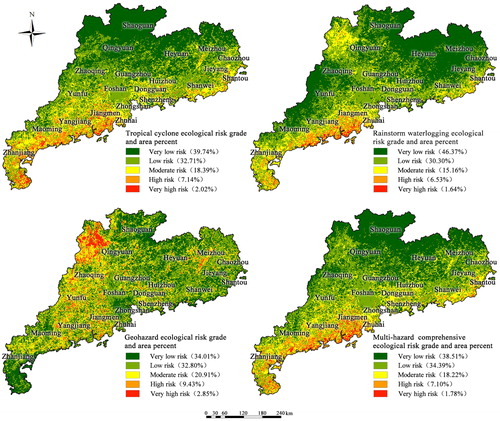
(14) incorporated with the normalized value L of ecological assets presented in , we acquired RTC, RRW, RGH, and RC values for each grid of 1 × 1 km2. Thus, a total of 175,756 RTC, RRW, RGH, and RC values were recorded for Guangdong Province, respectively. By using the ArcGIS natural breakpoint technique, they were divided into five grades: very low risk, low risk, moderate risk, high risk, and very high risk. For RTC, the grade values were 0–0.07, 0.07–0.14, 0.14–0.23, 0.23–0.37, and 0.37–1, respectively; for RRW, the grade values were 0–0.04, 0.04–0.08, 0.08–0.15, 0.15–0.26, and 0.26–1, respectively; for RGH, the grade values were 0–0.10, 0.10–0.17, 0.17–0.26, 0.26–0.38, and 0.38–1, respectively; for RC, the grade values were 0–0.05, 0.05–0.11, 0.11–0.18, 0.18–0.30, and 0.30–1, respectively. We thus obtained three ecological risk maps for tropical cyclones, rainstorm waterlogging, and geohazards as well as a comprehensive ecological risk map for multi-hazards in Guangdong Province ().
Figure 11. Ecological risks for tropical cyclones, rainstorm waterlogging, and geohazards as well as comprehensive ecological risk for multi-hazard in Guangdong Province. Source: Author
6. Ecological risk ranks
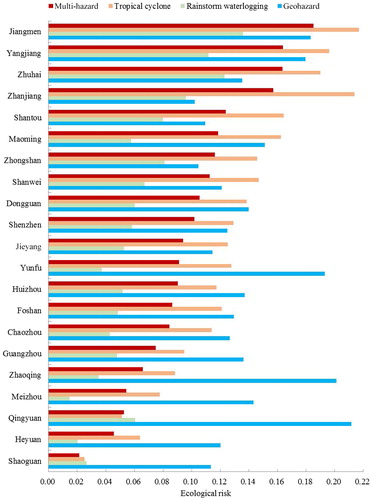
Ecological risk assessment on a regional scale can benefit strategic planning of hazard control. Considering the administrative region as the assessment unit is an option for local authorities to reduce ecological risks, the risk rankings may present a suitable solution for this application. Therefore, by averaging the values of single and comprehensive ecological risks for all grids in every city, we obtained ecological risks for single hazards and multi-hazards as well as their ranks for 21 administrative cities of Guangdong Province. The results are shown in (top-down ranking according to the ecological multi-hazard risk from the largest to the smallest). As known from , Jiangmen City has the highest ecological risks for multi-hazards, tropical cyclones, and rainstorm waterlogging; Qingyuan City has the highest ecological risk for geohazards; while in mountainous city Shaoguan, the ecological risks for multi-hazards and tropical cyclones are the lowest, and mountainous city Meizhou has lowest ecological risk for rainstorm waterlogging; in coastal plain city Zhanjiang, the ecological risk for geohazards is the lowest.
Figure 12. Ecological risk ranks for the administrative cities of Guangdong Province. Source: Author
7. Discussion
A large scale of integrated regional ecological risk on multi-ecosystems under multi-disasters for national assessment in China (including Guangdong Province) conducted by Xu et al. (Citation2011, Citation2015) should been discussed here. Xu et al.’s (Citation2011, Citation2015) work contained ten types of disasters including tropical cyclones, rainstorm waterlogging, and geohazards, while the hazards of the disasters were simplified as their occurrence frequencies. The vulnerability of environment was mixed with six indicators of elevation, slope, amplitude, vegetation coverage, aridity index, and population density, except the latter three, the other indicators were not the same as in our study. Xu et al.’s (Citation2011, Citation2015) assessment was based on nationwide 22 ecosystems (land cover types), and the ecological assets were also calculated using the scheme of Zhu et al. (Citation2007). Thus compared with our study, Xu et al.’s (Citation2011, Citation2015) spatial scale, disaster type, assessing index, research method, and integrated assessment results displayed differently from our present study. As we know, there were no similar findings published before involved in integrated assessment of ecological multi-hazard risk focused on Guangdong Province. Thus this study may exhibit a better understanding on multi-hazard chain and synergy consequences in Guangdong Province, so as to better practice for disaster management.
Assessment of natural hazards has received increasing interest. Nevertheless, few studies have applied quantitative approaches to integrated assessment of multi-hazards based on the ideas of hazard chains and synergy effects. Chen et al. (Citation2003) integrated an assessment for bushfire risk through the geographic information system technique, but this integrated approach particularly referred to data integration, risk assessment, and decision-making; however, the concepts of complex hazard and overall risk were also mentioned. In our study, to explore ways to reduce ecological risk, we applied a set of operable schemes and equations using information acquisition analysis, entropy weighting, ecosystem asset estimation, and the ArcGIS technique to assess the single hazards from tropical cyclones, rainstorm waterlogging, and geohazards as well as the comprehensive multi-hazards in Guangdong Province of southeastern China.
Recently, interest targeting ecosystems for ecological risk reduction has greatly increased, even though considerable uncertainty remains regarding the roles of ecosystems in attenuating natural hazards (Kobayashi and Mori Citation2017). Much discussion involves the concepts and discrepancies of vulnerability; however, an overarching definition describes vulnerability as a potential for loss and outlines vulnerability as a function of exposure, sensitivity, and adaptive capacity (Füssel Citation2007). However, little is known about how to specify and quantify multi-hazard vulnerability, especially for ecological hazards, because information on the vulnerability of specific assets or individual elements at risk is generally lacking (Galli and Guzzetti Citation2007). Therefore, we proposed an indicator-based vulnerability assessment linked to the concepts of ecosystem services and ecological assets to evaluate ecological vulnerability quantitatively for Guangdong Province.
Risk results from the interaction between a hazardous agent and a vulnerable environment (Alexander Citation1997; Chen et al. Citation2003). The general equation: risk = hazard × vulnerability × potential loss (of elements) can be used to elaborate the relationship among these concepts. Based on the risk equation, it was demonstrated that areas of high and very high comprehensive ecological multi-hazard accounted for 8.88% of Guangdong Province, and were concentrated in the southwestern peninsula and coastal areas; this was mostly attributed to the frequent activities of tropical cyclones. Although strong winds gradually slow down from the coast to interior after tropical cyclone landfall, the heavy rainfall caused by tropical cyclones can still generate inland waterlogging and initiate geohazards such as landslides, collapses, and debris flows in hilly areas. Thus, the cascade of “tropical cyclone →rainstorm waterlogging→geohazard” can produce a tremendous synergistic effect. Therefore, comprehensive evaluation of multi-hazards is helpful for reducing the natural hazards in Guangdong Province.
8. Conclusions
In Guangdong Province, tropical cyclones are the most dangerous natural hazard, and followed by rainstorm waterlogging. Tropical cyclones and rainstorm waterlogging show that the hazards gradually decreases from the coastal to the inland, and the high hazardous areas are concentrated in southwestern coastal zones, while Geohazards widely distributes in mountain areas, as well as the high hazardous areas are concentrated in the inland hilly areas.
The high vulnerable zones of ecological environment are mainly distributed in the Pearl River Delta, while the low vulnerable zones are mainly distributed in the hilly areas of northeastern Guangdong. Forestland ecosystems are the main contributors to the ecological assets of the province. The vulnerability of ecological environment is closely related to the spatial distribution pattern of ecological assets, which manifests that the high vulnerable areas of ecological environment correspond to the low value areas of ecological assets, and vice versa.
There are spatial differences in the distribution of ecological risks of different types of natural hazards. The coastal areas are dominated by the high grade areas of ecological risks for tropical cyclones and rainstorm waterlogging, while the inland areas are dominated by the high grade areas of ecological risk for geohazards, which are mainly distributed in north of the province. The integrated ecological risks of natural hazards comprehensively reflect the distribution characteristics of the ecological risks for tropical cyclones, rainstorm waterlogging, and geohazards, which are generally higher in the coastal areas than in the inland areas, higher in the southern areas than in the northern areas, and higher in the western areas than in the eastern areas.
Acknowledgements
Dr. Zhenhuan Liu reviewed the previous draft of this paper and gave some valuable suggestions. Three anonymous reviewers’ and editor’s comments greatly improved this paper. The manuscript was edited by Wallace Academic Editing. Drs. Bryan Peckham and Jane Nicholson improved the English writing.
Disclosure statement
No potential conflict of interest was reported by the authors.
Additional information
Funding
References
- Alexander DE. 1991. Natural disasters: a framework for research and teaching. Disasters. 15(3):209–226.
- Alexander DE. 1993. Natural disasters. London: UCL Press Limited.
- Alexander DE. 1997. The study of natural disasters, 1977–1997: some reflections on a changing field of knowledge. Disasters. 21(4):284–304.
- Barrantes G. 2018. Multi-hazard model for developing countries. Nat Hazards. 92(2):1081–1095.
- Bradshaw CJA, Sodhi NS, Peh KSH, Brook BW. 2007. Global evidence that deforestation amplifies flood risk and severity in the developing world. Global Change Biol. 13(11):2379–2395.
- Brang P. 2001. Resistance and elasticity: promising concepts for the management of protection forests in the European Alps. For Ecol Manage. 145(1–2):107–119.
- Chen K, Blong R, Jacobson C. 2003. Towards an integrated approach to natural hazards risk assessment using GIS: with reference to bushfires. Environ Manage. 31(4):546–560.
- Chen Z, Liu Z, Yu X. 1991. National geomorphologic mapping of China. ITC J. 1:19–25.
- Costanza R, d'Arge R, de Groot R, Farber S, Grasso M, Hannon B, Limburg K, Naeem S, O'Neill RV, Paruelo J, et al. 1997. The value of the world’s ecosystem services and natural capital. Nature. 387(6630):253–260.,
- Deng R. 2014. Research on typhoon impact supported by multi-source remote sensing data and GIS dissertation. Hangzhou: Zhejiang University.
- Du Y, Peng J, Zhao S, Hu Z, Wang Y. 2016. Ecological risk assessment of landslide disasters in mountainous areas of Southwest China: a case study in Dali Bai Autonomous Prefecture. Acta Geog Sin. 71:1544–1561.
- Füssel H-M. 2007. Vulnerability: a generally applicable conceptual framework for climate change research. Global Environ Change. 17(2):155–167.
- Galli M, Guzzetti F. 2007. Landslide vulnerability criteria: a case study from Umbria, central Italy. Environ Manage. 40(4):649–664.
- Kappes MS, Keiler M, von Elverfeldt K, Glade T. 2012. Challenges of analyzing multi-hazard risk: a review. Nat Hazards. 64(2):1925–1958.
- Kobayashi Y, Mori AS. 2017. The potential role of tree diversity in reducing shallow landslide risk. Environ Manage. 59(5):807–815.
- Liu J, Duan Z. 2018. Quantitative assessment of landslide susceptibility comparing statistical index, index of entropy, and weights of evidence in the Shangnan area, China. Entropy. 20(11):868.
- Liu X, Lei J. 2003. A method for assessing regional debris flow risk: an application in Zhaotong of Yunnan Province (SW China). Geomorphology. 52(3–4):181–191.
- Liu X, Miao C. 2018. Large-scale assessment of landslide hazard, vulnerability and risk in China. Geomatics Nat Hazards Risk. 9(1):1037–1052.
- Liu X, Yue ZQ, Tham LG, Lee CF. 2002. Empirical assessment of debris flow risk on a regional scale in Yunnan province, southwestern China. Environ Manage. 30(2):249–264.
- Lü D, Jiang Q, Wang D, Ge J. 2018. Landsat vegetation cover estimation and landscape pattern analysis. Science of Surveying and Mapping. http://kns.cnki.net/kcms/detail/11.4415.p.20180417.1534.042.html.
- National Science and Technology Commission. 1993. Major natural hazards and disaster mitigation measures in China. Beijing: Science Press.
- National Science and Technology Commission. 1998. Progress of natural disaster regionalization in China. Beijing: Maritime Press.
- Renaud FG, Sudmerier-Rieux K, Estrella M. 2013. The role of ecosystems in disaster risk education dissertation. Tokyo: United Nations University.
- Tian C, Liu X, Wang J. 2016. Geohazard susceptibility assessment based on CF model and logistic regression models in Guangdong. Hydrogeol Eng Geol. 43:154–161.
- UNDHA. 1992. Internationally agreed glossary of basic terms related to disaster management. Glossary, United Nations Department of Humanitarian Affairs. New York: United Nations.
- UNEP. 1992. Agenda 21. Technical report, United Nations Environment Programme. http://www.un.org/esa/dsd/agenda21/res_agenda21_07.shtml.
- Villa F, McLeod H. 2002. Environmental vulnerability indicators for environmental planning and decision-making: guidelines and applications. Environ Manage. 29(3):335–348.
- Williams LRR, Kapustka LA. 2000. Ecosystem vulnerability: a complex interface with technical components. Environ Toxicol Chem. 19:1055–1058.
- Xie G, Zhang C, Zhang C, Xiao Y, Lu C. 2015. The value of ecosystem services in China. Resour Sci. 37:1740–1746.
- Xie G, Zhen L, Lu C, Xiao Y, Chen C. 2008. Expert knowledge based valuation method of ecosystem services in China. J Nat Resour. 23:911–919.
- Xu L, Meng X, Xu X. 2014. Natural hazard chain research in China: a review. Nat Hazards. 70(2):1631–1659.
- Xu X, Xu L, Yan L, Ma L, Lu Y. 2015. Integrated regional ecological risk assessment of multi-ecosystems under multi-disasters: a case study of China. Environ Earth Sci. 74(1):747–758.
- Xu X, Yan L, Xu L, Lu Y, Ma L. 2011. Ecological risk assessment of natural disasters in China. Acta Scientiarum Naturalium Universitatis Pekinensis. 47:901–908.
- Zhang J, Li N. 2007. Quantitative methods of risk assessment and management of meteorological disasters and their application. Beijing: Beijing Normal University Press.
- Zhou Y, Liu Y, Wu W, Li N. 2015. Integrated risk assessment of multi-hazards in China. Nat Hazards. 78(1):257–280.
- Zhu W, Zhang J, Pan Y, Yang X, Jia B. 2007. Measurement and dynamic analysis of ecological capital of terrestrial ecosystem in China. Ying Yong Sheng Tai Xue Bao. 18(3):586–594.