
 ?Mathematical formulae have been encoded as MathML and are displayed in this HTML version using MathJax in order to improve their display. Uncheck the box to turn MathJax off. This feature requires Javascript. Click on a formula to zoom.
Abstract
The landscape in desert margin regions is simultaneously shaped by both wind and water forces, resulting in a particular spatial distribution of dunes. It has been suggested previously that aeolian and fluvial systems should be integrated in investigations of the development of regional landforms. We carried out a comprehensive study of landforms on the southern margin of the Taklimakan Desert, China based on remote sensing images, meteorological data and morphodynamic theories of dune formation. Our results indicate that the major characteristic of dunes in this region is the coexistence of dunes with different orientations in a small geographical area. As the development of dunes is mainly determined by the wind regime and the availability of sand, the coexistence of dunes with different orientations might be caused by differences in the availability of sand. The topographic relief and fluvial systems both affect the grain size distribution and the amount of sediment in different regions, resulting in variations in the availability of sand. A comprehensive analysis of the spatial distribution of dunes and the regional environment can help our understanding of the regional variations of sediment in aeolian–fluvial interaction systems and help to model the development of landforms in these environments.
1. Introduction
Aeolian dunes can be classified according to the shape and orientation of their crestline (Wasson and Hyde Citation1983). Based on their shape, dunes can be classified as barchans, linear dunes or star dunes (Pye and Tsoar Citation1990), which are usually the result of exposure to unidirectional, bimodal and multidirectional wind regimes, respectively (Wasson and Hyde Citation1983; Rubin and Hunter Citation1987; Lancaster Citation1989; Pye and Tsoar Citation1990; Zhang et al. Citation2012). Barchans develop in regions with a finite supply of sand and star dunes occur where sand is freely available, whereas linear dunes occur over a wide range of the availability of sand. Different shapes of dunes are therefore a consequence of both the wind regime and the availability of sand. Linear dunes are the most common type in sand seas as a result of the wide variations in the Earth’s seasonal climate (Lancaster Citation1982; Pye and Tsoar Citation1990). They can be classified as transverse, longitudinal or oblique depending on the divergence between the resultant drift direction and the orientation of the crestline of the dunes (Hunter et al. Citation1983). Researchers have found that the crestline of linear dunes tends to be perpendicular to the direction of the maximum gross transport of sand under a bimodal wind (Rubin and Hunter Citation1987; Rubin and Ikeda Citation1990; Reffet et al. Citation2010; Lv et al. Citation2014). Transverse dunes migrate in the resultant drift direction, longitudinal dunes extend and oblique dunes both migrate and extend. The orientation of dunes is therefore determined by the wind regime, and the near-surface flow trend can be inferred by analysing the orientation of the dunes (Rubin et al. Citation2008; Bourke et al. Citation2010; Rubin Citation2012; Telfer and Hesse Citation2013; Fenton et al. Citation2014; Lucas et al. Citation2014; Liu and Zimbelman Citation2015). However, field surveys have suggested that the orientation of dunes may be different under the same wind regime (Lancaster Citation2010; Zhang et al. Citation2012), and that the orientation of dunes shows two modes for the same bimodal wind direction depending on the availability of sand (Courrech du Pont et al. Citation2014; Gao et al. Citation2015). On non-erodible ground with a localized source of sand, dunes extend in the direction of the mean sand flux at the crest (i.e. the fingering mode). On an erodible sand bed, dunes grow in height and migrate by selecting an orientation that maximizes the components of transport normal to the crest (i.e. bed instability mode). Two modes of dune orientation explain the coexistence of dunes with different orientations under the same wind regime (Courrech du Pont et al. Citation2014), and imply that the spatial distribution of dune orientations could be used as a proxy for the wind regime and the availability of sand in sand seas.
There is a wide variety in the shape and spatial distribution of sand dunes on the southern margin of the Taklimakan Desert. The landscape in this region has been shaped by both rivers that flow from Kunlun Mountain and the prevailing winds (). Studies of similar aeolian–fluvial systems have suggested that landforms developed as a result of the interaction between aeolian and fluvial systems are more complex than those influenced by an aeolian or fluvial system alone (Bullard and Livingstone Citation2002; Al-Masrahy and Mountney Citation2015; Liu and Coulthard Citation2015; Yan et al. Citation2015). The transport and deposition of sediments in aeolian and fluvial systems are influenced by both regimes (Langford Citation1989; Langford and Chan Citation1989), and should therefore be studied as an integrated system (Song et al. Citation2006; Field et al. Citation2009; Belnap et al. Citation2011; Liu and Coulthard Citation2015).
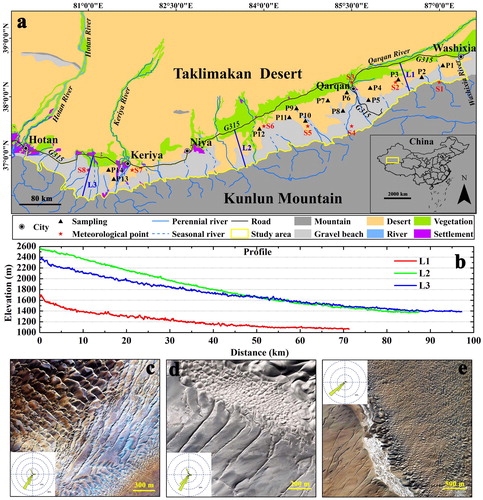
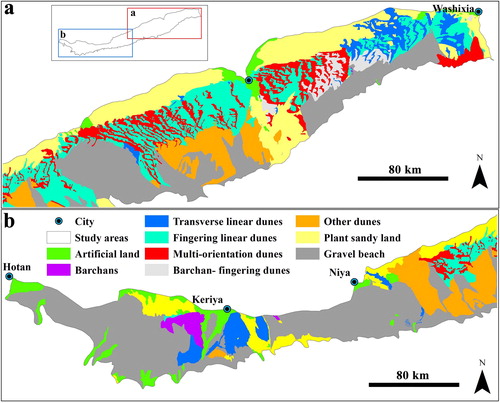
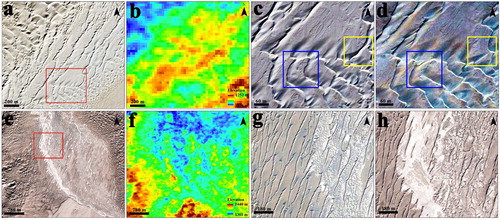
Figure 1. Map of the study area. (a) Location of the study area and the recorded landform. (b) Elevation profiles of three cross-sections in the study area. (c) Coexistence of transverse linear dunes and fingering linear dunes (86.81°E, 38.39°N). (d) Coexistence of multiple orientation dunes and fingering linear dunes (84.46°E, 37.77°N). (e) Different orientations of dunes on two sides of a river (85.43°E, 37.98°N). Source: Author.
In our study areas, dunes with different orientations coexist in small regions under same wind regime (), and in some areas, dunes on both sides of a river are oriented differently (). Although the orientation of dunes has two modes under the same wind regime depending on the availability of sand (Courrech du Pont et al. Citation2014; Gao et al. Citation2015), it is unclear whether the coexistence of dunes with different orientations on the southern margin of the Taklimakan Desert is caused by variations in the availability of sand. Dunes have been developed in a system under the impact of aeolian-fluvial interactions, which were not considered in previous laboratory reports. Therefore, we need to establish whether the orientation of dunes in this region conforms to the theoretical predictions based on the two modes of dune orientations.
This study is composed of two parts. First, we established a classification system for the dunes in our study area. Based on this classification system and high-resolution Google Earth images, we identified the spatial distribution of dunes on the southern margin of the Taklimakan Desert and measured the orientations of dunes at 14 sampling points. The theoretical orientations were predicted based on meteorological data and the dune orientation model, which were then compared with the measured orientations of dunes. Second, we inferred the availability of sand in the field and verified the results in a field survey. We investigated the relationships among fluvial systems, topographic relief and spatial distribution of dunes quantitatively. Then, the effects of fluvial systems on the differences in the availability of sand in small regions were discussed.
2. Study area and methods
2.1. Study area
The Taklimakan Desert is located in the centre of Tarim basin in northwest China. It is bordered to the north by the Tianshan Mountains, to the west by the Pamirs, to the south by Kunlun Mountain and Altun Mountain, and to the east by the Lop Nor depression. The Taklimakan Desert covers an area of 33.8 × , and is a major source of global dust production (Zhang et al. Citation2003). The desert has a hyper-arid continental climate (Wang and Jia Citation2013). The annual mean temperature ranges from 9.9 to 12.6 °C, and the annual mean precipitation ranges from 17.4 to 66.3 mm (Zu et al. Citation2008). The east and southeast of the desert are dominated by northeasterly winds, whereas the west and the north of the desert are dominated by the westerly, northerly and northwesterly winds (Shao and Dong Citation2006; Zu et al. Citation2008).
The study area lies on the southern margin of the Taklimakan Desert (). It is bounded by Kunlun Mountain and Altun Mountain to the south, road G315 to the north, and Washixia River and the Hotan River to the east and west, respectively. The elevation of the study area ranges from 972 to 3257 m, resulting in a large difference in elevation between the south and the north (). Perennial and seasonal rivers flow from the mountains into gravel beaches and the hinterland of the desert. The flood season is from April to August (Gu et al. Citation2016). The oasis in the north of the study area is dependent on water from the rivers and is exposed to fluctuations in the supply of sand. The balance between the forces of wind and water has an important influence on the oasis.
2.2. Methods
2.2.1. Classification system and measurement of dune orientation
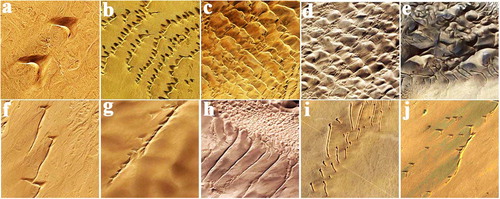
Google Earth images were used to classify the dunes into barchans, linear dunes and star dunes based primarily on their shape. Because different orientations of the linear dunes represent differences in the availability of sand under the same wind regime (Courrech du Pont et al. Citation2014; Gao et al. Citation2015), the linear dunes were further classified into transverse linear dunes and fingering linear dunes, corresponding to the bed instability mode and the fingering mode, respectively. The coexistence of the barchans and fingering linear dunes made it difficult to place them in separate classes, they were therefore classified as barchans-fingering dunes to give a total of five classes in the dune classification system: barchans (), transverse linear dunes (), multi-orientation dunes (), fingering linear dunes (), and barchans-fingering dunes (). The spatial distribution of the dunes in five classes was mapping at high-resolution Google Earth images by visual interpretation. Dune fields in which the spatial distribution of dunes was too complex to be identified into any class were named other dunes.
Figure 2. Main shapes of dunes on the southern margin of the Taklimakan Desert. (a) barchans; (b) barchanoid dunes; (c) transverse linear dunes; (d) network dunes; (e) pyramid dunes; (f) asymmetrical barchans dunes; (g) raked linear dunes (Dong et al. Citation2010); (h) symmetrical linear dunes; (i) nail dunes; and (j) barchans and asymmetrical barchan dunes. Source: Author.
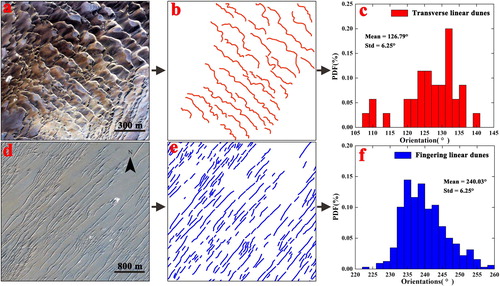
The dune orientations were measured in the field at 14 sampling points (). At each point, we vectored the crestlines of ≥40 dunes for each class near the point and then calculated the orientation of the vectorial crestlines in ArcGIS10.1 (). The mean value was taken as the orientation of the dunes and the standard error was given for reference. For network dunes in the class of multi-orientation dunes, we vectored the orientation of the primary crestlines, which are normal to the resultant drift direction.
Figure 3. Measurement processes used to determine the orientations of (a–c) transverse linear dunes and (d–f) fingering linear dunes.Source: Author.
2.2.2. Prediction of dune orientation
We used the model for dune orientation proposed by Courrech du Pont et al. (Citation2014). If the orientation of the linear dune is with respect to
in the standard basis
then the height is H and the width is W. The dune is shaped by winds of duration T and an instantaneous flux magnitude
with a direction of
dependent on the time t. Because the positive topography on the windward slope of the dune makes the winds accelerate (Jackson and Hunt Citation1975), the maximum saturated sand flux can be expressed by considering the acceleration of the wind, which depends on the dune aspect ratio
(Courrech du Pont et al. Citation2014):
(1)
(1)
(2)
(2)
The expression used to calculate was proposed by Ungar and Haff (Citation1987) and verified by Iversen and Rasmussen (Citation1999) based on wind tunnel data. In EquationEquation (1)
(1)
(1) ,
is a dimensionless coefficient that contributes to the increase in the wind velocity.
is the dune aspect ratio experienced by the wind with an angle
between the dune and the wind at time t, and
is the direction of flow of the wind.
is also referred to as the speed-up ratio (Courrech du Pont et al. Citation2014; Gao et al. Citation2015). In EquationEquation (2)
(2)
(2) ,
is the density of air,
is the density of sand, g is the acceleration due to gravity and d is the grain size.
is the shear velocity at the surface at time t, and
is the corresponding threshold shear velocity. We used values of
and
(Pye and Tsoar Citation1990).
The orientation of dunes has two modes depending on the availability of sand. For an erodible sand bed with no limitation on the availability of sand, the dune increases in height in the orientation that corresponds to the highest growth rate, referred to as the bed instability mode (Courrech du Pont et al. Citation2014). If the dune does not propagate, then represents the growth rate, where h is the instantaneous height of the dunes and is a function of time t and space. Assuming that the dune is large enough to maintain a constant shape over the wind cycle T, Courrech du Pont et al. (Citation2014) expressed the mean growth rate
over T as:
(3)
(3)
where
is function of
and
is the orientation with the largest growth rate
so
The orientation of dunes in the bed instability mode is agreement with the work of Rubin and Hunter (Citation1987) and is normal to the direction of maximum sand transport. The calculated orientation of the bed instability mode is expressed as
For a non-erodible sand bed with a limited source of sediment, the selected orientation is the resultant sand flux at the crest of the dune, and is referred to as the fingering mode. The resultant sand flux
over time T is expressed as:
(4)
(4)
For the orientation the relation can be expressed as:
(5)
(5)
The orientation of the dune in the two modes depends on the value of Two extreme cases for
and
are considered here referring to Courrech du Pont et al. (Citation2014) and Gao et al. (Citation2015).
We used the ERA-Interim reanalysis dataset produced by the European Centre for Medium-Range Weather Forecasts (ECMWF) to calculate the orientation of the dunes in the two modes (Uppala et al. Citation2005; Dee et al. Citation2011). The wind data in the archive are available for download from the ECMWF data server (http://apps.ecmwf.int/datasets/). This model extends from 1979 to the present day with a horizontal spatial resolution of 0.75° × 0.75° and a time resolution of 6 h (0:00, 6:00, 12:00 and 18:00 h UTC). We extracted the 10 m wind data (in terms of wind speed and wind direction) for a complete time series at 6-hourly intervals for the period from 1 January 1979 to 31 December 2013. After pre-processing, we obtained one wind speed and one wind direction for one point for every 6 h. Using this model, we obtained the values (
for one point with
and
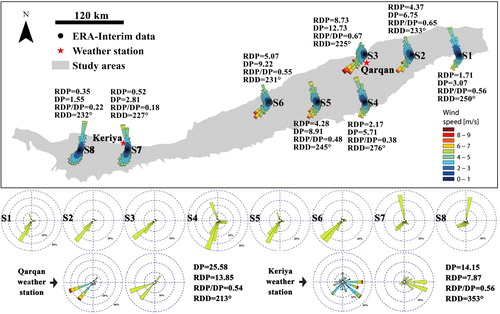
The predicted orientations of the 14 sampling points were represented by the nearest meteorological point. We also obtained the wind rose, flux rose, drift potential (DP), resultant drift potential (RDP) and RDP/DP for the meteorological points. As a result of the poor quality of the ERA-Interim wind data in the west of the study area, the daily maximum wind speed and direction at Keriya and Qarqan weather stations were used as a reference. All directions in this study are defined as clockwise from the east.
2.2.3. Data processing and field survey
The vegetation cover fraction (VCF) was analysed because vegetation directly affects the morphology and activity of dunes (Thomas and Tsoar Citation1990; Livingstone and Thomas Citation1993; Wiggs et al. Citation1995; Barchyn and Hugenholtz Citation2012). The Landsat8 OIL image was used to calculate the normalized differential vegetation index (NDVI), and then to calculate the VCF. Taking the wide geographical area and the accuracy of the data into consideration (cloud cover ≤5%), the data for July 2015 (path/row: 142/033, 142/034, 143/033, 143/034, 144/034, 144/035) and 2016 (path/row: 145/034, 145/035, 146/034) were downloaded from the USGS website (https://glovis.usgs.gov/) and were pre-processed in ENVI5.0. The value of VCF is expressed as (Gutman and Ignatov Citation1998):
(6)
(6)
(7)
(7)
where
and
are the surface spectral reflectance in the near-infrared and red bands of the Landsat8 OIL image, respectively.
and
represent the NDVI value for complete vegetation cover and bare land, respectively.
and
in the study area correspond to NDVI values of 100 and 5% of the accumulative percentage, respectively.
In order to investigate the relationship between fluvial systems, topographic relief and the spatial distribution of dunes in a regional scale, the study area was equally divided into eight regions in the longitudinal direction (). Information about the fluvial system was acquired from the Landsat5 and Landsat8 images (cloud cover ≤10%) by visual interpretation. All the images were downloaded from the USGS website (https://glovis.usgs.gov/). Drainage density is calculated as follows referring to Smith (Citation1954):
(8)
(8)
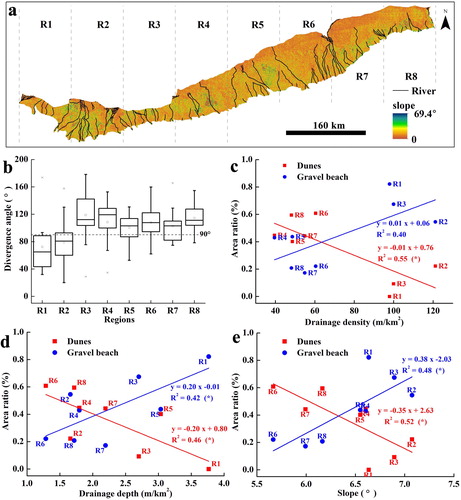
Figure 4. The location of regions R1∼R8, the divergence angle between river flow and wind flow, and the relationships between fluvial systems, topographic relief and spatial distribution of dunes. (a) The location of regions R1∼R8. (b) The box chart of divergence angle between river flow and wind flow in regions R1∼R8. (c) Relationships between drainage density and area ratio of dunes or gravel beach. (d) Relationships between drainage depth and area ratio of dunes or gravel beach. (e) Relationships between slope and area ratio of dunes or gravel beach. * in parenthesis represents the correlation coefficient significant at 0.05 level. Source: Author
The depth that rivers flow into each region was also taken into consideration. Because rivers all flow from south to north and eight regions are equal in direction of longitudinal, the depth that rivers flow into each region is simply calculated as follows:
(9)
(9)
where TL is the total length of the waterway (m), A is the area of each region (k
), and AL is the average length of the waterway (m).
Slope was selected to represent the topographic relief. It was calculated from the elevation data which were obtained from ASTGTM2 (http://www.gscloud.cn/) with a resolution of 30 m. The calculation and statistic processing were conducted in ArcGIS10.1
A field survey was carried out along road G315 on the southern margin of the Taklimakan Desert in April 2017 using GPS positioning to determine the condition of the vegetation and the availability of sand in the field.
3. Results
3.1. Spatial distribution of dunes
There is a variety of shapes of dunes on the southern margin of the Taklimakan Desert (), and the simple dunes are divided into five classes (). The shape of the dunes in each class is different at different regions. Barchans mainly develop in the western region (), where the shape is mainly barchanoid (). Transverse linear dunes () are mainly distributed in the east and west of the study area, whereas fingering linear dunes mainly occur in the east of the study area (). The shape of the fingering linear dunes changes from east to west in the order of raked-linear dunes (), asymmetrical barchans dunes (), symmetrical linear dunes () and nail dunes (). Multi-orientation dunes are mainly distributed in the east and their shapes change from east to west in the order of network () with a primary ridge perpendicular to RDD and pyramid dunes (). Barchans-fingering dunes are seen in the east where single barchans and asymmetrical barchans coexist ().
Figure 5. Spatial distribution of dunes on the southern margin of the Taklimakan Desert in (a) the east of the study area and (b) the west of the study area. Gravel beach represents the landform in which the surface sediment is composed of gravels and sands (). Plant sandy land represents the landform in which the land surfaces have a sparse vegetation; the nebkhas or vegetated linear dunes may occur in this region (). Source: Author
The main characteristic of the spatial distribution of dunes is the alternation of dunes with different orientations in a small-scale geographical region, which mainly occurs in the east of the study area. The alternation is mainly between transverse linear dunes and fingering linear dunes (), multi-orientation dunes and fingering linear dunes () and coexisting barchans and fingering linear dunes ().
3.2. Measured and predicted orientation of dunes
shows the measured and predicted orientation of dunes at 14 selected points. The deviations between the predicted orientations calculated from the ERA-Interim dataset and the measured orientations are within 15°, except for P11, P13 and P14. The difference between the predicted orientations calculated using measurements from the Keriya weather station and the measured orientations at P13 and P14 are 21.8° and 14.6°, respectively. This large deviation is reasonable because the wind directions at weather station are converted from the wind records in 16 directions. Taking the factor into consideration, the predicted orientations based on the two modes are almost in agreement with the measured orientations at the 14 selected sampling points.
Table 1. Comparison of predicted and measured orientation of dunes at the 14 selected sampling points.
3.3. Vegetation condition, wind regime and the availability of sand
Previous studies have shown that the condition of the vegetation, the wind regime and the availability of sand are the key factors affecting the morphology of dunes (Wasson and Hyde Citation1983; Pye and Tsoar Citation1990; Dong et al. Citation2009).
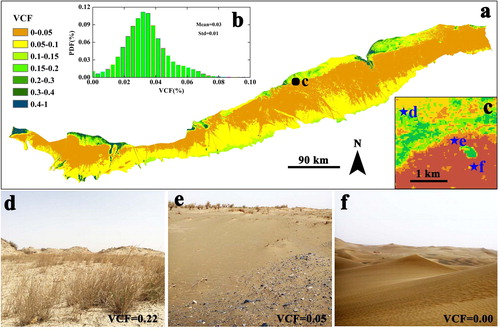
shows the condition of the vegetation in the study area. Nebkhas or vegetated linear dunes are not included in our classification and are referred to as plant sandy land (e.g. ). The mean VCF value in the region covered by dunes in our five classes is 0.03 (). The condition of vegetation in the transition region between the oasis and the desert is surveyed in the field. There is almost no vegetation in this transition region when the VCF value ≤0.05 () and there is no vegetation in the region where dunes have developed (). Therefore, the development of dunes in the study area showed little influence from vegetation. The wind regime and the availability of sand were the key factors in affecting the development of the dunes.
Figure 6. Condition of vegetation on the southern margin of the Taklimakan Desert. (a) Spatial distribution of VCF value in the study area. The black dot shows the location of (c). (b) Histogram of VCF values in the region covered by dunes (see ). (c) Spatial distribution of VCF values at point c. The blue stars show the location of the field photographs in (d), (e), (f). Field photographs of the regions where the VCF value is (d) 0.22, (e) 0.05 and (f) 0.00. Source: Author.
shows the wind regime in the study area. The wind regime in the west of the study area is poorly modelled by reanalysis data compared with the wind data derived from the local meteorological stations. In addition, because the daily maximum wind direction and wind speed are used in the data from the meteorological station, the values of RDP and DP are larger than the value calculated from the reanalysis wind data. The wind regime in study area is dominated by two opposite airflows that converge in the centre region (Zu et al. Citation2008), corresponding to the changes of dune morphology from barchans or transverse linear dunes resulted from exposure to unidirectional wind regime, to multi-orientation dunes resulted from exposure to bimodal or multidirectional wind regime ( and ). Spatial distribution of dunes is generally consistent with the imposed wind regime.
Figure 7. Wind regime on the southern margin of the Taklimakan Desert. The wind regime in the S1–S8 diagrams were obtained from the ERA-Interim reanalysis dataset for the locations shown in . The wind regime at the Keriya and Qarqan weather stations were calculated using the daily maximum wind speed and direction. Here DP and RDP are expressed in m2/yr. Source: Author.
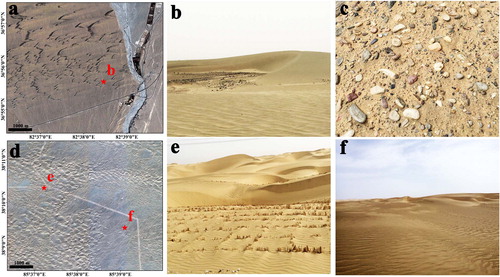
shows the condition of sand availability in the field. The sediments in the region in which the dunes develop are of two different types. The first type of sediment is a mixture of fine, coarse sand and gravel, the fine fraction of which can be transported by wind (). This condition is usually observed on a gravel beach. The amount of sand available for the development of dunes is finite and asymmetrical barchan dunes or fingering linear dunes may develop (). Gao et al. (Citation2016) used a real-space cellular automation model to explore the processes of formation for dunes on a gravel beach and found that the fine sands transported by the wind-generated dunes and the gravel that was not transported by the wind generated a gravel beach. The results are consistent with our field study. The second type of sediment is composed of fine sands. Network dunes and fingering linear dunes can coexist in this environment (). There is a high availability of sand in the area in which network dunes occur, whereas the availability of sand in the area where fingering linear dunes develop is finite ().
Figure 8. Field photographs showing the condition of sediment in the study area. (a) Remote sensing image of gravel beach. The asymmetrical barchans dunes developed in this region. The red star shows the location of (b). (b) Field photograph of the area covered by asymmetrical barchans dunes. (c) Field photograph of surface sediments in the inter-dune region of the gravel beach. (d) Remote sensing image of the coexistence of dunes with different orientations. The red stars show the location of (e), (f). (e) Field photograph of the area covered by network dunes. (f) Field photograph of the area covered by fingering linear dunes. Source: Author.
3.4. The relationships between fluvial systems, topographic relief and spatial distribution of dunes
The study area is equally divided into eight regions along the longitude to quantitative analysis of the relationships between fluvial systems, topographic relief and spatial distribution of dunes (). On the southern margin of Taklimakan Desert, rivers flow from south to north, whilst winds almost blow from the opposite direction (). The meeting angle leads to the opposition of the landform dominated by fluvial systems and aeolian systems (Liu and Coulthard Citation2015). Drainage density, drainage depth and slopes in west (R1∼R3) are higher than them in east (R4∼R8) (). The area ratio of dunes has a significant negative correlation with drainage density, drainage depth and slopes (p < 0.05) (). The area ratio of gravel beaches has a positive correlation with drainage density, but the correlation is not significant (). The area ratio of gravel beach has a significant positive correlation with drainage depth and slope (p < 0.05) (). Both drainage density and drainage depth indicate the strength of regional water forces. The area ratio of gravel beach increases and the area ratio of dunes decreases with the increasing of the region water force and slope, implying a reduction of the area ratio of the landform dominated by aeolian systems.
Fluvial systems and topographic relief not only have a significant effect on sediment condition in a regional scale, but they also directly influence the transport and deposition of sediments in a local scale. We analysed two observations of historical changes of landforms through Google Earth images (). The first observation was the resistance from the topographic relief or a barrier. Sand accumulated in front of the region in which there are large changes in topographic relief, the dune shape and orientation also changed (). Rivers can also be a barrier to the accumulation of sediments in upwind regions (Bullard and McTainsh Citation2003; Muhs et al. Citation2003), resulting in differences in the availability of sediment on both sides of a river (). The second observation was the effect of water force. River flows, especially floods, can level dunes developed in regions where rivers or floods flow, resulting in the redistribution of sediment (). In addition, rivers can affect the saltiness of surface sediments, ground-water and surface crust, which might prevent the movement of aeolian sands and result in the low availability of sand (El-Baz et al. Citation2000; Langston and Neuman Citation2005; Rubin and Hesp Citation2009).
Figure 9. Historical changes of the landforms where dunes occur. (a) Coexistence of transverse linear dunes and fingering linear dunes (86.81°E, 38.38°N). The red box shows the location of (c), (d). (b) Elevation of the region shown in (a). (c) The image in the red box in (a), acquired on 26 January 2005. (d) The image in the red box in (a), acquired on 30 May 2011. (e) Coexistence of longitudinal dunes and seasonal rivers (83.98°E, 37.53°N). The red box shows the location of (g), (h). (f) Elevation of the region shown in (e). (g) The image in the red box in (e), acquired on 31 December 2004. (h) The image in the red box in (e), acquired on 30 November 2010. Source: Author
4. Discussion
The main characteristic of the spatial distribution of the dunes in the study area is the coexistence of dunes with different orientations in a small geographical region (). Because there is almost no vegetation in the area in which dunes occur (), the wind regime and the availability of sand are the key factors affecting the development of the dunes in the field. The comparison between the predicted theoretical orientation and the measured orientation of dunes infers that the coexistence of dunes with different orientations was caused by differences in the availability of sand (), and the inference is confirmed by the field survey (). We also found in field survey that the underlying of the region in which dunes can develop presents differences in the availability of sand (). Formation of this is caused by the different deposits dominated by different systems, which are related to the drainage density, drainage depth and regional slope ().
A typical sub-region was selected to further investigate the effect of the fluvial system on the spatial distribution of dunes. The drainage density and regional slope in this region decrease from the south to the north (), and landforms change from gravel beach to dunes, then to plant sandy land (). Sediments in the region are transported and deposited by winds and rivers. Aeolian sediments are mainly composed of fine sands, while the particle size and the quantity of fluvial sediments are determined by the feature of regional fluvial system. For alpine rivers, the deposits become increasingly fine-grained downstream, changing from gravel-dominated to sand-dominated deposits (Heller and Paola Citation1992; Ferguson et al. Citation1996; Fedele and Paola Citation2007; Stock et al. Citation2008). The slope decreasing downstream can reveal the decreases of river sediments (Stock et al. Citation2008). The regularity of deposition of alpine rivers indicates that the upstream sediment is coarse and sparse, whilst the downstream sediment is fine and abundant (). The sediment condition in different regions is determined by the dominated system. This dominated system of landforms is affected by the aeolian–fluvial meeting angle and the respective characteristics of aeolian system and fluvial system (Al-Masrahy and Mountney Citation2015; Liu and Coulthard Citation2015).
Figure 10. The impact of fluvial systems and topographic relief on spatial distribution of dunes. (a) Spatial distribution of rivers and dunes. Rivers are a simplified overlay of historical rivers from 1989 to 2016. Signs of ancient channels are identified by white signs in remote sensing images (e). (b) The histogram of the divergence angle between river flow and wind flow in sub-region. (c) The average slope in gravel beach, plant sandy land and the region covered by dunes. The geographical scopes of each landform are shown in (a). (d) The schematic diagram of aeolian–fluvial interaction and the deposition pattern of rivers. (e) Field photo of the white signs in remote sensing image (88.41°E, 39.47°N). (f) The probable degradation processes of an alluvial fan on the southern margin of Taklimakan Desert (84.47°E, 37.44°N). Source: Author.
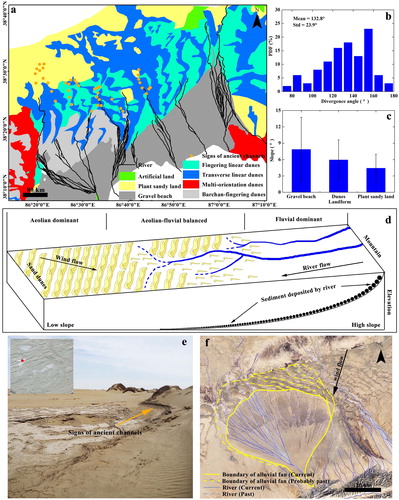
For the sub-region, rivers flow from south to north and the main direction of the sand flux is in the direction of northeast (S2 in ). The mean divergence angle between the direction of flow of the river and the resultant drift direction (clockwise from river flow to wind flow) is 132.8° (). In the south, drainage density and slope are higher than north, and the region is so far from the desert that aeolian sediments are difficult to be transported to the region. Even aeolian sediments can deposit, those fine sediments will be transported to the downstream by rivers. Fluvial systems fully dominate the landform. Surface sediments are mainly deposited by the upstream reaches of rivers and are gravel-dominated (). There is a finite availability of sand in the region and the resulting landform is a gravel beach. In the north, regional slope is low, and there is no river on land surface. Aeolian systems have fully dominated the landform in modern times (). The regional sediments are mainly composed of fine sands transported by the northeasterly wind system or may have been deposited by an ancient river. The region near the oasis is covered with sparse vegetation and the resulting landform is referred as plant sandy land. The central part of sub-region is the region where aeolian system and fluvial system meet, and both systems can dominate the landforms. As the region locates in the upstream of river, the fluvial sediments are abundant and sand-dominated. Therefore, surface sediments are mainly composed of sands. Previous studies have indicated that ancient rivers and ancient oasis are deeper into the desert than the modern times on the southern margin of Taklimakan Desert (Xiong and Yu Citation2008), and signs of ancient channels can be seen in the upstream of modern rivers or other areas (), implying that the water force of ancient rivers is stronger than modern rivers. According to the relationships between the strength of fluvial system and the area ratio of dunes or gravel beaches (), the area of gravel beaches in ancient times is larger than it in modern times. The dunes occurred in study area may develop in the ancient gravel beaches. Due to the dry and wet change of climates, rivers divert or cut-off, and gravel beach may degrade (). In the degradation processing of gravel beach, the resistance of rivers and the accumulation of aeolian sands may result in the differences in the availability of sand in the region (), which is the same as the sediment condition in the areas where aeolian–fluvial interaction is still active in modern times ().
Depending on the data and the evidences in our study, we provide some assumptions for the differences in the availability of sand in small regions on the southern margin of Taklimakan Desert. However, the further investigation of the regional geographical environment and stratigraphic records are required to clarify the mechanisms of dune deposition in specific locations.
5. Conclusions
The regional landforms on the southern margin of the Taklimakan Desert are affected by both wind and water forces and dunes with a variety of different shapes are observed. Dunes with multiple orientations coexist under the same wind regime, but the environmental cause of the coexistence of dunes with different orientations in the field has not previously been clarified. Therefore, in order to clarify the internal and external causes of the coexistence of dunes with different orientations on the southern margin of Taklimakan Desert, we extracted the spatial distribution of dunes from Google Earth images and counted the number of dunes with particular orientations at 14 selected points. Based on previous studies and meteorological data, the orientations at 14 selected points were predicted and compared with the measured orientations. Information about the vegetation, topographic relief and river systems was obtained from field surveys and the relationships between the fluvial systems and the spatial distribution of dunes were investigated. The following conclusions can be drawn.
The shape and orientation of aeolian dunes on the southern margin of the Taklimakan Desert are diverse. The dominant dune morphologies are transverse linear dunes, fingering linear dunes and star dunes. The major characteristic of the spatial distribution of the dunes is the coexistence of dunes with different orientations in a small region, including the coexistence of dunes in the bed instability and fingering modes, the coexistence of star dunes and fingering linear dunes, and the coexistence of barchans and fingering dunes.
The predicted orientations of dunes based on the two modes are almost consistent with the orientations of the dunes measured in the field. The coexistence of dunes with different orientations is caused by differences in the availability of sand.
The variation in the availability of sand is influenced by the topographic relief and fluvial system. In a regional scale, the increase of drainage density, drainage depth and regional slope can lead to a decrease of the area ratio of region which is dominated by aeolian systems. In a local scale, the resistance of rivers or topographic relief and the accumulation of aeolian sands can cause the differences in the availability of sand.
Acknowledgements
We thank the Google Earth for high-resolution images used in .
Disclosure statement
No potential conflict of interest was reported by the authors.
Additional information
Funding
References
- Al-Masrahy MA, Mountney NP. 2015. A classification scheme for fluvial-aeolian system interaction in desert-margin settings. Aeolian Res. 17:67–88.
- Barchyn TE, Hugenholtz CH. 2012. A process-based hypothesis for the barchans-parabolic transformation and implications for dune activity modelling. Earth Surf Process Landforms. 37(13):1456–1462.
- Belnap J, Munson SM, Field JP. 2011. Aeolian and fluvial processes in dryland regions: the need for integrated studies. Ecohydrology. 4(5):615–622.
- Bourke MC, Lancaster N, Fenton LK, Parteli EJR, Zimbelman JR, Radebaugh J. 2010. Extraterrestrial dunes: an introduction to the special issue on planetary dune systems. Geomorphology. 121(1–2):1–14.
- Bullard JE, Livingstone I. 2002. Interactions between aeolian and fluvial systems in dry land. Environ Area. 34(1):8–16.
- Bullard JE, McTainsh GH. 2003. Aeolian-fluvial interactions in dryland environments: examples, concepts and Australia case study. Prog Phys Geogr. 27(4):471–501.
- Courrech Du Pont S, Narteau C, Gao X. 2014. Two modes for dune orientation. Geology. 42(9):743–746.
- Dee DP, Uppala SM, Simmons AJ, Berrisford P, Poli P, Kobayashi S, Andrae U, Balmaseda M, Balsamo G, Bauer P, et al. 2011. The ERA-interim reanalysis: configuration and performance of the data assimilation system. QJR Meteorol Soc. 137(656):553–597.
- Dong ZB, Qian GQ, Luo WY, Zhang ZC, Xiao SC, Zhao AG. 2009. Geomorphological hierarchies for complex mega-dunes and their implications for mega-dune evolution in the Badain Jaran Desert. Geomorphology. 106(3–4):180–185.
- Dong ZB, Wei ZH, Qian GQ, Zhang ZC, Luo WY, Hu GY. 2010. “Raked” linear dunes in the Kumtagh Desert, China. Geomorphology. 123(1–2):122–128.
- El-Baz F, Maingue M, Robinson C. 2000. Fluvio-aeolian dynamics in the north-eastern Sahara: the relationship between fluvial/aeolian systems and ground-water concentration. J Arid Environ. 44(2):173–183.
- Fedele JJ, Paola C. 2007. Similarity solutions for fluvial sediment fining by selective deposition. J Geophys Res. 112(F2):F02038.
- Fenton LK, Michaels TI, Beyer RA. 2014. Inverse maximum gross bedform-normal transport 1: how to determine a dune-constructing wind regime using only imagery. Icarus. 230(4):5–14.
- Ferguson R, Hoey T, Wathen S, Werritty A. 1996. Field evidence for rapid downstream fining of river gravels through selective transport. Geology. 24(2):179–182.
- Field JP, Breshears DD, Whicker JJ. 2009. Toward a more holistic perspective of soil erosion: why aeolian research needs to explicitly consider fluvial processes and interactions. Aeolian Res. 1(1–2):9–17.
- Gao X, Narteau C, Rozier O, Courrech Du Pont S. 2015. Phase diagram of dune shape and orientation depending on sand availability. Sci Rep. 5:14677.
- Gao X, Narteau C, Rozier O. 2016. Controls on and effects of armoring and vertical sorting in aeolian dune fields: a numerical simulation study. Geophys Res Lett. 43(6):2614–2622.
- Gu X, Zhang Q, Singh VP, Chen YD, Shi P. 2016. Temporal clustering of floods and impacts of climate indices in the Tarim River Basin, China. Global Planet Change. 147:12–24.
- Gutman G, Ignatov A. 1998. The derivation of the green vegetation fraction from NOAA/AVHRR data for use in numerical weather prediction models. Int J Remote Sens. 19(8):1533–1543.
- Heller PL, Paola C. 1992. The large-scale dynamics of grain-size variation in alluvial basins, 2: application to syntectonic conglomerate. Basin Res. 4(2):91–102.
- Hunter RE, Richmond BM, Alpha TR. 1983. Storm-controlled oblique dunes of the Oregon coast. Geol Soc America Bull. 94(12):1450–1465.
- Iversen JD, Rasmussen KR. 1999. The effect of wind speed and bed slope on sand transport. Sedimentology. 46(4):723–731.
- Jackson PS, Hunt J. 1975. Turbulent wind flow over a low hill. QJR Meteorol Soc. 101(430):929–955.
- Lancaster N. 1982. Linear dunes. Prog Phys Geogr. 6(4):475–504.
- Lancaster N. 1989. The dynamics of star dunes: an example from the Gran Desierto, Mexico. Sedimentology. 36(2):273–289.
- Lancaster N. 2010. Assessing dune-forming winds on planetary surfaces: application of the gross bedform normal concept. Rev Brasil Ginecol Obstet. 2(26):193–200.
- Langford RP. 1989. Fluvial-aeolian interactions: part I, modern systems. Sedimentology. 36(6):1023–1035.
- Langford RP, Chan MA. 1989. Fluvial-aeolian interactions: part II, ancient systems. Sedimentology. 36(6):1037–1051.
- Langston G, Neuman CM. 2005. An experimental study on the susceptibility of crusted surfaces to wind erosion: a comparison of strength properties of biotic and salt crusts. Geomorphology. 72(1–4):40–53.
- Liu B, Coulthard TJ. 2015. Mapping the interactions between rivers and sand dunes: implications for fluvial and aeolian geomorphology. Geomorphology. 231:246–257.
- Liu YC, Zimbelman JR. 2015. Recent near-surface wind directions inferred from mapping sand ripples on Martian dunes. Icarus. 261:169–181.
- Livingstone I, Thomas D. 1993. Modes of linear dune activity and their palaeoenvironmental significance: an evaluation with reference to southern African examples. Geol Soc London Spec Publ. 72(1):91–101.
- Lucas A, Rodriguez S, Narteau C, Charnay B, Courrech Du Pont S, Tokano T, Garcia A, Thiriet M, Hayes AG, Lorenz RD, et al. 2014. Growth mechanisms and dune orientation on titan. Geophys Res Lett. 41(17):6093–6100.
- Lv P, Narteau C, Dong ZB, Zhang ZC, Courrech Du Pont S. 2014. Emergence of oblique dunes in a landscape-scale experiment. Nat Geosci. 7:99–103.
- Muhs DR, Reynolds RL, Been J, Skipp G. 2003. Eolian sand transport pathways in the southwestern United States: importance of the Colorado River and local sources. Quatern Int. 104(1):3–18.
- Pye K, Tsoar H. 1990. Aeolian bed forms. In: Pye K, Tsoar H, editors. Aeolian sand and sand dunes. London: Unwin Hyman; p. 175–251.
- Reffet E, Courrech Du Pont S, Hersen P, Douady S. 2010. Formation and stability of transverse and longitudinal sand dunes. Geology. 38(6):491–494.
- Rubin DM. 2012. A unifying model for planform straightness of ripples and dunes in air and water. Earth Sci Rev. 113(3–4):176–185.
- Rubin DM, Hunter RE. 1987. Bedform alignment in directionally varying flows. Science. 237(4812):276–278.
- Rubin DM, Ikeda H. 1990. Flume experiments on the alignment of transverse, oblique, and longitudinal dunes in directionally varying flows. Sedimentology. 37(4):673–684.
- Rubin DM, Tsoar H, Blumberg DG. 2008. A second look at western Sinai seif dunes and their lateral migration. Geomorphology. 93(3–4):335–342.
- Rubin DM, Hesp PA. 2009. Multiple origins of linear dunes on Earth and Titan. Nat Geosci. 2(9):653–658.
- Shao Y, Dong CH. 2006. A review on East Asian dust storm climate, modelling and monitoring. Global Planet Change. 52(1–4):1–22.
- Smith K G. 1954. Standards for grading texture of erosional topography. American Journal of Science. 248(9):655–668. .
- Song Y, Yan P, Liu LY. 2006. A review of the research on complex erosion by wind and water. J Geogr Sci. 16(2):231–241.
- Stock JD, Schmidt KM, Miller DM. 2008. Controls on alluvial fan longprofiles. Geol Soc Am Bull. 120(5–6):619–640.
- Telfer M, Hesse P. 2013. Palaeoenvironmental reconstructions from linear dunefields: recent progress, current challenges and future directions. Quatern Sci Rev. 78(454):1–21.
- Thomas DSG, Tsoar H. 1990. The geomorphological role of vegetation in desert dune systems. In: Thornes JB, editor. Vegetation and erosion. Chichester: Wiley; p. 471–489.
- Ungar JE, Haff PK. 1987. Steady state saltation in air. Sedimentology. 34(2):289–299.
- Uppala SM, Kôllberg PW, Simmons AJ, Andrae U, Bechtold VDC, Fiorino M, Gibson JK, Haseler J, Hernandez A, Kelly GA, et al. 2005. The era-40 reanalysis. QJR Meteorol Soc. 131(612):2961–3012.
- Wang H, Jia X. 2013. Field observations of windblown sand and dust in the Taklimakan Desert, NW China, and insights into modern dust sources. Land Degrad Dev. 24(4):323–333.
- Wasson R, Hyde R. 1983. Factors determining desert dune types. Nature. 304(5924):337–339.
- Wiggs GFS, Livingstone I, Thomas DSG, Bullard JE. 1995. Dune mobility and vegetation cover in the Southwest Kalahari Desert. Earth Surf Process Landforms. 20(6):515–529.
- Xiong HG, Yu L. 2008. Relationship between the ancient oasis changes and rivers, glaciers in the southern Tarim Basin. Arid Land Geogr. 01:17–22. (In Chinese with English abstract).
- Yan P, Li XM, Ma YF, Wu W, Qian Y. 2015. Morphological characteristics of interactions between deserts and rivers in northern China. Aeolian Res. 19:225–233.
- Zhang D, Narteau C, Rozier O, Courrech Du Pont S. 2012. Morphology and dynamics of star dunes from numerical modelling. Nat Geosci. 5(7):463–467.
- Zhang XY, Gong SL, Zhao TL, Arimoto R, Wang YQ, Zhou ZJ. 2003. Sources of Asian dust and role of climate change versus desertification in Asian dust emission. Geophys Res Lett. 30(24):5–8.
- Zu R, Xue X, Qiang M, Yang B, Qu J, Zhang K. 2008. Characteristics of near-surface wind regimes in the Taklimakan Desert, China. Geomorphology. 96(1–2):39–47.