
 ?Mathematical formulae have been encoded as MathML and are displayed in this HTML version using MathJax in order to improve their display. Uncheck the box to turn MathJax off. This feature requires Javascript. Click on a formula to zoom.
Abstract
This study performs district and local administrative level multi-hazard zonation of Nepal. As multiple natural hazards are frequent, and their losses are enormous, multi-hazard zonation maps can provide important insights before the occurrence of natural hazards so that effective countermeasures and preparedness efforts can be designed and implemented. To this end, weightage-based multi-hazard zonation of Nepal is performed considering 27,482 independent natural hazard events. We considered 16 natural hazards to perform multi-hazard zonation. The multi-hazard maps prepared in this study highlight that the south-eastern and south-central Nepal depicts a higher level of multi-hazard compared with other regions of the country. However, the local-level multi-hazard zonation outlines highly scattered multi-hazard levels, even in adjoining villages and municipalities.
1. Introduction
In Nepal, natural hazards occur quite frequently. Every year, thousands of people and millions of dollars are lost due to several natural disasters such as floods, landslides, fire, among others. In addition, Nepal is frequently hit by earthquakes that kill thousands of people and cause enormous economic losses. The United Nations Development Program/Bureau of Crisis Prevention and Recovery (UNDP/BCPR) has designated Nepal as the 20th most vulnerable country in terms of multi-hazards; 4th most vulnerable country in terms of climate change-related hazards; 11th most vulnerable country in terms of earthquake hazards; and 30th most vulnerable country in terms of flood disasters (United Nations Development Program/Bureau of Crisis Prevention and Recovery Citation2004). Some of the recent natural disasters in Nepal depict the severity of losses. For instance, the 2015 Gorkha earthquake in Nepal caused ∼7 billion USD economic loss (National Planning Commission Citation2015) and the 2017 flood caused a total loss of 187.9 million USD (Government of Nepal Citation2017). As Nepal is likely to be affected by multiple independent or cascaded natural disasters (Adhikari et al. Citation2019), loss statistics in the future are expected to rise. The study conducted by Gautam and Dong (Citation2018) highlights that the damages to structures in the case of independent multiple natural disasters would be increased by 300% at most. Although several cases of multiple hazards-related damages and losses have surfaced over the past few decades, studies comprising multi-hazard damage, vulnerability, and risk are limited in Nepal. Aryal (Citation2012) has reported casualty distribution across Nepal due to individual disasters. Similarly, Gautam et al. (Citation2020) have depicted district-level windstorm zonation of Nepal. It is pertinent to note that when structures and lifelines are not repaired or strengthened immediately after one disaster, they are likely to be affected by another disaster. For example, the buildings affected by the 2015 Gorkha earthquake were not repaired until the 2017 central Nepal flood, which led to significant damage aggravation (Gautam and Dong Citation2018). As response, recovery, and rehabilitation efforts are not effective in Nepal, it takes several years to bounce back to normalcy when major disasters occur (Platt et al. Citation2020). After the promulgation of the new constitution in 2015, Nepal has endorsed the federal system, which promotes local level planning and development. So quantification of local scale multi-hazard scenario will provide a rational ground for consideration of the level of multi-hazard risk in particular geographical location. In addition, the level of risk will be useful to the provincial and federal governments for resource allocation and planning response, relief, and recovery initiatives.
Multi-hazard zonation is considered as a notable research area worldwide to depict the comparative hazard level in local administrative units. Natural disasters associated with land, ocean, and atmosphere have been widely recognized worldwide, and their severities, as well as impacts, may alter the perspectives and preparedness to fulfil the sustainable development goals (Singh Citation2020). To this end, many researchers considered multi-hazard zonation in several countries considering local boundaries (Bell and Glade Citation2004; Thierry et al. Citation2008; Kappes et al. Citation2012; Siddique and Schwarz Citation2015; Zhou et al. Citation2015; Barua et al. Citation2016; Forte et al. Citation2019). Although multi-hazard risk assessment and hazard mapping are gaining attention in recent years, the major focus is still given for a single natural hazard so far (Fuchs et al. Citation2009; Cao et al. Citation2016; Gautam and Chamlagain Citation2016; Licata et al. Citation2016; Santolo et al. Citation2016; Gautam et al. Citation2017; Gautam Citation2017b; Santo et al. Citation2017; Sajan et al. Citation2020). Despite probabilistic and deterministic assessment of individual hazard, historical event data are also used abundantly to create zonation maps (Büchele et al. Citation2006; Abella et al. 2007; Fuchs et al. Citation2009; Meyer et al. Citation2009; Gautam Citation2017a). Generally, multi-hazard zonation studies comprise two approaches viz. index/score-based methods and mathematical/statistical methods (Liu et al. Citation2013). The index-based method incorporates the level of hazard/vulnerability based on the accumulated score and rating system (Granger and Trevor Citation2000; Bell and Glade Citation2004; UNDP Citation2004; Dilley Citation2005; Siddique and Schwarz Citation2015; Gautam Citation2017a); meanwhile, the statistical method incorporates the losses/damage due to historical events (Grünthal et al. Citation2006; Schmidt et al. Citation2011; Liu et al. Citation2013). Both index-based and statistical methods have been widely used as per the availability of information and advancements are being made over the past decades. Researchers have developed various approaches to address the multi-hazard risk assessment and have applied the concepts in different geographical locations (Depietri et al. Citation2018; Liu et al. Citation2019; Pourghasemi et al. Citation2019; Bani-Mustafa et al. Citation2020; Dabbeek et al. Citation2020; Pourghasemi et al. Citation2020).
To the best of the authors’ knowledge, local level multi-hazard zonation is not reported in the existing literature. As multi-hazard zonation would play important role in resource allocation to disaster preparedness, multi-hazard zonation is a must for Nepal. To fulfil the gap of multi-hazard zonation at local level, this study analyses the historical occurrences and losses due to 16 natural hazards. The weights are assigned per the historical losses and judgment based on the severity of a particular hazard and final normalized scores are categorized to obtain a qualitative multi-hazard level in districts and villages.
2. Data and methods
2.1. Data
The National Disaster Risk Reduction Portal [DRR portal] (www.drrportal.gov.np) records every natural hazard/disaster that occurs in Nepal. The database comprises economic losses, fatalities, injuries, building damage, and several other information after every event. The DRR portal is managed by the Government of Nepal and disaster reports are updated frequently. We retrieved 27,482 incident data between 1971 and 2018 and de-clustered them per the administrative boundaries (districts and villages/municipalities). We classified the number of incidents for earthquake, flood, landslide, fire, forest fire, avalanche, storm, thunderstorm, strong wind, torrential rain, epidemics, heat wave, cold wave, drought, and hailstorm for each district and village/municipality. Data were collected for 75 districts as shown in and 3971 local administrative units (3913 villages and 58 municipalities). A summary of the number of hazard events in each district is presented in .
Figure 1. District level map of Nepal, map numbers indicate (1) Taplejung, (2) Panchthar, (3) Ilam, (4) Jhapa, (5) Sankhuwasabha, (6) Dhankuta, (7) Tehrathum, (8) Morang, (9) Sunsari, (10) Bhojpur, (11) Solukhumbu, (12) Khotang, (13) Udaypur, (14) Saptari, (15) Okhaldhunga, (16) Dolakha, (17) Ramechhap, (18) Sindhuli, (19) Siraha, (20) Dhanusha, (21) Mahottari, (22) Sarlahi, (23) Sindhupalchowk, (24) Kavre, (25) Makwanpur, (26) Bara, (27) Rautahat, (28) Parsa, (29) Rasuwa, (30) Nuwakot, (31) Kathmandu, (32) Bhaktapur, (33) Lalitpur, (34) Dhading, (35) Chitwan, (36) Gorkha, (37) Manang, (38) Lamjung, (39) Tanahun, (40) Nawalparasi, (41) Kaski, (42) Syangja, (43) Palpa, (44) Rupandehy, (45) Parbat, (46) Mustang, (47) Myagdi, (48) Baglung, (49) Gulmi, (50) Arghakhachi, (51) Kapilvastu, (52) Dolpa, (53) Rukum, (54) Rolpa, (55) Pyuthan, (56) Dang, (57) Mugu, (58) Jumla, (59) Jajarkot, (60) Salyan, (61) Banke, (62) Humla, (63) Bajura, (64) Kalikot, (65) Dailekh, (66) Surkhet, (67) Bardiya, (68) Bajhang, (69) Achham, (70) Doti, (71) Kailali, (72) Darchula, (73) Baitadi, (74) Dadeldhura, and (75) Kanchanpur.
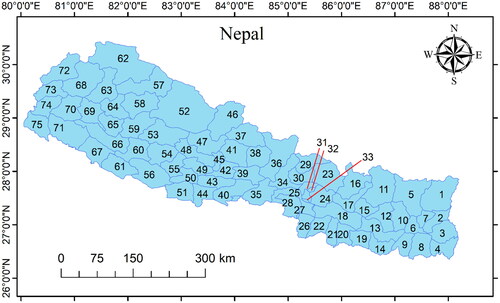
Table 1. Summary of number of natural hazard events in Nepal (1971–2018).
2.2. Methodology
Due to the lack of existing hazard maps based on statistical analyses, it is imperative to use incident-based hazard gradation on an administrative scale, which will be useful in resource prioritization and preparedness. So 16 natural hazards as shown in are selected to construct index-based aggregate hazard scores. The index-based method provides information based on the occurrence of a particular hazard level in the area of interest. A higher number of hazards give rise to a higher level of hazard. Thus, the distribution of incidents governs the hazard index in particular regions. The index-based approach is widely used for hazard zonation in various parts of the world (Granger and Trevor Citation2000; Bell and Glade Citation2004; UNDP Citation2004; Siddique and Schwarz Citation2015; Dilley Citation2005; Thierry et al. Citation2008; Shi et al. Citation2015). Thus, it is imperative to note that the index-based method could be directly implemented in the regions where probabilistic and deterministic analyses of individual hazards are missing. It is worthy to note that the historical records of natural hazards are the most significant factor to assess the multi-hazard level on any scale (Barua et al. Citation2016). This is due to the fact that even the statistical modelling-based approaches encapsulate losses from historical events (Grünthal et al. Citation2006; Schmidt et al. Citation2011; Liu et al. Citation2013). In Nepal, the historical natural hazards are not well documented in terms of losses. Economic losses are reported only for the disasters that occurred after 2000. Thus, the number of natural hazard events is accounted to delineate the relative hazard score. For the qualitative dissemination of natural hazard events, there is no homogenous scaling system in Nepal. This prompted the development of a qualitative intensity scale based on relative scores among the considered administrative units. The principle behind such scaling is based on the fact that a greater number of natural hazards indicate a high hazard level to a particular region. The step-by-step procedure for multi-hazard zonation is presented as follows:
Figure 2. Methodology for multi-hazard zonation.
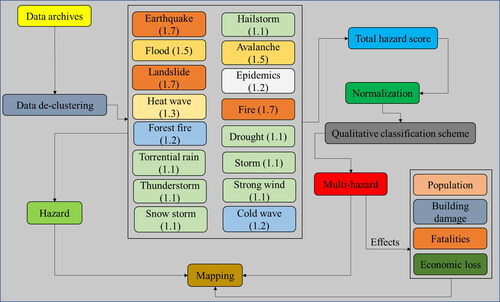
Total number of events for all 16 natural hazards was obtained from the de-clustered data obtained from the disaster portal. For both districts as well as villages/municipalities levels, the total number of hazard events was obtained.
The available economic loss, fatalities, and affected population by each natural hazard were analysed to depict the severity of a particular hazard. Based on the extent of economic loss, fatalities, and affected population, weighting factors were defined between 1 and 2 as shown in .
Once the weighting factors were assigned to each natural hazard, the total hazard score was calculated for each district/village/municipality as the weighted sum as shown in Equation (1):
(1)
Where W indicates the weighting factor and N indicates the number of natural hazard events.
The THS was normalized by dividing the THSs for all districts by the maximum THS among the 75 districts. The normalized value of the THS was obtained in the range of 0 to 1 as follows:
The mean and standard deviations of the THS were estimated, and the qualitative hazard level scheme proposed by Gautam (Citation2017a) was adopted to discern the level of multi-hazard risk. The qualitative scheme to demarcate the level of multi-hazard is presented in .
In the case of local administrative units, the variation of THS was very high, so judgment-based zonation was performed. The threshold values of THS for very high, high, moderate, and low levels of multi-hazards were respectively set as 100, 50, 10, and 5. The THS less than 5 was considered as a very low multi-hazard level condition.
The individual hazard zonation was performed based on the number of hazard events at district level only.
Similarly, district-level multi-hazard zonation for total economic loss due to all hazards, fatalities due to all hazards, affected population due to all hazards, and building damage due to all hazards was performed on a comparative basis. This means the total sum of each parameter was compared among the 75 districts and a classification scheme was adopted as reported in the following section. All the outputs were then mapped using the geographical information system (GIS) tool.
Table 2. Hazard classification scheme (after Gautam Citation2017a).
3. Results and discussions
3.1. Hazard zonation
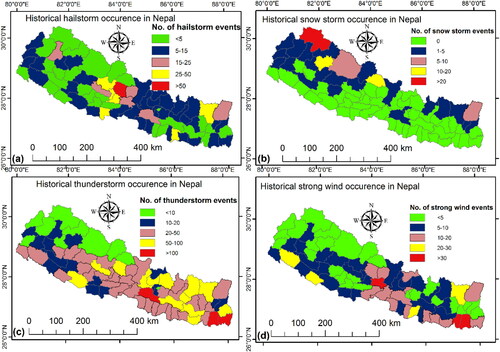
We considered district-level zonation of individual natural hazards based on the total number of reported events. presents the district-level historical earthquake occurrence in Nepal. Although seismic activities are intense all over the country, incident reports were not proportional as we considered the events that occurred between 1971 and 2018 only. Eastern and central Nepal is categorized as high earthquake hazard regions as shown in . It is believed that the central seismic gap that extends from the western to far western Nepal has remained inactive for more than 500 years; thus, seismic events were limited to this part of the country. The 2015 Gorkha earthquake claimed 8790 lives together with the estimated loss of US$7 billion (National Planning Commission Citation2015). So the occurrence of moderate to strong earthquakes in Nepal would be detrimental in almost every part of the country. depicts historical flood occurrence in Nepal. Flood occurrence in the southern parts of Nepal is intense than the rest of the areas. Due to low relief and aggradation, flood events are frequent in the southern plains every year (Thapa et al. Citation2020). Consequently, the flood hazard zonation map indicates the southern plains as high flood hazard-prone areas. The flood occurrence in south-eastern Nepal is depicted to be higher than that in the south-central and south-western Nepal. Losses due to floods range from structure to infrastructure damage and on many occasions loss of lives and properties as well (Adhikari et al. Citation2019; Thapa et al. Citation2020). So flood hazard in Nepal would cause significant damage to the structures and infrastructures in the southern plains of Nepal in the future too. This prompts the necessity of flood resilient constructions and consideration of flood hazard in settlement planning. presents district-level landslide hazard occurrence based on historical landslide events. As Siwalik and middle mountains are relatively younger and have fragile geology, landslide hazard is particularly concentrated in these regions of Nepal. The intensity of landslide is higher in central mountains, whereas far-western Nepal has less intensity of landslides. As expected, the southern part of the country depicts very low landslide hazard level due to flat terrain. As shown in , avalanche occurrence in Nepal is mainly concentrated in the high mountain districts only. Comparatively, western mountains observe more avalanches than the eastern mountains. However, the maximum avalanche per district was observed in the district where the Everest is located, i.e. Solukhumbu (see ). Notable damages directly due to avalanches are seldom reported in Nepal; however, the subsequent flash floods have triggered notable damages in the downstream regions sometimes. Due to lack of adequate monitoring mechanisms, most of the avalanches remain unnoticed and unrecorded in Nepal. outlines historical hailstorm occurrence in Nepal. As shown in , the far-eastern mountains and the middle mountains of the western part of the country observed higher hailstorm events compared with the other parts. The western mountains depict very low hailstorm occurrence; however, the rest of the parts of the country depict low level of hailstorm event occurrence. Hailstorms commonly occur in Nepal during spring and destroy crops and vegetables. District-level snowstorm zonation is presented in . As snowfall in Nepal is limited to high mountains only, the northern part of the country depicts a higher number of snow events. The western mountains of Nepal observe more snowfall than the eastern and central parts. presents the district-level zonation map for thunderstorm occurrence in Nepal. During every spring and summer, thunderstorms occur especially in the eastern and central regions of the country (). A greater number of thunderstorm events were recorded in the far-eastern plains of Nepal. The high mountains in the far-western region recorded the least number of thunderstorms. depicts the historical strong wind occurrence in Nepal. The southern part of the country as well as the central mountains of Nepal observed a higher number of strong wind events compared with other parts of the country between 1971 and 2018. Similarly, the far-western plains and far-eastern mountains also depict considerably a large number of strong wind events. Strong winds in plain areas and mountains would be governed by the variation of pressure. The recent devastating wind storm that affected south-central Nepal depicts that local pressure variation may create devastating wind storms (Gautam et al. Citation2020).
Figure 3. District-level hazard zonation of Nepal (1971–2018): (a) earthquake, (b) flood, (c) landslide, (d) avalanche.
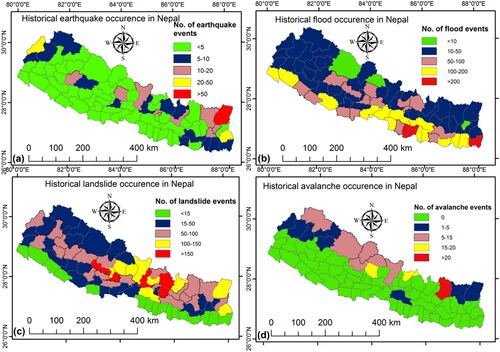
Figure 4. District-level hazard zonation of Nepal (1971–2018): (a) hailstorm, (b) snowstorm, (c) thunderstorm, (d) strong wind.
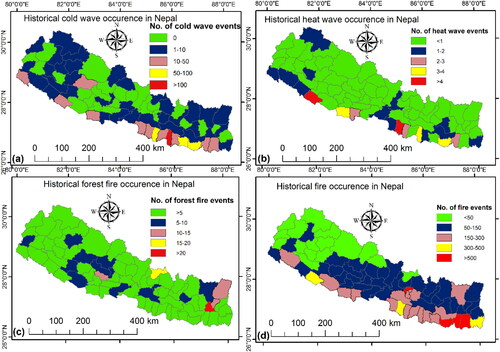
Every winter, cold waves occur in the southern parts of Nepal and affect a large number of populations. presents zonation for cold wave occurrence in Nepal. As shown in , central Nepal observes more cold wave events than the other regions. The Siwalik, middle, and high mountain districts in Nepal observe less cold wave events. The southern plains of Nepal not only observe the cold wave events but also a significant number of heat wave events too. Historical occurrence of heat wave in Nepal is presented in . depicts that the southern plains observe a greater number of heat and cold wave events. The southern plains of Nepal are susceptible to heat waves during summer and cold waves during winter. The impacts of heat and cold waves would be concentrated in the regions where people with low-economic status reside, as they cannot afford heating and cooling demand or logistic arrangements. Homelessness is rare in Nepal; however, the low-cost dwellings are usually wattle and daub and they do not prohibit heat and cold. During the spring season, forest fire events are quite common in Nepal. Forest fires are generally concentrated in the middle to high mountains and especially in the eastern part of the country as shown in . The far-western part of the country observes the least number of forest fire events. Fire events are frequent in the southern plains of Nepal due to strong wind during the spring season. The fire events that affect population and buildings are presented in the zonation map (). depicts that the eastern plains and capital city observed a greater number of fire events compared with the other parts of the country. The far-western mountains of Nepal depict a lesser number of household-level fire events.
Figure 5. District-level hazard zonation of Nepal (1971–2018): (a) cold wave, (b) heat wave, (c) forest fire, (d) fire.
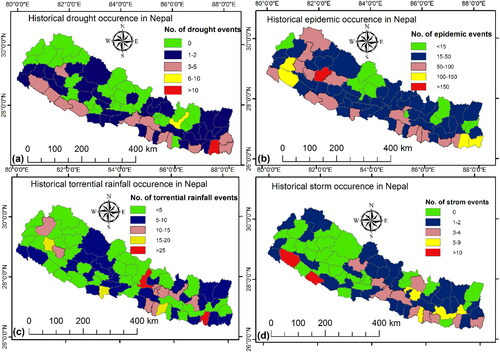
Historical drought occurrence in Nepal is presented in . Particularly, drought events are more concentrated in the southern plains of Nepal. Similarly, the middle mountains occasionally observe drought due to their location in the leeward direction of rainfall. As shown in , the concentration of drought events in the eastern plains is higher than the western plains in Nepal. District-level epidemics hazard zonation of Nepal is presented in . As shown in , the western part of the country is particularly susceptible to frequent epidemic events. Due to lack of adequate countermeasures against hygiene and response mechanisms, the western part of the country observes epidemic events quite often. On the contrary, due to better health and hygiene measures, the eastern and central regions have observed a smaller number of epidemic events. The yearly rainfall cycle in Nepal occurs between June and September. Torrential rainfall in Nepal is quite common during this period. presents the zonation map for torrential rainfall in Nepal. As shown in , eastern and central regions in Nepal have a higher number of torrential rainfall events compared with the western part of the country. Meanwhile, torrential rainfall distribution is sparse throughout the country. The western high mountains observe a lesser number of torrential rainfalls compared with the other parts. District-level storm hazard is presented in . As shown in the figure, the southern and central parts of the country observe a greater number of storm hazards than the other parts. Storms usually occur in the spring and summer seasons in Nepal and cause extensive damages to crop and non-engineered buildings.
Figure 6. District-level hazard zonation of Nepal (1971–2018): (a) drought, (b) epidemic, (c) torrential rainfall, (d) storm.
3.2. Multi-hazard zonation
Multiple independent and cascading hazard events are quite common in Nepal. Thus, the individual hazard zonation presented above may be too conservative to depict proper insights in terms of overall hazard level and to allocate resources or pre-disaster planning. Thus, weighted multi-hazard zonation was performed in the district and local administrative scales. depicts district-level multi-hazard zonation of Nepal. As shown in , the eastern part of the country is more multi-hazard prone than the western parts. It is fundamentally due to the occurrence of most of the natural hazards in the eastern and central regions. Moreover, the southern plain of the eastern region falls under very high multi-hazard level. As significantly large fraction of the population is concentrated in the eastern and central plains of Nepal, high to very high levels of multi-hazards in this region may affect a large population. This may create additional challenges in response, relief, and recovery efforts as well as pertain enormous economic losses. summarizes the level of multi-hazard at district level. As shown in , seven districts are categorized under very high multi-hazard level, 11 districts under high multi-hazard level, 30 districts under moderate multi-hazard level, 25 districts under low multi-hazard level, and two districts under very low multi-hazard level. Thus, it is clear that more than 60% of districts in Nepal are susceptible to depict moderate to severe multi-hazard levels.
Figure 7. District-level multi-hazard zonation of Nepal.
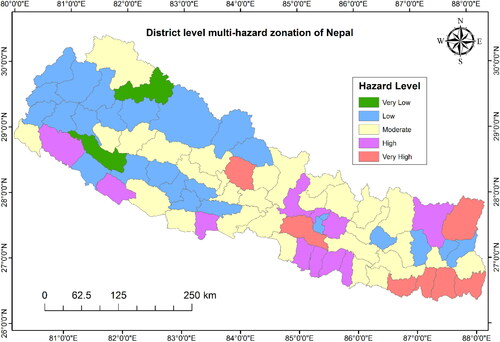
Table 3. Level of multi-hazards in districts of Nepal.
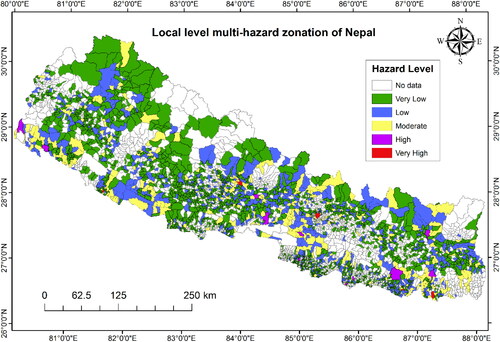
Until 2016, there were 75 districts, 3913 village development committees (VDCs), and 58 municipalities in Nepal. The smallest administrative unit is the ward. However, after the endorsement of the federal system in 2016, the VDCs were generally converted as the wards of rural municipalities or municipalities. As our data are based on the VDC system, we presented multi-hazard zonation of Nepal at local level considering the same VDCs and municipalities as shown in . In terms of local-level multi-hazard zonation, the eastern and central regions depict a higher level of multi-hazard, which is consistent with the district-level multi-hazard zonation. Although the general characteristics of multi-hazard levels are matched in a broader context, local-level mapping depicts more discrete zones. As many hazard events were reported at district level only, a large number of VDCs showed no data for any hazard as shown in . No data in could be either due to lack of natural hazard events or due to lack of recording in the data repository. The local administrative units (VDCs/municipalities) in the south-eastern and central mountains depict higher hazard levels than the other areas as shown in .
Figure 8. Local-level multi-hazard zonation of Nepal.
3.3. Multi-hazard impacts
After multi-hazard zonation, we assessed the impacts of historical multi-hazard events. As shown in , the central and eastern plains of Nepal depict the largest population exposure together with some areas in the far-western region. As population density in the eastern and central regions is higher than the other parts of the country, it is obvious that more population would be affected by multi-hazards in these regions. depicts building damage due to multi-hazards in Nepal. The concentration of building damage is more in eastern and central Nepal. Building damage is limited in the far-western mountains of Nepal. This is due to less building population in this region. shows fatalities due to multi-hazards in Nepal. As shown in , a greater number of fatalities were recorded in the central and western regions of Nepal. Although the level of multi-hazard was severe in eastern and central Nepal, fatalities were recorded more in the central and western regions. Even in the far-western mountains where population density is very less, fatalities were considerably large. Thus, it could be stated that the western parts of Nepal would observe more fatalities due to multi-hazards than the eastern and central parts. depicts the economic losses due to multi-hazards in Nepal. The eastern plains and central mountains depict higher economic losses than any other region of Nepal. Due to the frequent occurrence of natural hazards, economic losses were more concentrated in these regions. Although multi-hazard level was relatively lower than the eastern and central regions in the far-western region, economic losses are almost similar. Thus, it should be noted that there would be enormous economic consequences in the case of the occurrence of an individual as well as multiple natural hazards in the western parts of the country. As reported by Gautam (Citation2017a), the western mountains in Nepal have higher social vulnerability due to natural hazards compared with the eastern and central regions. Thus, the impacts of natural hazards in the western parts of the country would be in particular detrimental due to lack of adequate preparedness, planning, availability of resources, and mechanisms to counteract the natural hazards.
Figure 9. District-level zonation of multi-hazard impacts (1971–2018): (a) affected population, (b) building damage, (c) fatalities, (d) economic loss [USD 1≈ NRs. 110].
![Figure 9. District-level zonation of multi-hazard impacts (1971–2018): (a) affected population, (b) building damage, (c) fatalities, (d) economic loss [USD 1≈ NRs. 110].](/cms/asset/ee0cdd9d-61ed-4297-9a85-8eafc1dccb20/tgnh_a_1879941_f0009_c.jpg)
4. Conclusions
Multi-hazard zonation may indicate the likely areas to be more affected during natural hazard events. Furthermore, preparedness measures could also be implemented once the hazard level is known. Thus, to perform local-level multi-hazard zonation of Nepal, we collected 27,482 recorded events from the government data repository and estimated weighted total hazard score and categorized districts and VDCs/municipalities of Nepal under very high, high, moderate, low, and very low hazard levels. Despite multi-hazard mapping, individual hazard mapping is also presented in this study. The consequences of multi-hazards in terms of economic losses, fatalities, affected population, and building damage are also mapped at the district-level. The sum of observations and mapping depicts that the eastern and central regions of Nepal observe high to very high multi-hazard levels compared with the other parts of the country. However, based on the 16 natural hazard events, the fatalities in the western region are considerably large despite the low severity of multi-hazard occurrence. In general, the southern part of Nepal has a higher level of multi-hazard as well as losses due to population concentration and the occurrence of many types of natural hazards.
This study presents the results based on historical natural hazard events only. Future studies may incorporate probabilistic and deterministic assessment of individual natural hazards and consider multi-hazard zonation using statistical analyses. This study derives weightage based on economic loss, fatalities, affected population, and building damage due to each natural hazard. In the case of the inclusion of other parameters, the weighting factors may also change. The zonation maps could be effectively improved with updated data in the future.
Data availability statement
The data used in this paper can be retrieved from the Government of Nepal, DRR portal repository (www.drrportal.gov.np).
Disclosure statement
No potential conflict of interest was reported by the authors.
References
- Abella EAC, Van Westen CJ. 2007. Generation of a landslide risk index map for Cuba using spatial multi-criteria evaluation. Landslides. 4(4):311–325.
- Adhikari R, Gautam D, Jha P, Aryal B, Ghalan K, Rupakhety R, Dong Y, Rodrigues H, Motra G. 2019. Bridging multi-hazard vulnerability and sustainability: approaches and applications to Nepali highway bridges. In: Noroozinejad Farsangi E, Takewaki I, Yang T, Astaneh-Asl A, Gardoni P, editors. Resilient structures and infrastructure. Singapore: Springer. pp.361–378.
- Aryal KR. 2012. The history of disaster incidents and impacts in Nepal 1900–2005. Int J Disaster Risk Sci. 3(3):147–154.
- Bani-Mustafa T, Zeng Z, Zio E, Vasseur D. 2020. A new framework for multi-hazards risk aggregation. Saf Sci. 121:283–302.
- Barua U, Akhter MS, Ansary MA. 2016. District-wise multi-hazard zoning of Bangladesh. Nat Hazards. 82(3):1895–1918.
- Bell R, Glade T. 2004. Multi-hazard analysis in natural risk assessments. In: Brebbia CA, editor. Management information systems. United Kingdom: WIT Press. pp.197–206.
- Büchele B, Kreibich H, Kron A, Thieken A, Ihringer J, Oberle P, Merz B, Nestmann F. 2006. Flood-risk mapping: contributions towards an enhanced assessment of extreme events and associated risks. Nat Hazards Earth Syst Sci. 6(4):485–503.
- Cao C, Xu P, Wang Y, Chen J, Zheng L, Niu C. 2016. Flash flood hazard susceptibility mapping using frequency ratio and statistical index methods in coalmine subsidence areas. Sustainability. 8(9):948.
- Dabbeek J, Silva V, Galasso C, Smith A. 2020. Probabilistic earthquake and flood loss assessment in the Middle East. Int J Disaster Risk Reduct. 49:101662.
- Depietri Y, Dahal K, McPhearson T. 2018. Multi-hazard risks in New York City. Nat Hazards Earth Syst Sci. 18(12):3363–3381.
- Dilley M. 2005. Natural disaster hotspots: a global risk analysis. Washington (DC): The World Bank.
- Forte G, De Falco M, Santangelo N, Santo A. 2019. Slope stability in a multi-hazard eruption scenario (Santorini, Greece). Geosciences. 9(10):412.
- Fuchs S, Spachinger K, Dorner W, Rochman J, Serrhini K. 2009. Evaluating cartographic design in flood risk mapping. Environ Hazards. 8(1):52–70.
- Gautam D. 2017a. Assessment of social vulnerability to natural hazards in Nepal. Nat Hazards Earth Syst Sci. 17(12):2313–2320.
- Gautam D. 2017b. Mapping surface motion parameters and liquefaction susceptibility in Tribhuvan International Airport, Nepal. Geomatics Nat Hazards Risk. 8(2):1173–1184.
- Gautam D, Adhikari R, Jha P, Rupakhety R, Yadav M. 2020. Windstorm vulnerability of residential buildings and infrastructures in South-Central Nepal. J Wind Eng Ind Aerodyn. 198:104113.
- Gautam D, Chamlagain D. 2016. Preliminary assessment of seismic site effects in the fluvio-lacustrine sediments of Kathmandu valley. Nat Hazards. 81(3):1745–1769.
- Gautam D, Chaulagain H, Rodrigues H, Shahi HR. 2017. Ground response based preliminary microzonation of Kathmandu valley. Geotech Eng. 48(4):87–92.
- Gautam D, Dong Y. 2018. Multi-hazard vulnerability of structures and lifelines due to the 2015 Gorkha Earthquake and 2017 Central Nepal Flash Flood. J Build Eng. 17:196–201.
- Government of Nepal. 2017. “Nepal Flood 2017: Post Flood Recovery Needs Assessment.” Kathmandu.
- Granger K, Trevor J. 2000. A multi-hazard risk assessment. In: Middleman M, Granger K, editors. Community risk in MacKay: a multi-hazard risk assessment. Canberra: Australian Geological Survey Organization, pp. 126–156.
- Grünthal G, Thieken AH, Schwarz J, Radtke KS, Smolka A, Merz B. 2006. Comparative risk assessments for the city of Cologne - storms, floods, earthquakes. Nat Hazards. 38(1–2):21–44.
- Kappes MS, Keiler M, von Elverfeldt K, Glade T. 2012. Challenges of analyzing multi-hazard risk: a review. Nat Hazards. 64(2):1925–1958.
- Licata V, Forte G, D’Onofrio A, Evangelista L, Jalayer F, Santo A, Silvestri F. 2016. Microzonation study on the Western area of Napoli. Procedia Eng. 158:511–516.
- Liu B, Fan J, Siu YL, Mitchell G. 2019. A multi-hazard map of China. Environ Plann A. 51(1):8–10.
- Liu B, Siu YL, Mitchell G, Xu W. 2013. Exceedance probability of multiple natural hazards: risk assessment in China’s Yangtze River Delta. Nat Hazards. 69(3):2039–2055.
- Meyer V, Scheuer S, Haase D. 2009. A multicriteria approach for flood risk mapping exemplified at the Mulde River, Germany. Nat Hazards. 48(1):17–39.
- National Planning Commission. 2015. “Post Disaster Need Assessment.” Kathmandu.
- Platt S, Gautam D, Rupakhety R. 2020. Speed and quality of recovery after the Gorkha Earthquake 2015 Nepal. Int J Disaster Risk Reduct. 50:101689.
- Pourghasemi HR, Gayen A, Panahi M, Rezaie F, Blaschke T. 2019. Multi-hazard probability assessment and mapping in Iran. Sci Total Environ. 692:556–571.
- Pourghasemi HR, Kariminejad N, Amiri M, Edalat M, Zarafshar M, Blaschke T, Cerda A. 2020. Assessing and mapping multi-hazard risk susceptibility using a machine learning technique. Sci Rep. 10(1):1–11.
- Sajan KC, Bhochhibhoya S, Adhikari P, Adhikari P, Gautam D. 2020. Probabilistic seismic liquefaction hazard assessment of Kathmandu valley, Nepal. Geomatics Nat Hazards Risk. 11(1):259–271.
- Santo A, Santangelo N, Forte G, De Falco M. 2017. Post flash flood survey: the 14th and 15th October 2015 event in the Paupisi-Solopaca area (Southern Italy). J Maps. 13(2):19–25.
- Santolo ASD, Forte G, Falco MD, Santo A. 2016. Sinkhole risk assessment in the metropolitan area of Napoli, Italy. Procedia Eng. 158:458–463.
- Schmidt J, Matcham I, Reese S, King A, Bell R, Henderson R, Smart G, Cousins J, Smith W, Heron D. 2011. Quantitative multi-risk analysis for natural hazards: a framework for multi-risk modelling. Nat Hazards. 58(3):1169–1192.
- Shi P, Wang J, Xu W, Ye T, Yang S, Liu L, Fang W, Liu K, Li N, Wang M. 2015. “World Atlas of Natural Disaster Risk.”
- Siddique MS, Schwarz J. 2015. Elaboration of multi-hazard zoning and qualitative risk maps of Pakistan. Earthquake Spectra. 31(3):1371–1395.
- Singh RP. 2020. Earth observation and sustainable development goals. Geomatics Nat Hazards Risk. 11(1):i–vi.
- Thapa S, Shrestha A, Lamichhane S, Adhikari R, Gautam D. 2020. Catchment-scale flood hazard mapping and flood vulnerability analysis of residential buildings: the case of Khando River in Eastern Nepal. J Hydrol: Reg Stud. 30:100704.
- Thierry P, Stieltjes L, Kouokam E, Nguéya P, Salley PM. 2008. Multi-hazard risk mapping and assessment on an active volcano: the GRINP project at Mount Cameroon. Nat Hazards. 45(3):429–456.
- UNDP. 2004. “Reducing Disaster Risk: A Challenge for Development.” New York.
- United Nations Development Program/Bureau of Crisis Prevention and Recovery. 2004. “Reducing Disaster Risk: A Challenge for Development.” New York.
- Zhou Y, Liu Y, Wu W, Li N. 2015. Integrated risk assessment of multi-hazards in China. Nat Hazards. 78(1):257–280.